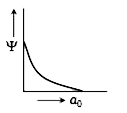
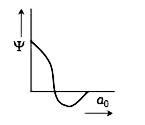
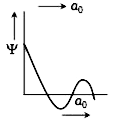
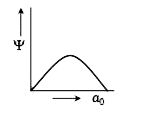
Which of the following graphs correspond to one node ?
A
B
C
D
Video Solution
Text Solution
The correct Answer is:B
Node is indicated when Schrondinger wave equation has a root, which is indicated on graph when it crosses the axis.
|
Updated on:21/07/2023
Topper's Solved these Questions
- BOOK - ERRORLESSCHAPTER - STRUCTURE OF ATOMEXERCISE - NCERT BASED QUESTIONS (Quantum Number, Electronic Configuration and Shape of Orbitals)95videos
STRUCTURE OF ATOM
- BOOK - ERRORLESSCHAPTER - STRUCTURE OF ATOMEXERCISE - PAST YEARS QUESTIONS60videos
STRUCTURE OF ATOM
- BOOK - ERRORLESSCHAPTER - STRUCTURE OF ATOMEXERCISE - NCERT BASED QUESTIONS (Dual Nature of Electron)16videos
STRUCTURE OF ATOM
- BOOK - ERRORLESSCHAPTER - STATES OF MATTER EXERCISE - ASSERTION AND REASON11videos
STATES OF MATTER
- BOOK - ERRORLESSCHAPTER - THE P-BLOCK ELEMENTS (BORON AND CARBON FAMILY)EXERCISE - Assertion & Reason10videos
THE P-BLOCK ELEMENTS (BORON AND CARBON FAMILY)
Similar Questions
Knowledge Check
- Question 1 - Select One
In a given population of 2000 indivials, 80 births and 125 deaths were reported over a given period of time. Which of the following graphs will correspond to it ?
A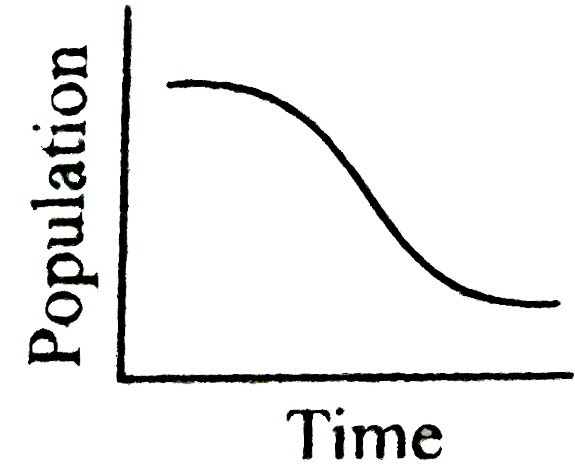 B
B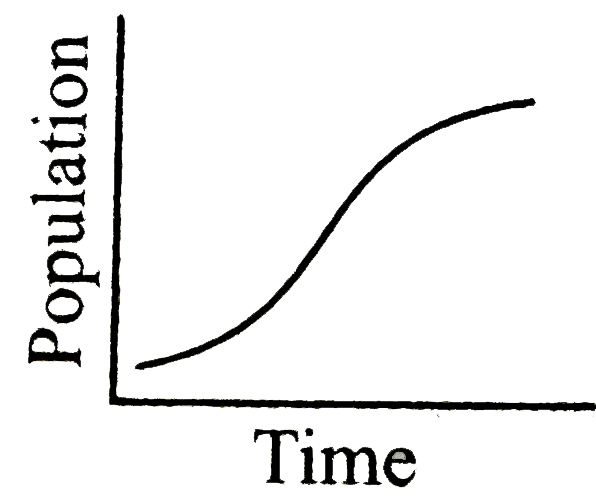 C
C D
D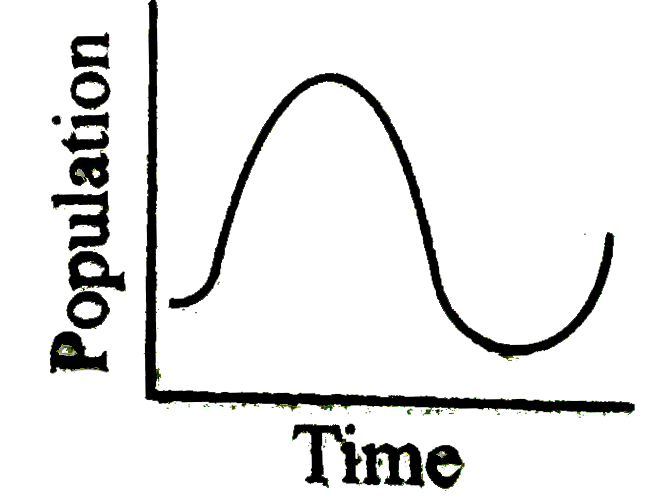
- Question 2 - Select One
Which of the following corresponds to one node ?
A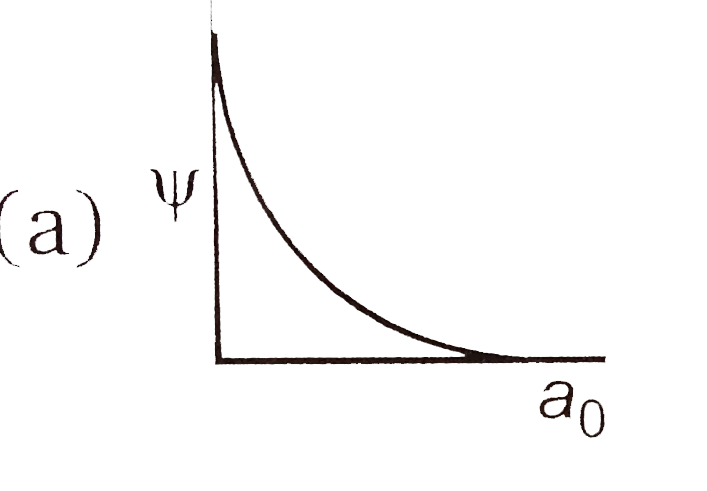 B
B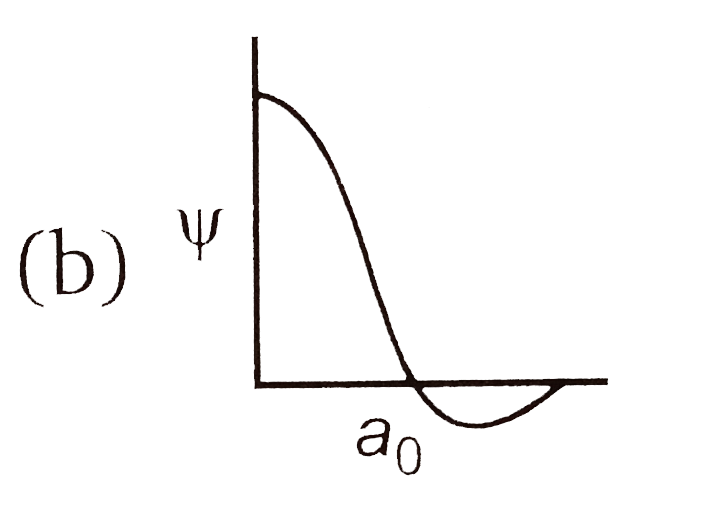 C
C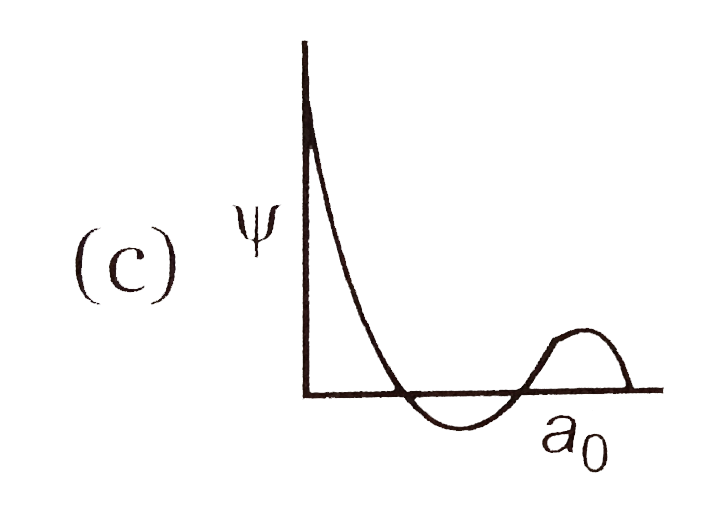 D
D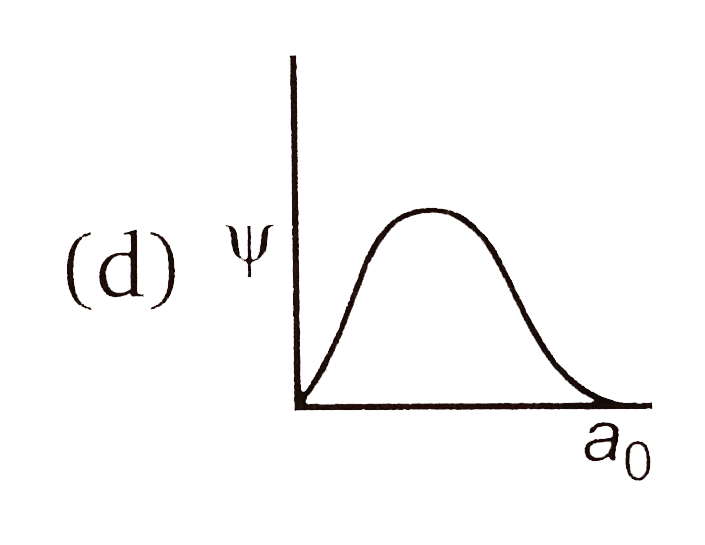
- Question 3 - Select One
Which of the following graph corresponds to a population of 2000 individuals, with 800 births and 1200 deaths over a given period of time?
A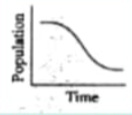 B
B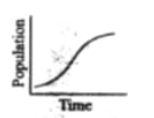 C
C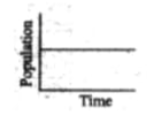 D
D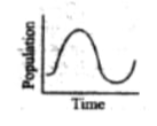
Which of the following corresponds to mutagens
View SolutionWhich of the following graphs cannot represent one dimensional motion of a particle?
View SolutionThe graph below shws the velocity versus time graph for a body
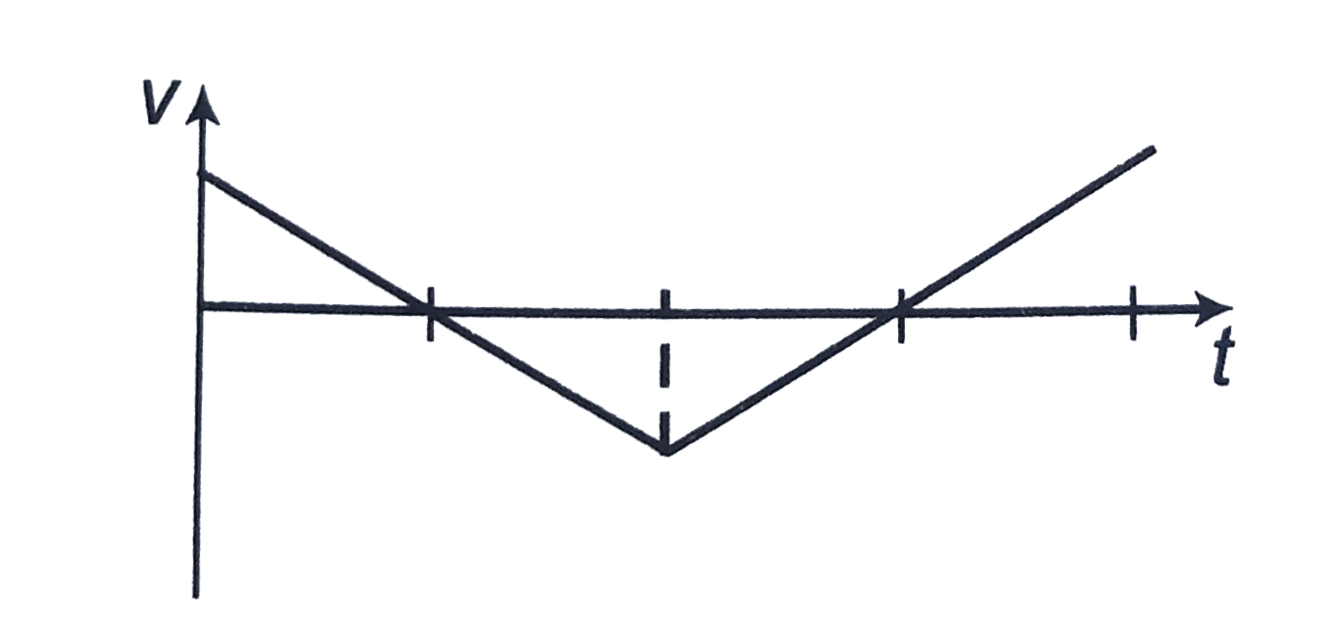
Which of the following graph represents the corresponding acceleration v//s time graph?View SolutionWhich one of the following graph is correct at constant pressure?
View SolutionWhich one of the following graphs correctly gives the ideal gas behaviour ?
View Solution

