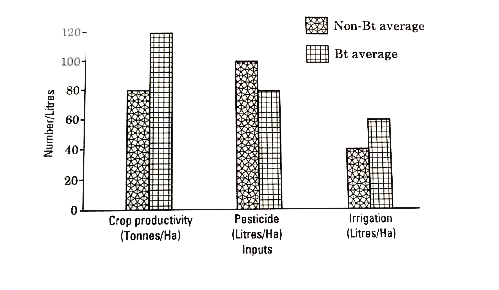
There are two different farm lands, one where Bt-cotton crop was cultivated and the other where non Bt-cotton crop (indigenous) was cultivated. Farmers responsible for this experimental cultivation were free to use the farming practices of their choice. During the cultivation period, the data was collected with respect to the amount of pesticide used, water required for irrigation and at harvesting time, the crop productivity. Based on the data collected, a bar graph was plotted which is shown below.

Answer the following questions:
(i) Write your interpretation, with reason, on the basis of the three parameters plotted in the graph.
(ii) Which one of the crops would you like to cultivate in your farm and why?
(iii) Which one out of these two crops would a farmer from Rajasthan like to cultivate and why?
Step by step video & image solution for There are two different farm lands, one where Bt-cotton crop was cultivated and the other where non Bt-cotton crop (indigenous) was cultivated. Farmers responsible for this experimental cultivation were free to use the farming practices of their choice. During the cultivation period, the data was collected with respect to the amount of pesticide used, water required for irrigation and at harvesting time, the crop productivity. Based on the data collected, a bar graph was plotted which is shown below. Answer the following questions: (i) Write your interpretation, with reason, on the basis of the three parameters plotted in the graph. (ii) Which one of the crops would you like to cultivate in your farm and why? (iii) Which one out of these two crops would a farmer from Rajasthan like to cultivate and why? by Biology experts to help you in doubts & scoring excellent marks in Class 12 exams.
Updated on:21/07/2023Topper's Solved these Questions
- QUESTION PAPER 2022 SET-2BOOK - XII BOARDS PREVIOUS YEARCHAPTER - QUESTION PAPER 2022 SET-2EXERCISE - SECTION B
8 Videos
- QUESTION PAPER 2022 SET-1BOOK - XII BOARDS PREVIOUS YEARCHAPTER - QUESTION PAPER 2022 SET-1EXERCISE - Section-C
5 Videos
- QUESTION PAPER 2022 SET-3BOOK - XII BOARDS PREVIOUS YEARCHAPTER - QUESTION PAPER 2022 SET-3EXERCISE - SECTION C
8 Videos
Similar Questions
Knowledge Check
Crop cultivation was first started in
ANile river valleyBChinese river valleyCNorthern plains of IndiaDAll of the aboveFor which of the following crops does India have the largest cultivated area in the world?
AWheatBRiceCPulsesDCottonThe most ideal region for the cultivation of cotton in india is
AThe Brahamputra valleyBThe Deccan PlateauCThe Indo Gangetic ValleyDThe Rann of Kutch
Which one of the following soils is most suitable for cotton cultivation?
View SolutionMeaning of prefix Bt in Bt-cotton is
View SolutionChoose the right answers of the followings from the given options:
Which one of the following crops is not cultivated under dryland farming?
View SolutionFor clothing cotton cultivation was first introduced in
View SolutionWhich of the following soils in India is ideal for cultivation of cotton?
View Solution

