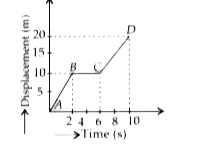
This figure represents a displacement-time graph of an object moving along a straight line.
 .
.
(a) Describe the motion of the body during the 10 s.
(b) How far did the object travel in the first 2 s ?
(c) What was the velocity of the object during the first 2 s ?
(d) What was the velocity during the next 4 s ?
(e) What was it during the last 4 s ?
(a) For part AB, the object moved with a uniform velocity, for part BC, it was at rest and for part CD, it again moved with some other uniform velocity.
(b) In the first 2s, it covered 10 m.
(c) Since velocity is given by the slope of the displacement-time graph i.e.,
Velocity=DisplacementTime
Velocity during the first 2 s (along AB)
=(10−0)(2−0)=5m/s
(d) Velocity during the next 4 s (along BC)
=(10−10)(6−2)=0m/s
(e) Velocity during the last 4 s (along CD)
=(20−10)(10−6)=2.5m/s.
Topper's Solved these Questions
- BOOK - MTG IIT JEE FOUNDATIONCHAPTER - MOTIONEXERCISE - NCERT Section22videos
MOTION
- BOOK - MTG IIT JEE FOUNDATIONCHAPTER - MOTIONEXERCISE - Exercise (MCQ.s) Level-130videos
MOTION
- BOOK - MTG IIT JEE FOUNDATIONCHAPTER - MOTIONEXERCISE - Olympiad/HOTS Corner21videos
MOTION
- BOOK - MTG IIT JEE FOUNDATIONCHAPTER - GRAVITATION EXERCISE - Olympiad/HOTS Corner20videos
GRAVITATION
- BOOK - MTG IIT JEE FOUNDATIONCHAPTER - SOUNDEXERCISE - Olympiad/HOTS Corner15videos
SOUND
Similar Questions
Knowledge Check
- Question 1 - Select One
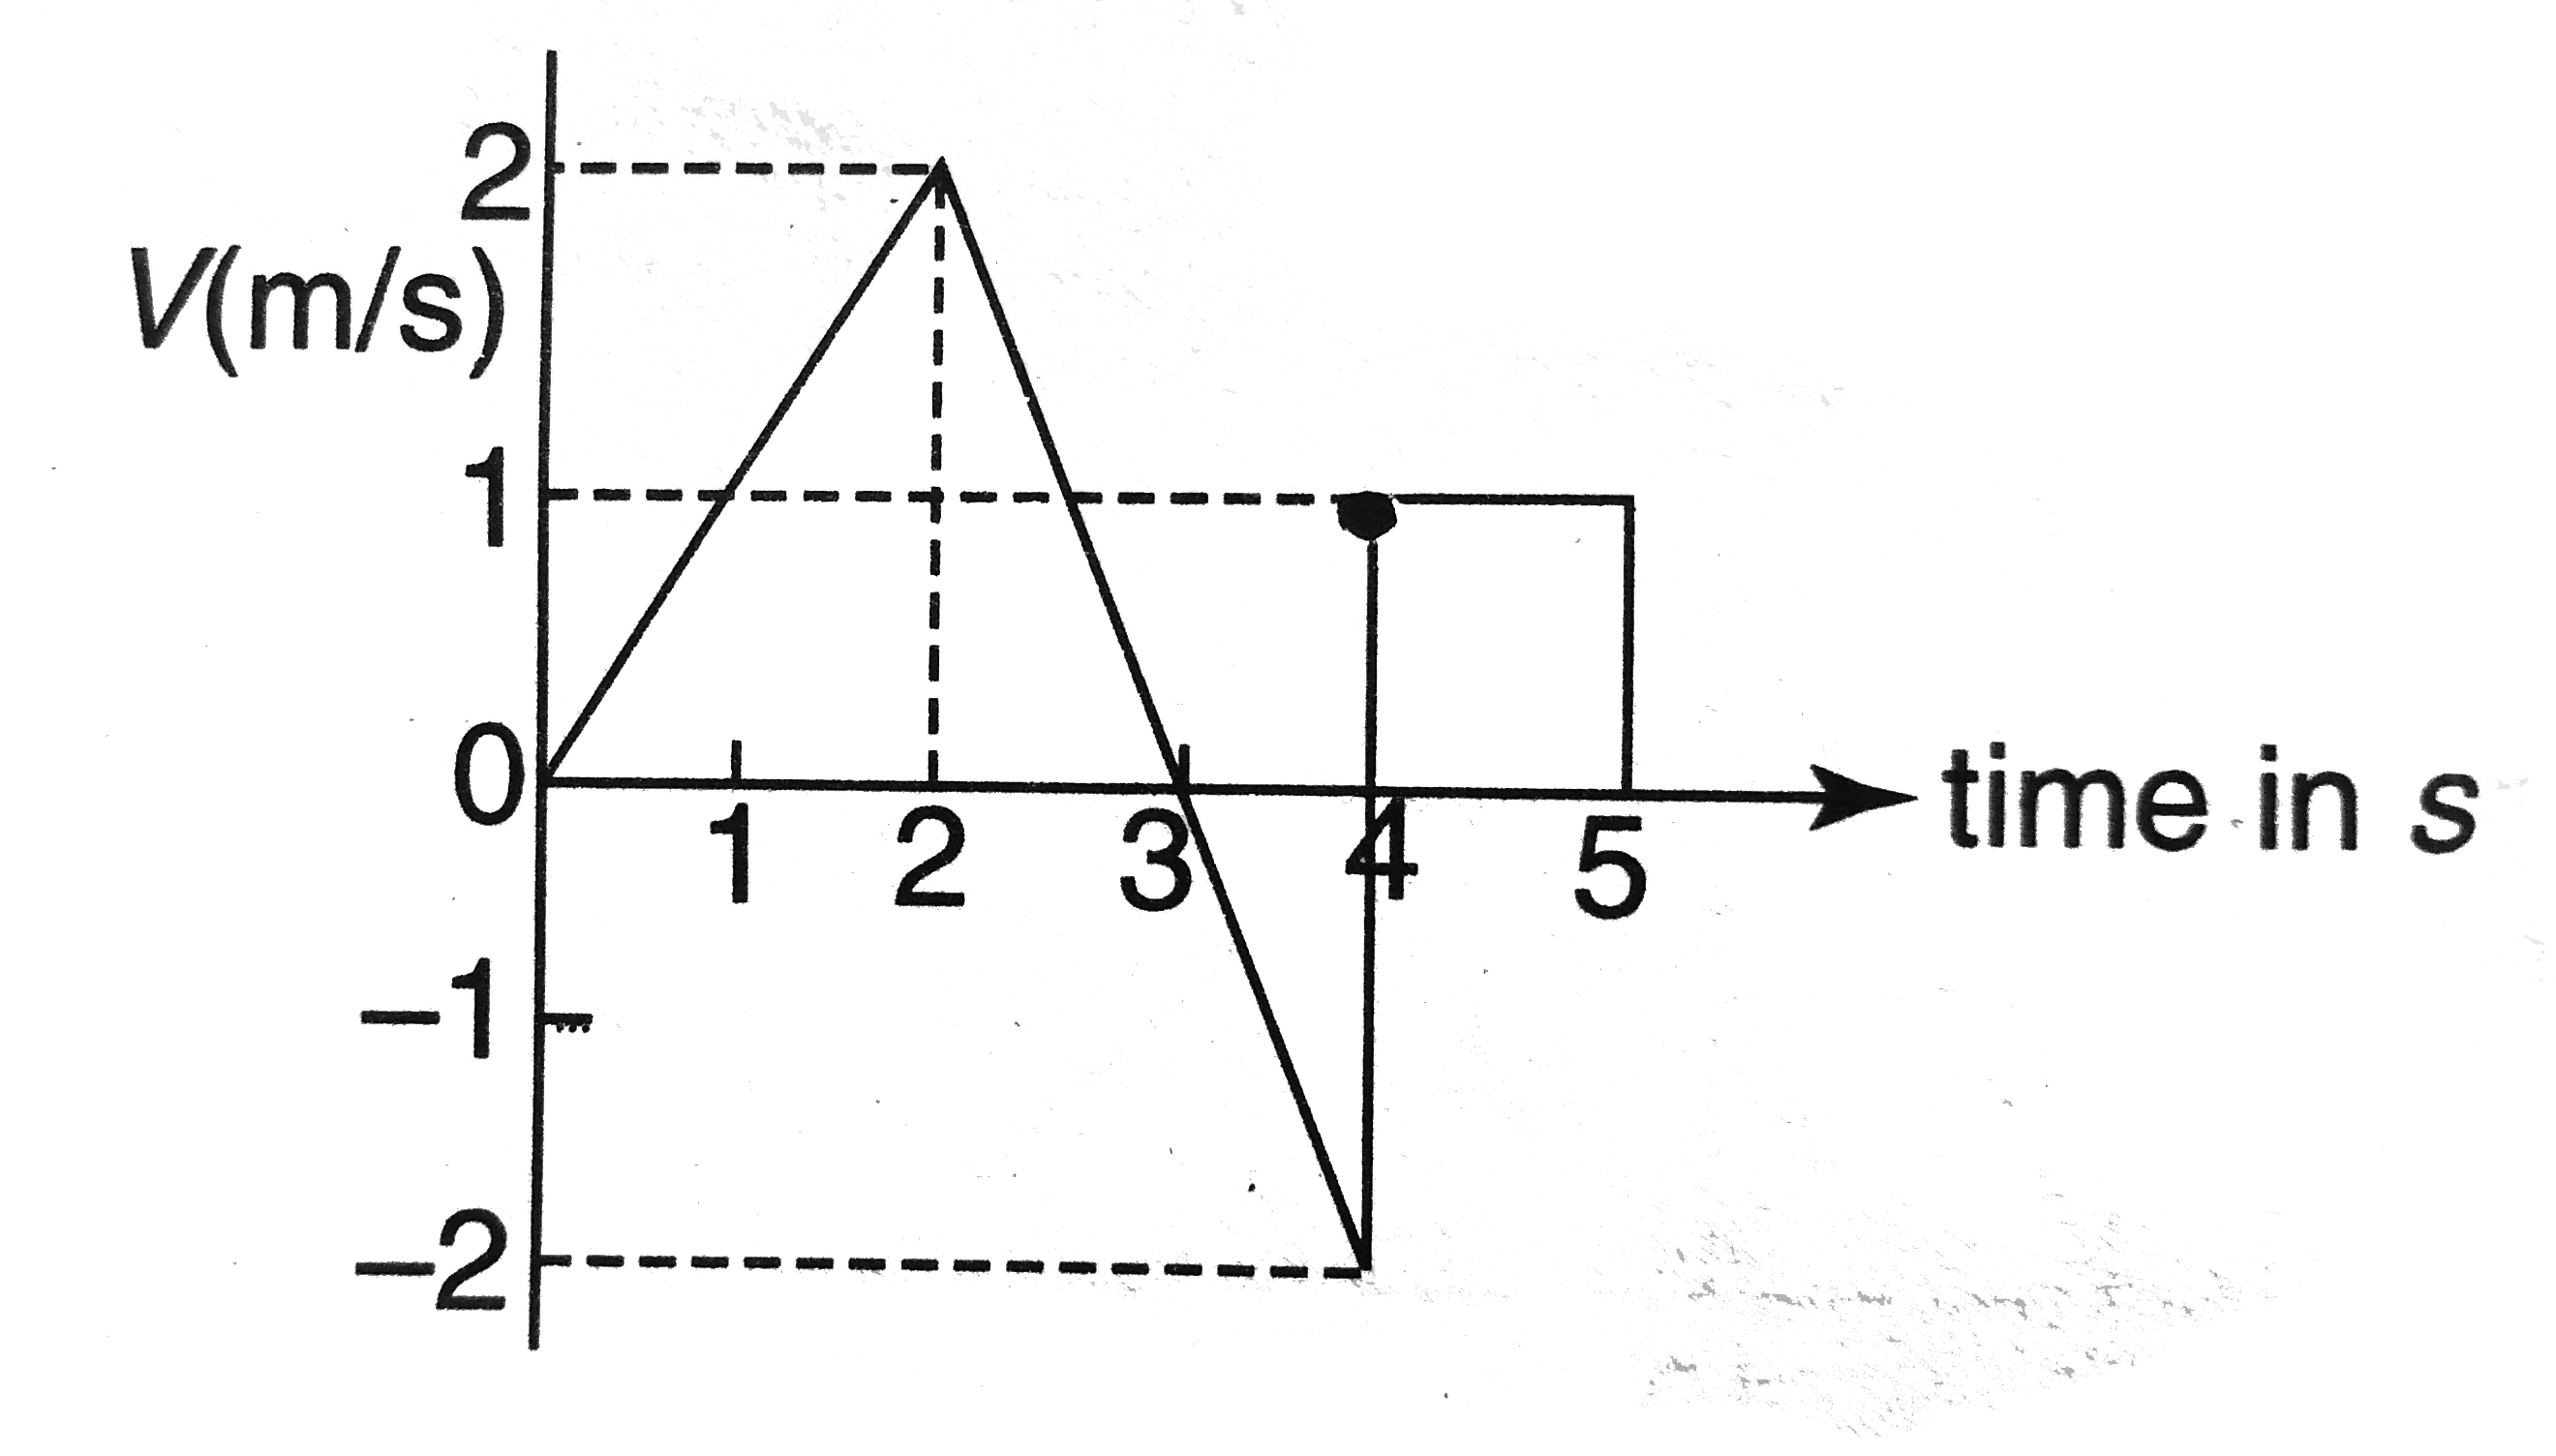
The velocity-time graph of a body moving along straight line is as follows :
The displacement of the body in 5 s is
 A5 mB2 mC4 mD3 m
 - Question 2 - Select One
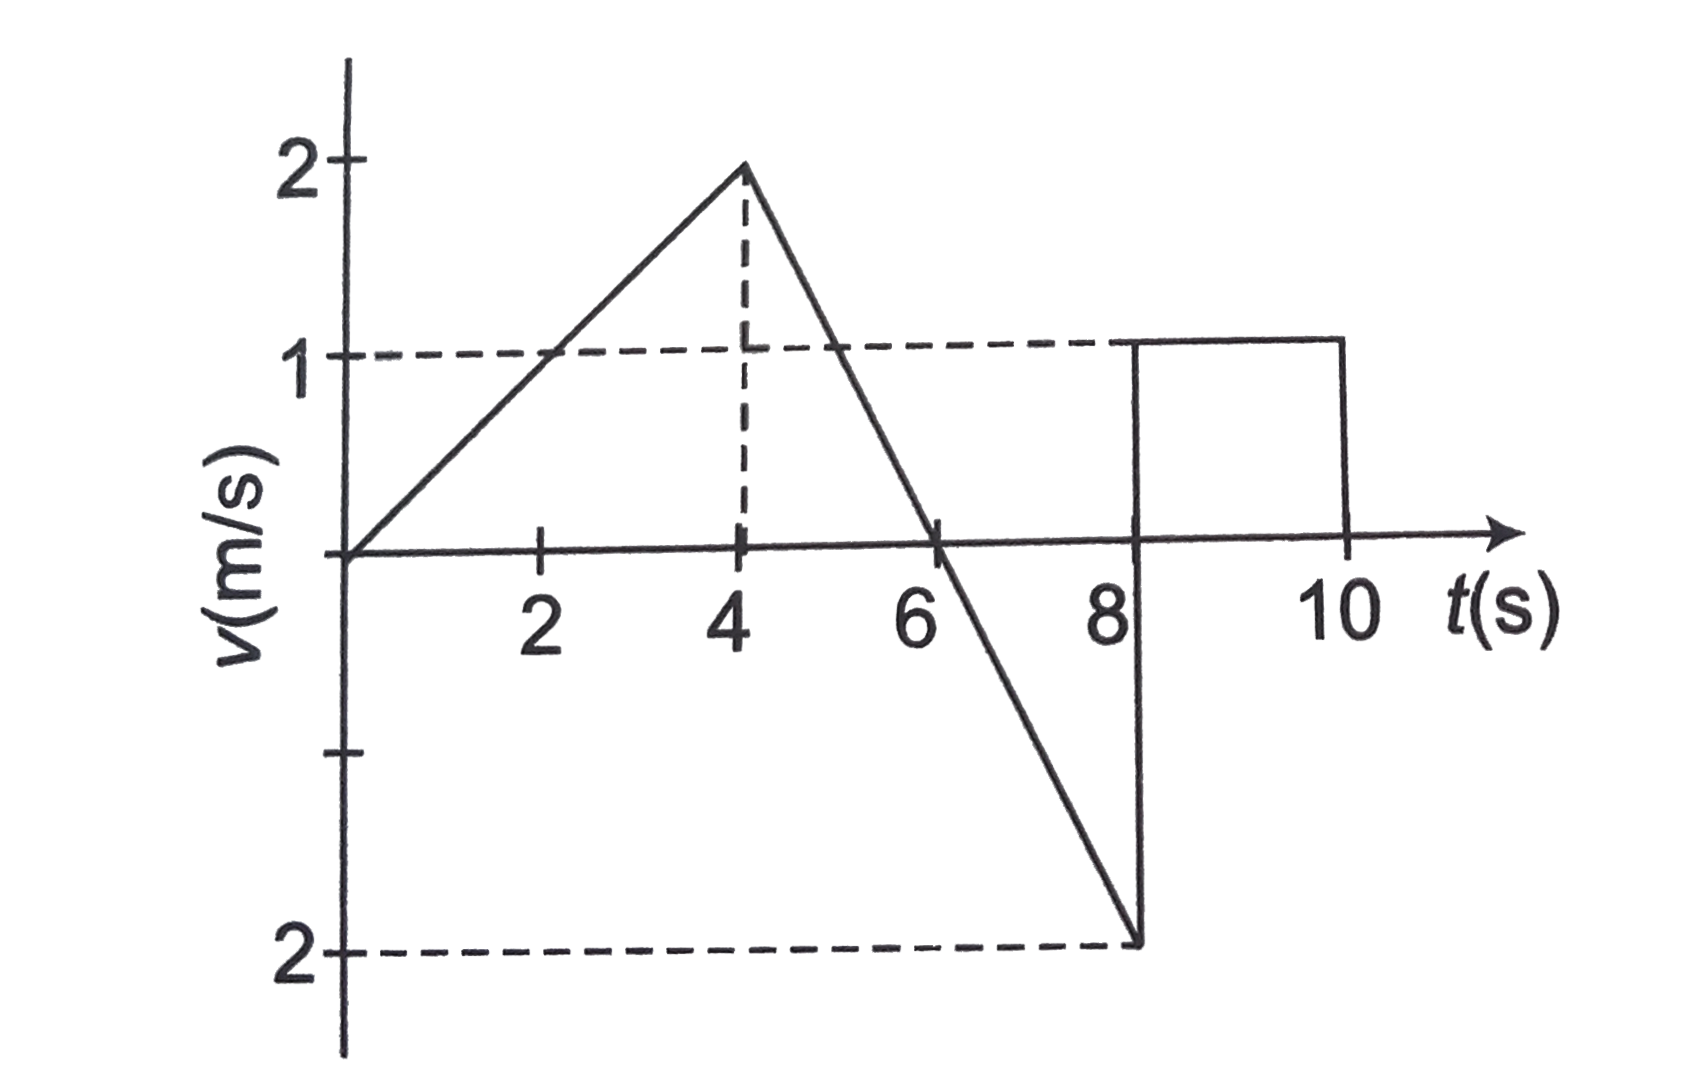
The velocity-time graph of a body moving in a straight line is given below. The displacement of the body in 10 s is
 A4 mB6 mC8 mD10 m
 - Question 3 - Select One
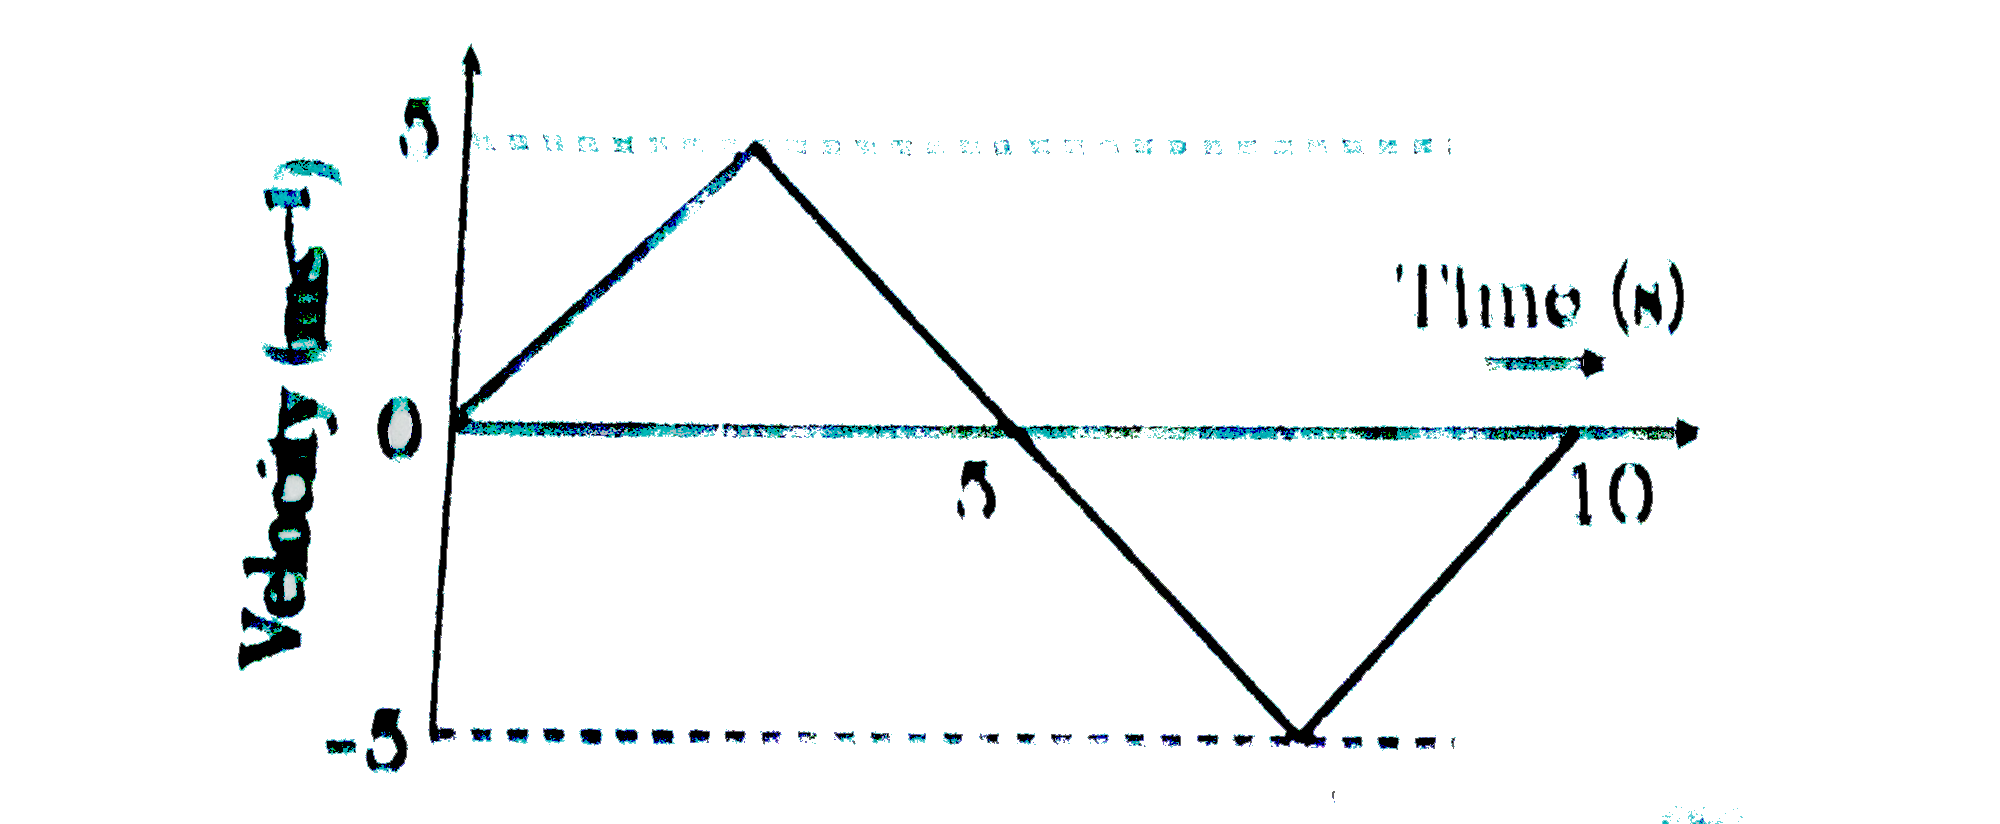
The v-t plot of a moving object ios shown in the figure. The average velocity of the object during the first 10 s is
 AzeroB2.5ms−1C5ms−1D2ms−1
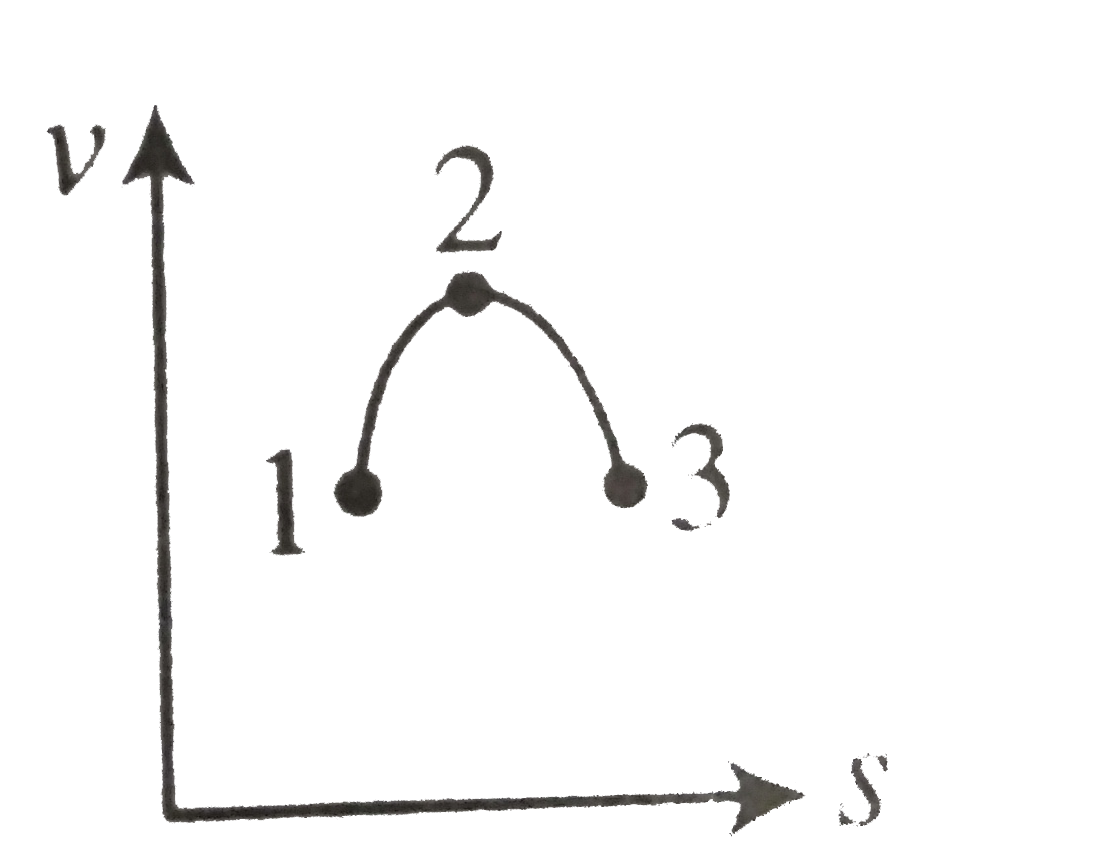
Figure shows the velocity-displacement curve for an object moving along a straight line. At which of the points marked is the object speeding up?
 View Solution
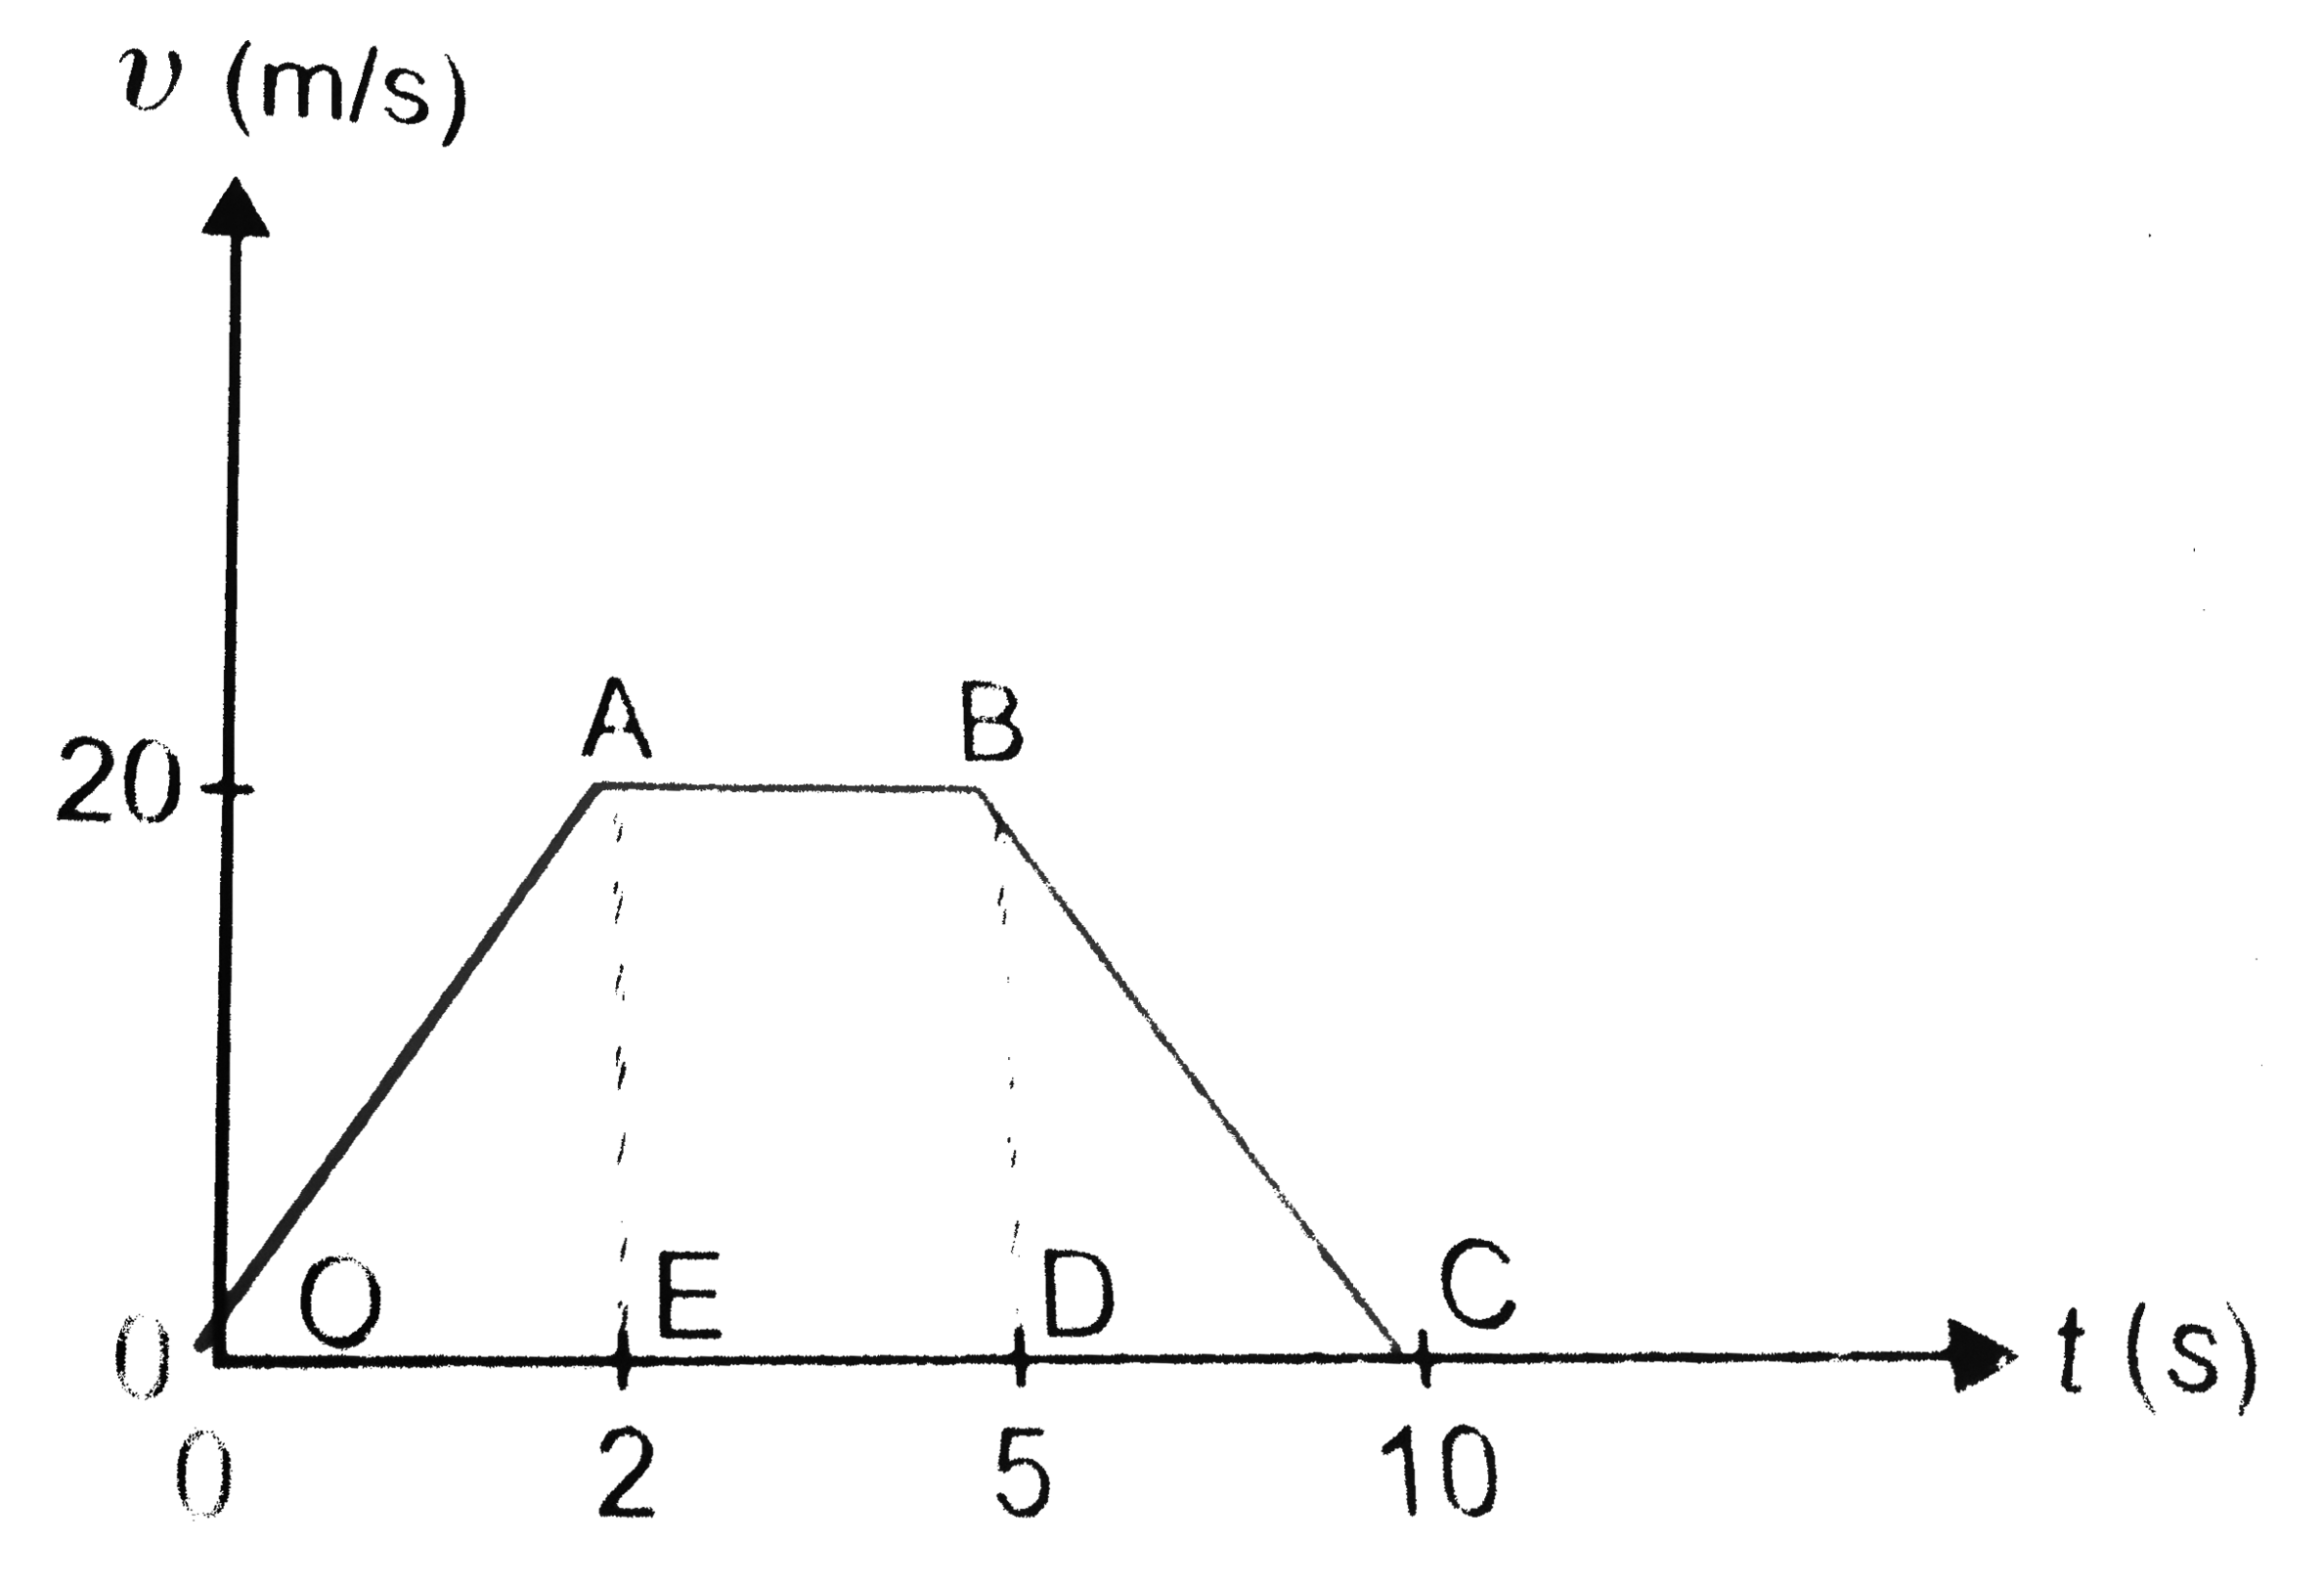
The velocity (u)-time (t) graph of an object moving along a straight line is as shown is Fig. 2 (b) . 30. Calculate the distance covered by object between (i)t=0→t=5s (ii) t=0→t=10s.
 .View Solution
The velocity (u)-time (t) graph of an object moving along a straight line is as shown is Fig. 2 (b) . 30. Calculate the distance covered by object between (i)t=0→t=5s (ii) t=0→t=10s.
 .View Solution
Figure shows the velocity-displacement curve for an object moving along a straight line. At which of the points marked is the object speeding up?
 View Solution
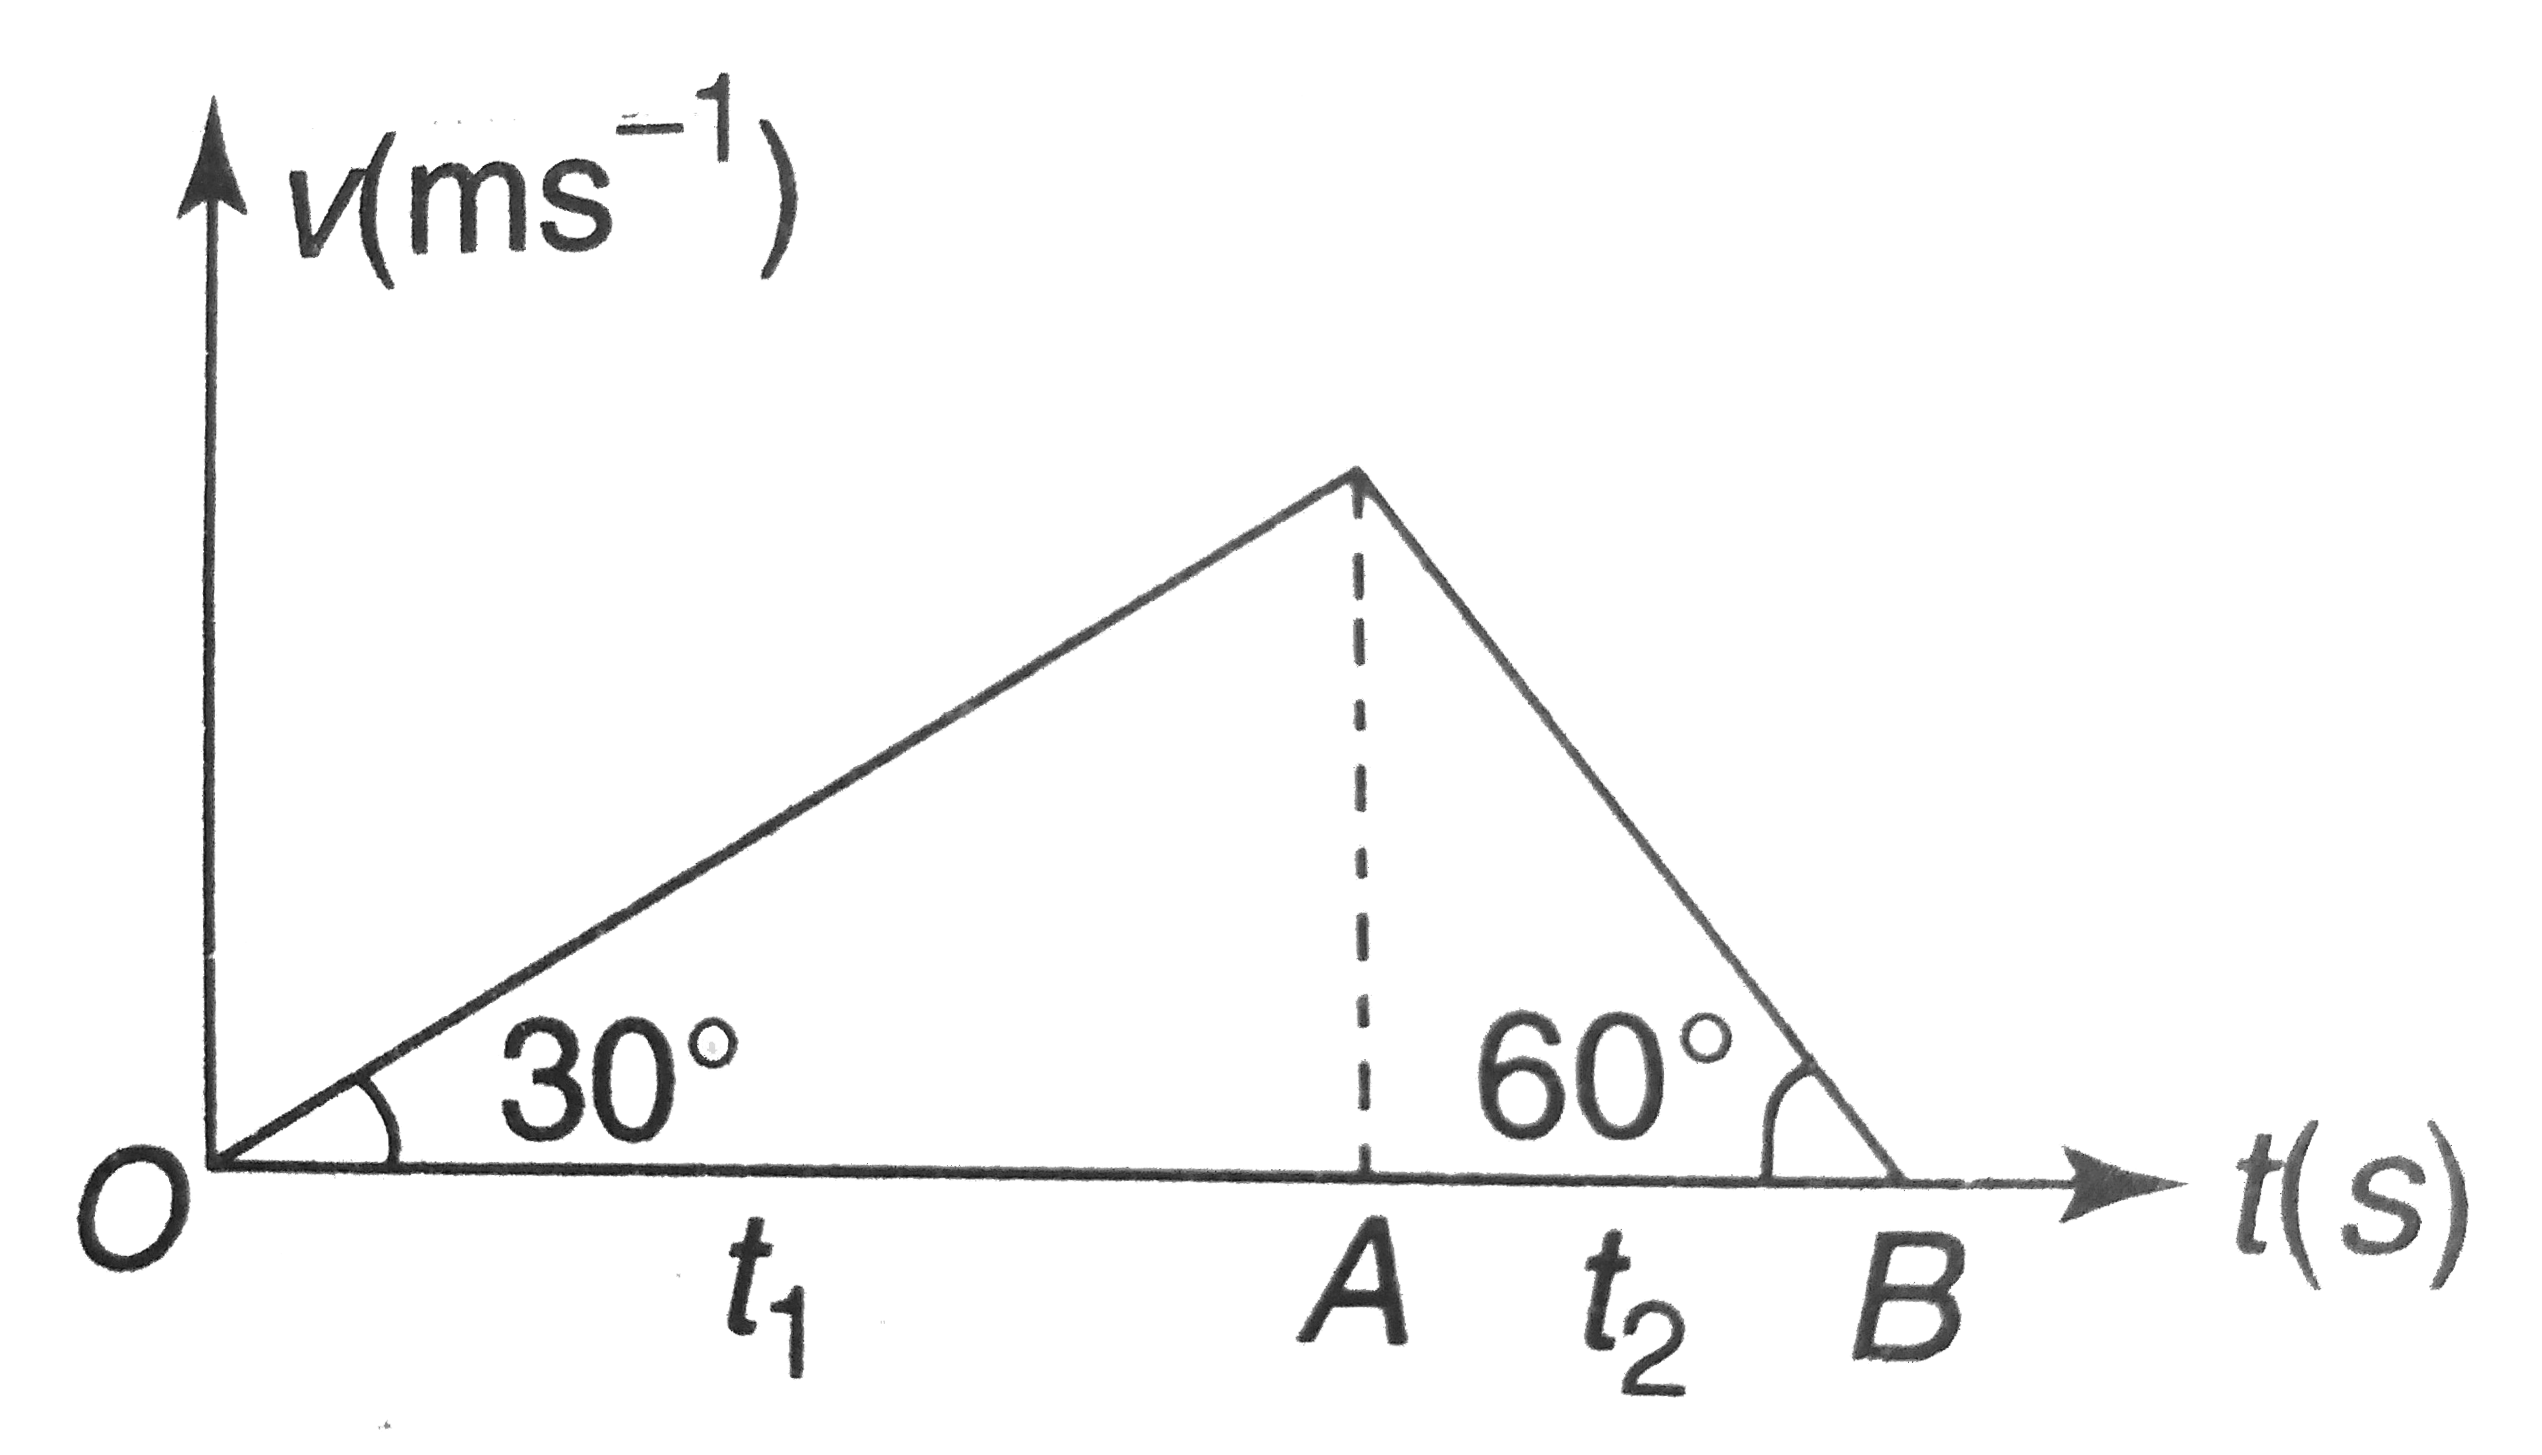
The velocity time graph of a body moving along a straight line is shown in figure. The ratio of the average velocities during the time t1 and t2 is.
 View Solution
