A car is moving on a straight road with uniform acceleration. The following table gives the speed of the car at various instant of time.

Draw the speed time graph choosing a convenient scale. Determine from it (i) the acceleration of the car (ii) the distance travelled by the car in 50 s.
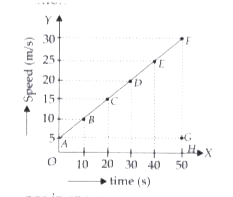
In the figure, we have taken time along OX and speed along OY. The speed-time graph is a straight line. Acceleration of the car

Taking first two points A and B on the graph,
Distance travelled by the car,
s=area enclosed between speed-time graph and time axis
=area of rectangle area of
m.
Topper's Solved these Questions
- BOOK - MTG IIT JEE FOUNDATIONCHAPTER - MOTIONEXERCISE - Exercise (Integer/Numerical Value Type)5videos
MOTION
- BOOK - MTG IIT JEE FOUNDATIONCHAPTER - MOTIONEXERCISE - Olympiad/HOTS Corner21videos
MOTION
- BOOK - MTG IIT JEE FOUNDATIONCHAPTER - MOTIONEXERCISE - Exercise (Short Answer Type)10videos
MOTION
- BOOK - MTG IIT JEE FOUNDATIONCHAPTER - GRAVITATION EXERCISE - Olympiad/HOTS Corner20videos
GRAVITATION
- BOOK - MTG IIT JEE FOUNDATIONCHAPTER - SOUNDEXERCISE - Olympiad/HOTS Corner15videos
SOUND
Similar Questions
A car is moving on a striaght road with uniform acceleration. The following table gives the speed of the car at various instants of time :
Speed(m/s) :51015202530Time(s) :01020304050
Draw the speed-time graph by choosing a convenient scale. Determine from it :
(i) the acceleration of the car.
(ii) the distance travelled by the car in 50 seconds.View SolutionA car is moving on a straight road with uniform acceleration. The speed of the car varies with time as follows :
Time(s) :0246810Speed(m/s) :4812162024
Draw the speed-time graph by choosing a convenient scale. From this graph :
(i) Calculate the acceleration of the car.
(ii) Calculate the distance travelled by the car in 10 seconds.
 View Solution
Knowledge Check
- Question 1 - Select One
A car is moving on a straight road covers one third of the distance with a speed of 20 km/h and the rest with a speed of 60 km/h. The average speed of the car is
A40 km/hB50 km/hC36 km/hD55 km/h - Question 2 - Select One
A car moving on a straight road accelerated from a speed of 4.1m/s to a speed of 6.9m/s in 5.0 s. Then its average acceleration is
A0.5m/s2B0.6m/s2C0.56m/s2D0.65m/s2
A car is moving on a straight road covers one third of the distance with a speed of 30 km/h and the rest with a speed of 50 km/h. The average speed of the car is
View SolutionA car is moving on a straight road covers one third of the distance with a speed of 20 km/h and the rest with a speed of 60 km/h. The average speed of the car is
View SolutionFollowing table gives the displacement of a car at different instants of time. (a) Draw the displacement-time sketch and find the average velocity of car.
(b) What will be the displacement of car at (i) 2.5 s and (ii) 4.5 s?

View SolutionA car accelerates uniformly from 18km/h to 36km/h in 5 second. Calculate (i) the acceleration and (ii) the distance covered by the car in that time .
View SolutionA car accelerates uniformly from 18km/h to 36km/h in 5 second. Calculate (i) the acceleration and (ii) the distance covered by the car in that time .
View SolutionA car moving on a straight road accelerates from a speed of 4.1 m/s to a speed of 6.9 m/s in 5.0 s. What was its average acceleration?
View Solution

