What is the value of Ea For the given below Graph (In KJ)?
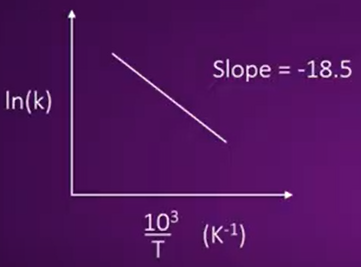
190.6
253.55
153.8
89.5
Step by step video solution for What is the value of E_a For the given below Graph (In KJ)? by Chemistry experts to help you in doubts & scoring excellent marks in Class 12 exams.
Updated on:21/07/2023Topper's Solved these Questions
Similar Questions
Knowledge Check
The equation of the graph given below is
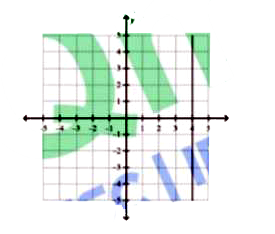 AY=4BX=4CX=−4DY=0
For a substance with the value of ΔHvap and ΔSvap given below, what is its normal boiling point in .∘C(ΔHvap=59.0kJmol−1,ΔSvap=93.65Jmol−1)
A357B630C1314D1587Study the following graph carefully and answer the questions given below –
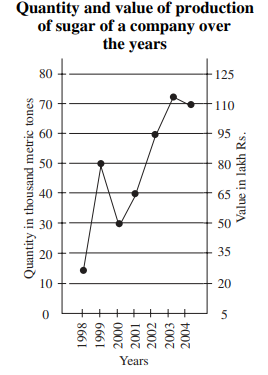
In which of the following years was the value of sugar per metric ton the lowest among the given years?A1998B1999C2001D2003
Read the bar graph given below and answer the following questions.
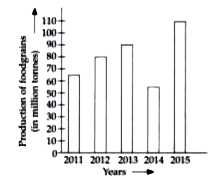
What is the ratio of the production of foodgrains in 2011 to that in 2014?
View SolutionStudy the following bar graph and answer the questions given below.
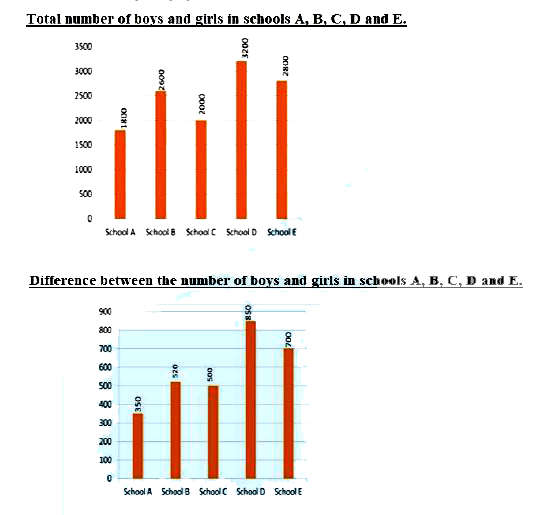
What is the ratio of numbers of boys to the number of girls in school E?
View SolutionStudy the following graph carefully and answer the question given below-----
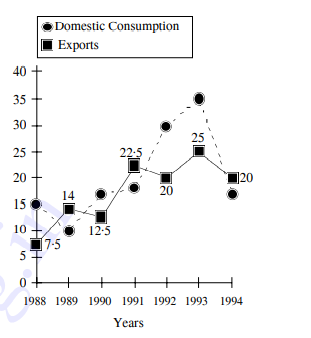
In which of the following years was the value of sugar per metric ton the lowest among the given years ?
View SolutionFew values of enthalpies are given below: O=−141KJmol−1
F=−328KJmol−1
S=−200KJmol−1
Cl=−349KJmol−1 What do these values show?
View SolutionFind out the value of (P) in the following cycle:
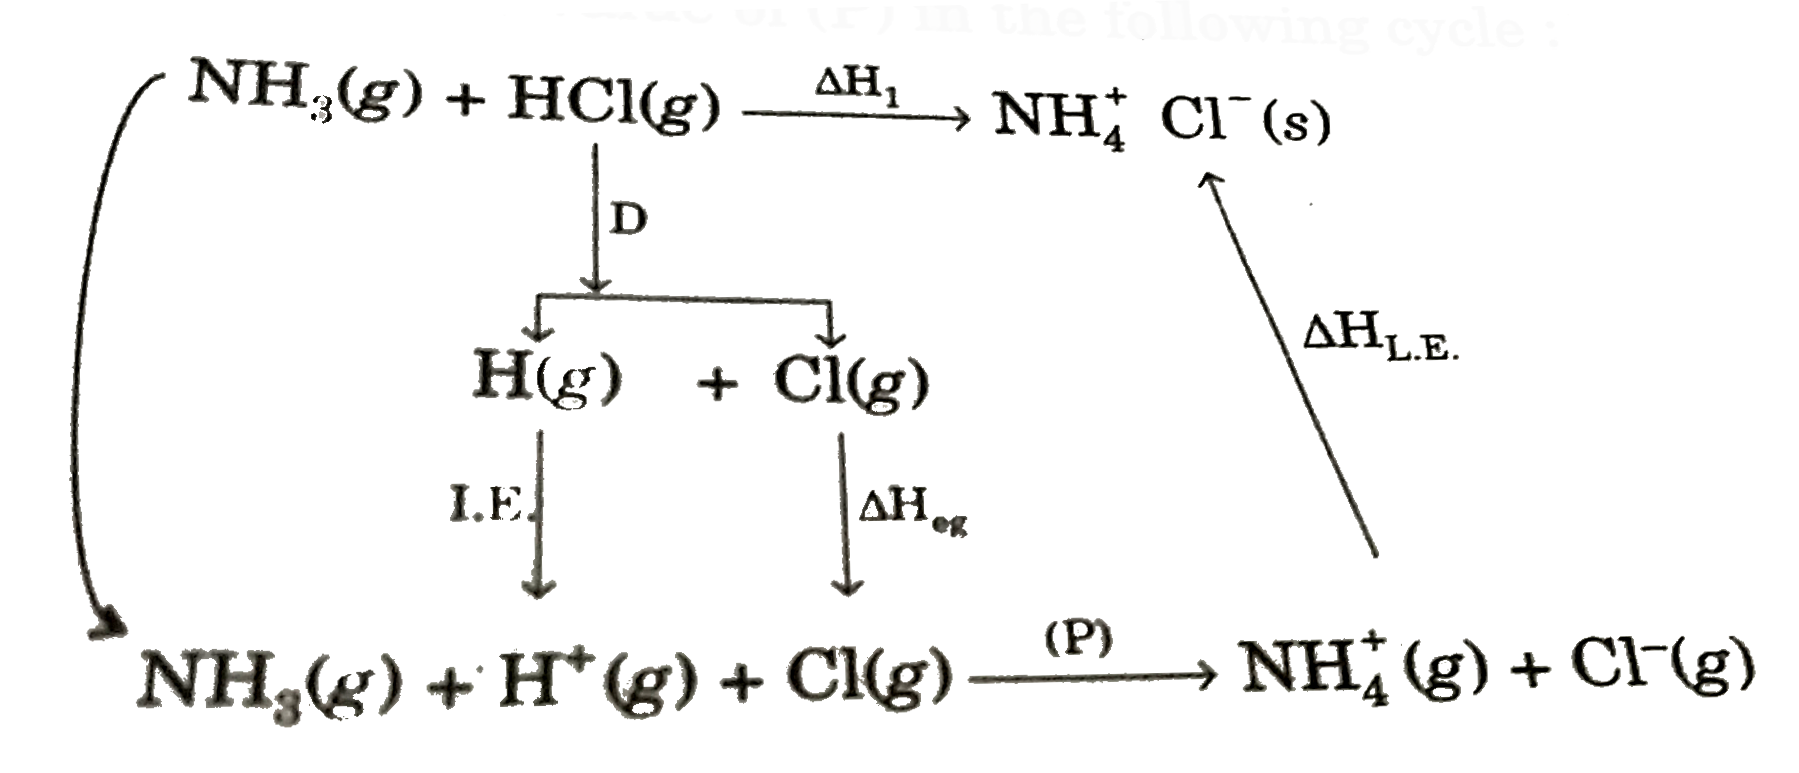
Given ΔH1=−400kJ,I.E.=+50kJ,D=+50kJ,ΔHeg=−30kJ lattice energy −−100kJ
View Solution

