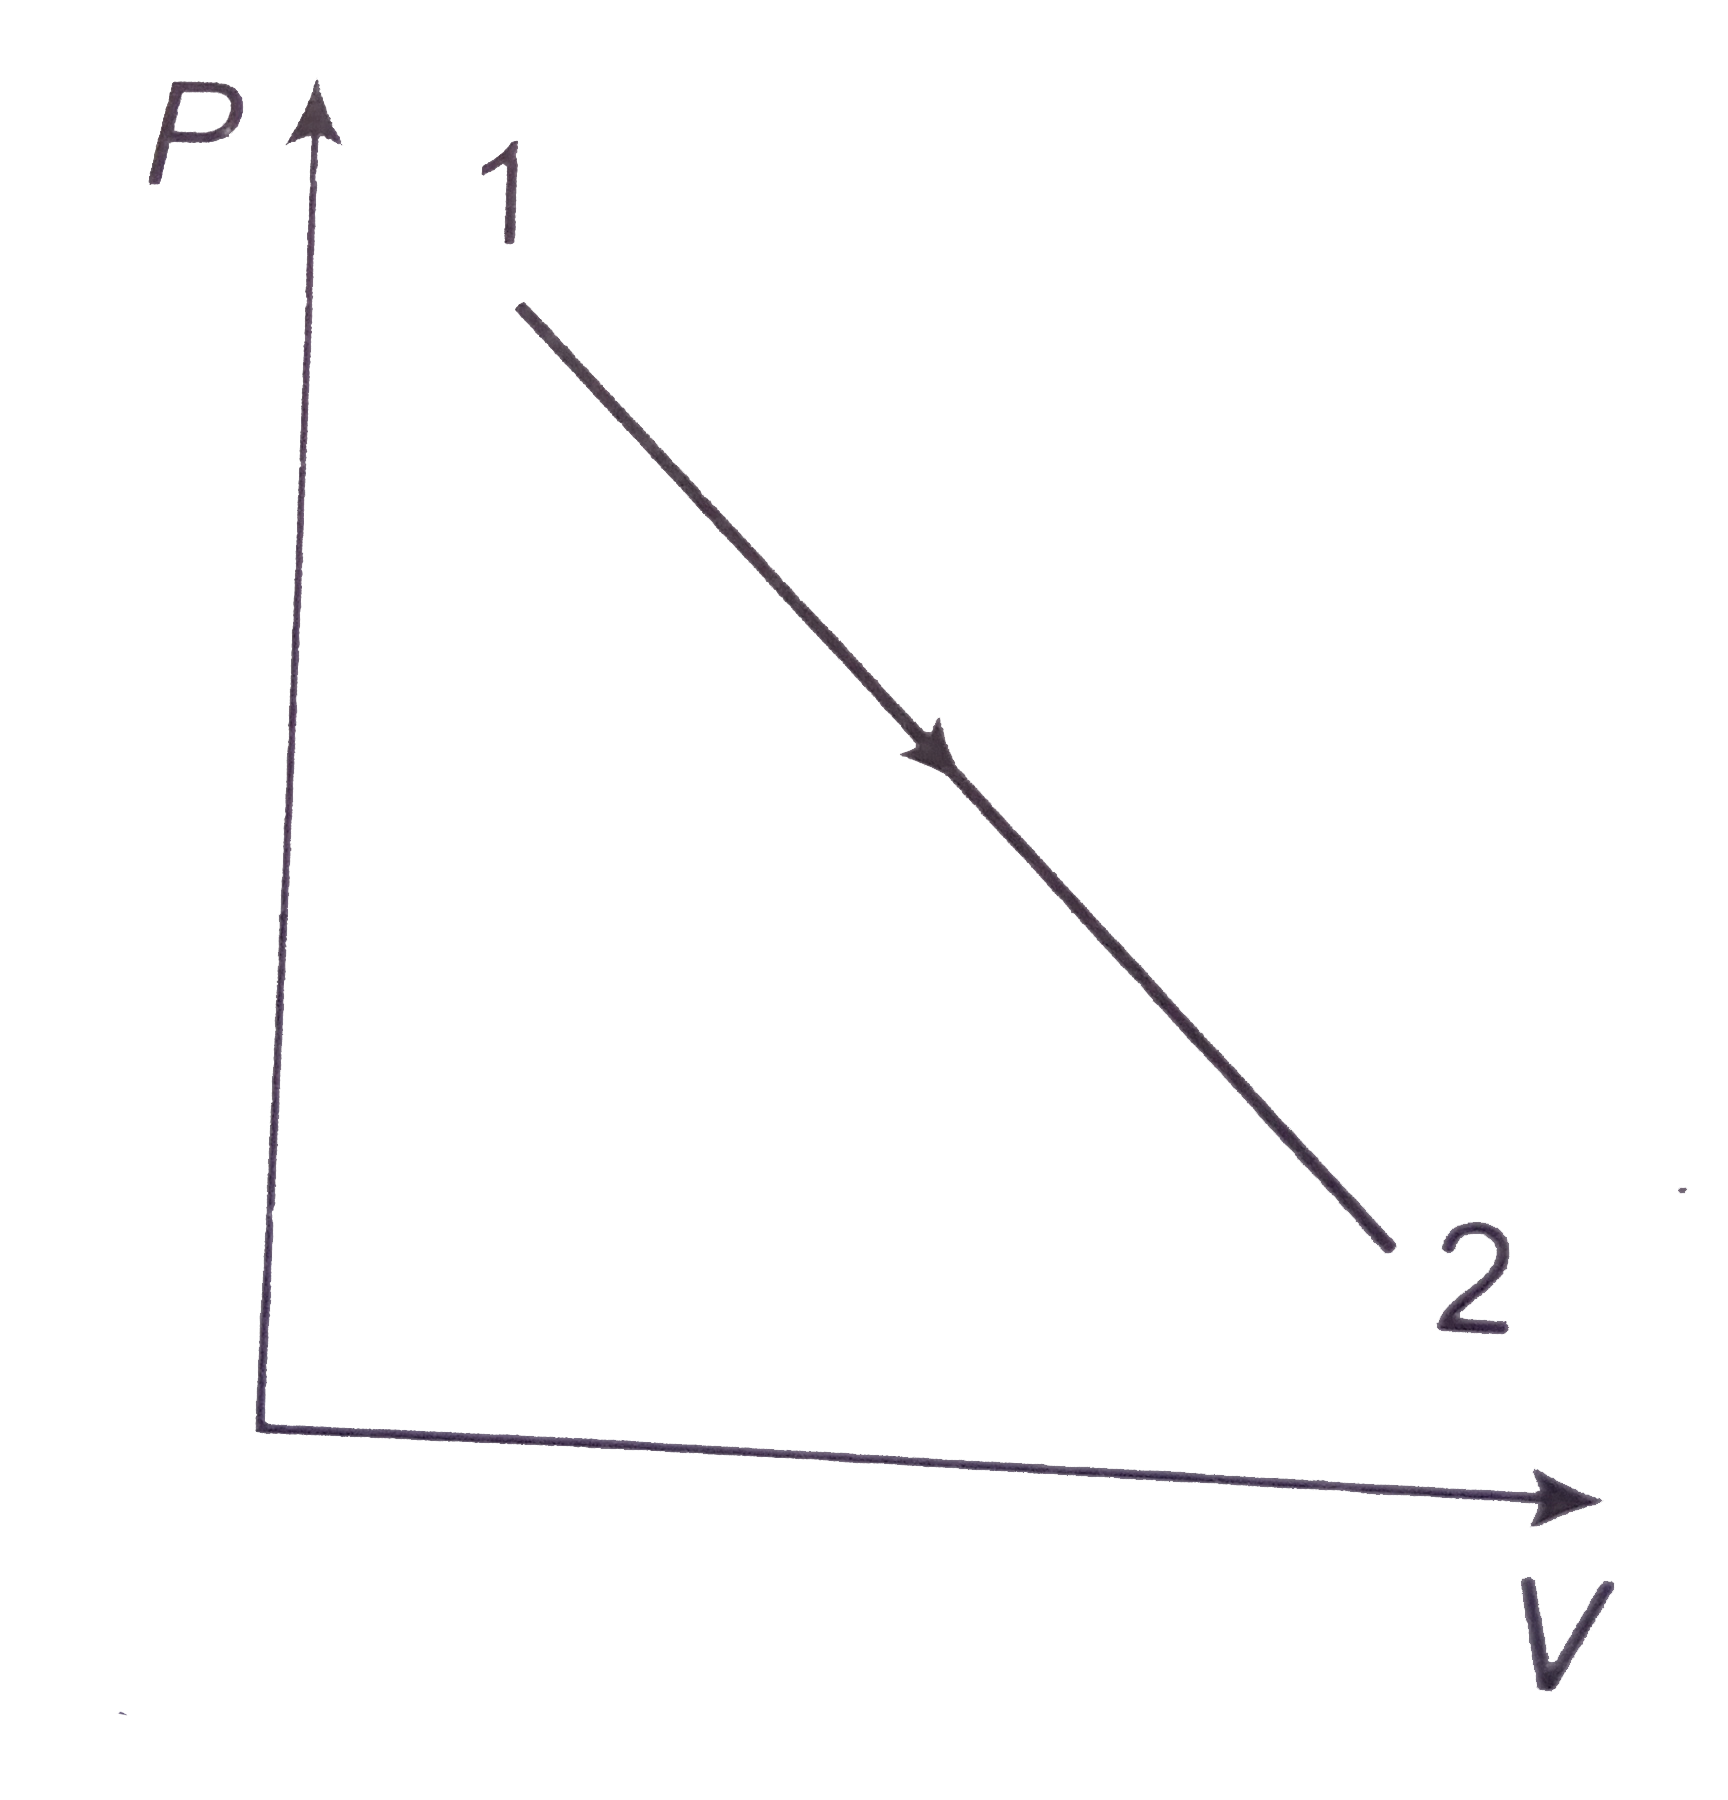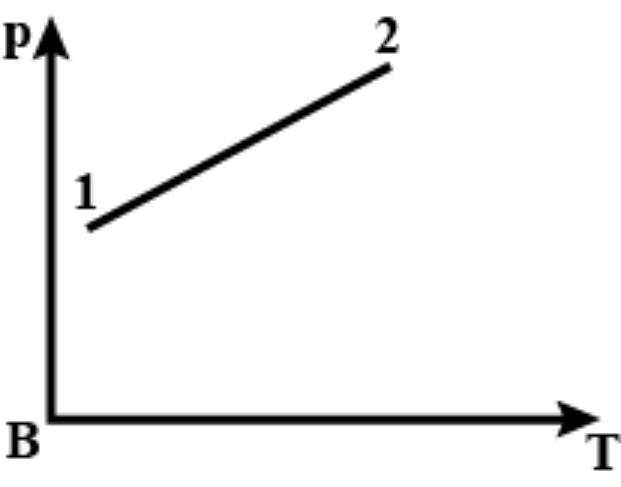
P−V graph was obtained from state 1 to state 2 when a given mass of a gas is subjected to temperature changes during the process the gas is
Heated continuously
Cooled continuously
Heated in the beginning and cooled towards the end
Cooled in the beginning and heated towards the end
The correct Answer is:C
T2>T1
T1→ temperature at 1 and 2
T2→ temperature at mid point
The gas is 1st heated and then cooled towards end.

Similar Questions
The volume (V) of a monoatomic gas varies with its temperature (T), as shown in the graph. The ratio of work done by the gas, to the heat absorbed by it, when it undergoes a change from state A to state B, is ____

View SolutionThe volume (V) of a moatomic gas varies with its temperature (T), as shown in the graph. The ratio of work done by the gas, to the heat absorbed by it, when it undergoes a change from state A to state B, is
View Solutionएक आदर्श गैस का ताप 300 K है, जब गैस का आयतन V से 2 V कर दिया जाता है। (प्रक्रम p=αV के अनुदिश) तब गैस के ताप में परिवर्तन होगा
View SolutionA volume V and temperature Twas obtained, as shown in diagram, when a given mass of gas was heated. During the heating process the pressure is
View SolutionA P-V diagram is obtained by changing the temperature of the gas as shown. During this process the gas is
View Solutionआयतन V परमतापा T के बीच ग्राफ प्राप्त किया गया जब दिए गए द्रव्यमान की गैस गर्म की गई। गर्म करने के दौरान अवस्था 1 से अवस्था 2 पर दाब

View SolutionThe equation of a state of a gas is given by p(V−b)=nRT. If 1 mole of a gas is isothermally expanded from volume V and 2V, the work done during the process is
View SolutionThe volume (V) of a monatomic gas varies with its temperature (T) as shown in the graph. The ratio of work done by the gas, to the heat absorbed by it, when it undergoes a change from state A to state B ,is
View Solution
