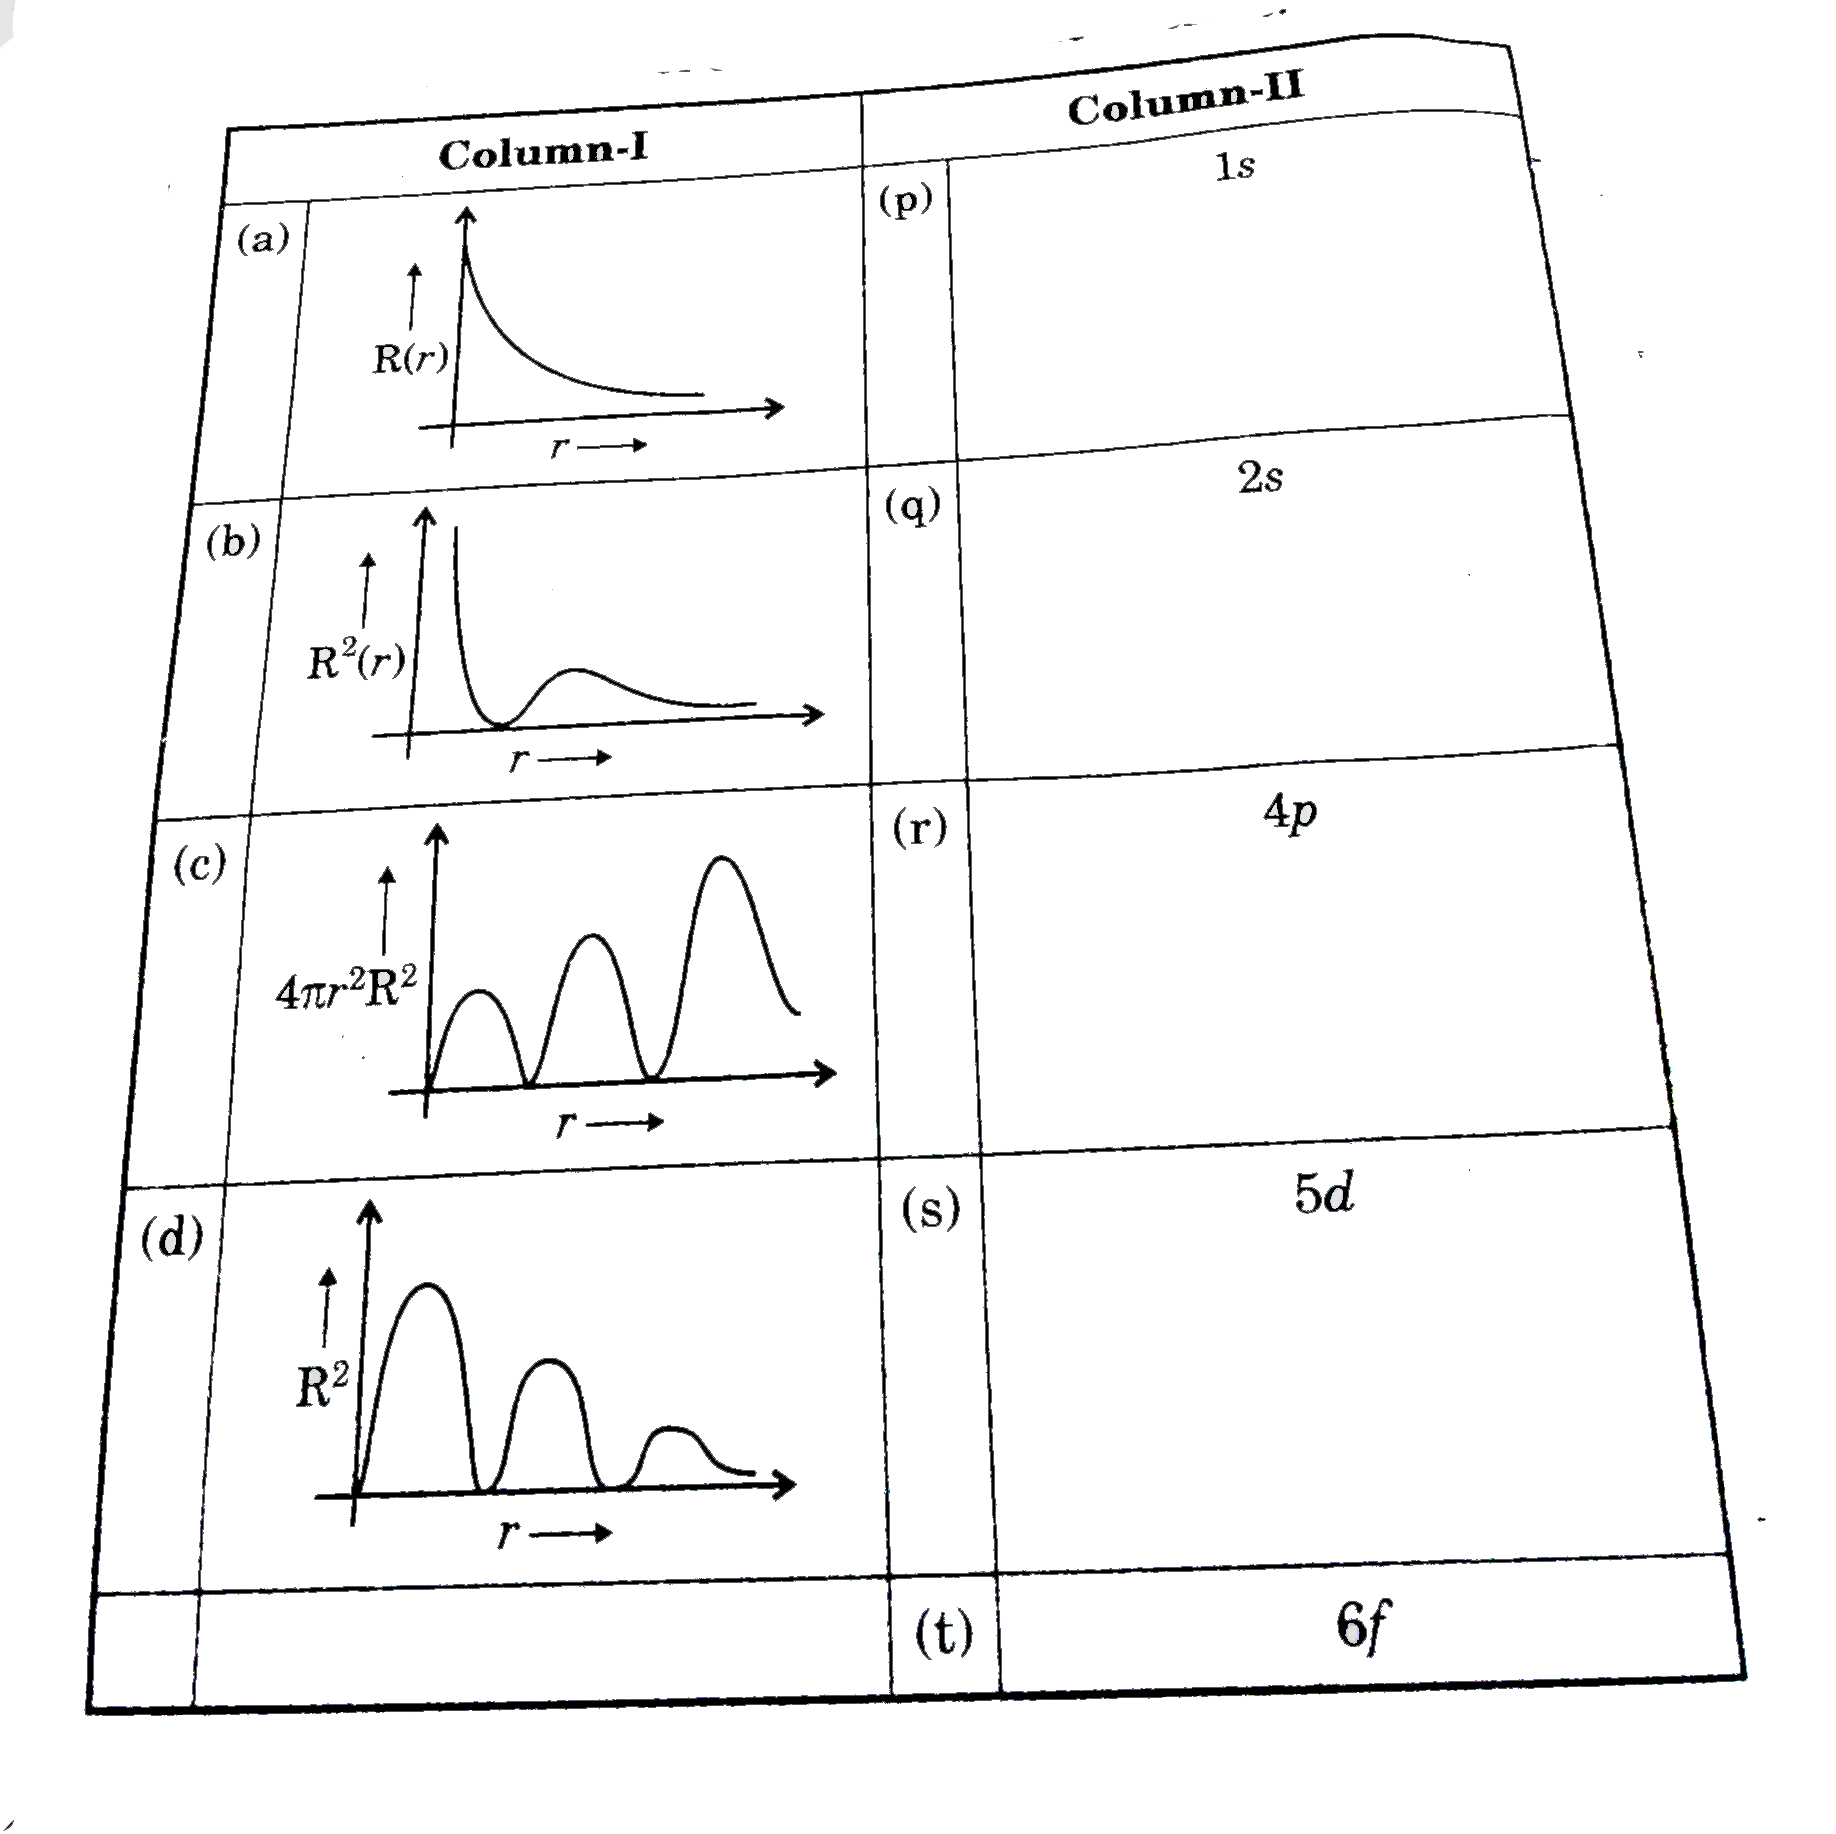
Which of the following is the correct plot for the probability density Ψ2(r) as a function of distance 'r' of the electron from the nucleus for 2s orbital ?
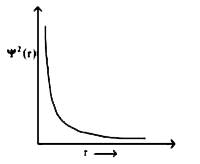
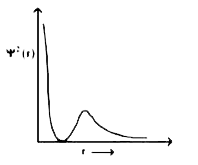
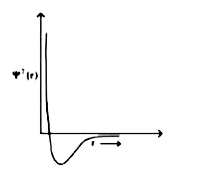
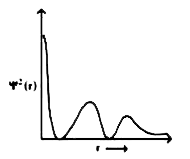
To determine the correct plot for the probability density Ψ2(r) as a function of distance r from the nucleus for the 2s orbital, we need to analyze the characteristics of the 2s orbital.
1. Understand the 2s Orbital:
- The 2s orbital is a spherical orbital with a principal quantum number n=2 and an angular momentum quantum number l=0.
- It has one radial node. The number of radial nodes is given by the formula n−l−1. For 2s, n=2 and l=0, so the number of radial nodes is 2−0−1=1.
2. Probability Density Function:
- The probability density Ψ2(r) represents the likelihood of finding an electron at a distance r from the nucleus.
- For the 2s orbital, the probability density will have a specific behavior due to the presence of the radial node.
3. Behavior of the Probability Density:
- At r=0, the probability density is non-zero and increases as r increases until it reaches a maximum.
- After reaching the maximum, the probability density decreases to zero at the radial node (which occurs at a certain distance from the nucleus).
- Beyond the radial node, the probability density increases again as r increases, reflecting the spherical nature of the orbital.
4. Sketching the Graph:
- The graph of Ψ2(r) will start from a positive value at r=0, rise to a peak, drop to zero at the radial node, and then rise again as r increases.
- The plot will be symmetric about the nucleus and will have a characteristic "two-lobe" shape due to the presence of the radial node.
5. Identifying the Correct Plot:
- Among the given options, look for a plot that shows the described behavior: starting from a positive value, peaking, dropping to zero, and then rising again.
Final Answer:
The correct plot for the probability density Ψ2(r) of the 2s orbital will exhibit the characteristics described above.
- The 2s orbital is a spherical orbital with a principal quantum number n=2 and an angular momentum quantum number l=0.
- It has one radial node. The number of radial nodes is given by the formula n−l−1. For 2s, n=2 and l=0, so the number of radial nodes is 2−0−1=1.
- The probability density Ψ2(r) represents the likelihood of finding an electron at a distance r from the nucleus.
- For the 2s orbital, the probability density will have a specific behavior due to the presence of the radial node.
- At r=0, the probability density is non-zero and increases as r increases until it reaches a maximum.
- After reaching the maximum, the probability density decreases to zero at the radial node (which occurs at a certain distance from the nucleus).
- Beyond the radial node, the probability density increases again as r increases, reflecting the spherical nature of the orbital.
- The graph of Ψ2(r) will start from a positive value at r=0, rise to a peak, drop to zero at the radial node, and then rise again as r increases.
- The plot will be symmetric about the nucleus and will have a characteristic "two-lobe" shape due to the presence of the radial node.
- Among the given options, look for a plot that shows the described behavior: starting from a positive value, peaking, dropping to zero, and then rising again.
The correct plot for the probability density Ψ2(r) of the 2s orbital will exhibit the characteristics described above.
Topper's Solved these Questions
- JEE MAINS 2022BOOK - JEE MAINS PREVIOUS YEARCHAPTER - JEE MAINS 2022EXERCISE - Chemistry Section B
10 Videos
- JEE MAINS 2022BOOK - JEE MAINS PREVIOUS YEARCHAPTER - JEE MAINS 2022EXERCISE - CHEMISTRY
60 Videos
- JEE MAINS 2022BOOK - JEE MAINS PREVIOUS YEARCHAPTER - JEE MAINS 2022EXERCISE - CHEMISTRY (SECTION B)
10 Videos
- JEE MAINS 2021BOOK - JEE MAINS PREVIOUS YEARCHAPTER - JEE MAINS 2021EXERCISE - Chemistry (Section B )
10 Videos
- JEE MAINS 2023 JAN ACTUAL PAPERBOOK - JEE MAINS PREVIOUS YEARCHAPTER - JEE MAINS 2023 JAN ACTUAL PAPEREXERCISE - Question
360 Videos
Similar Questions
Knowledge Check
Which of the following is correct graph between Probability density sπ2(r) vs radial distance of electron (r) form nucleus for 3 s ?
A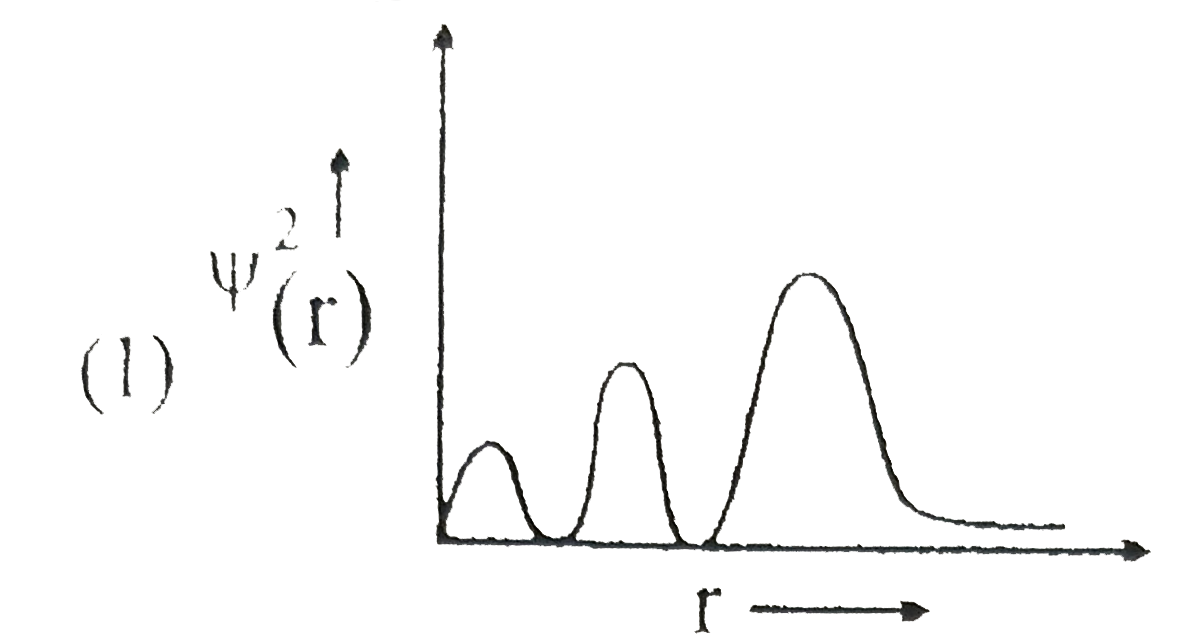 B
B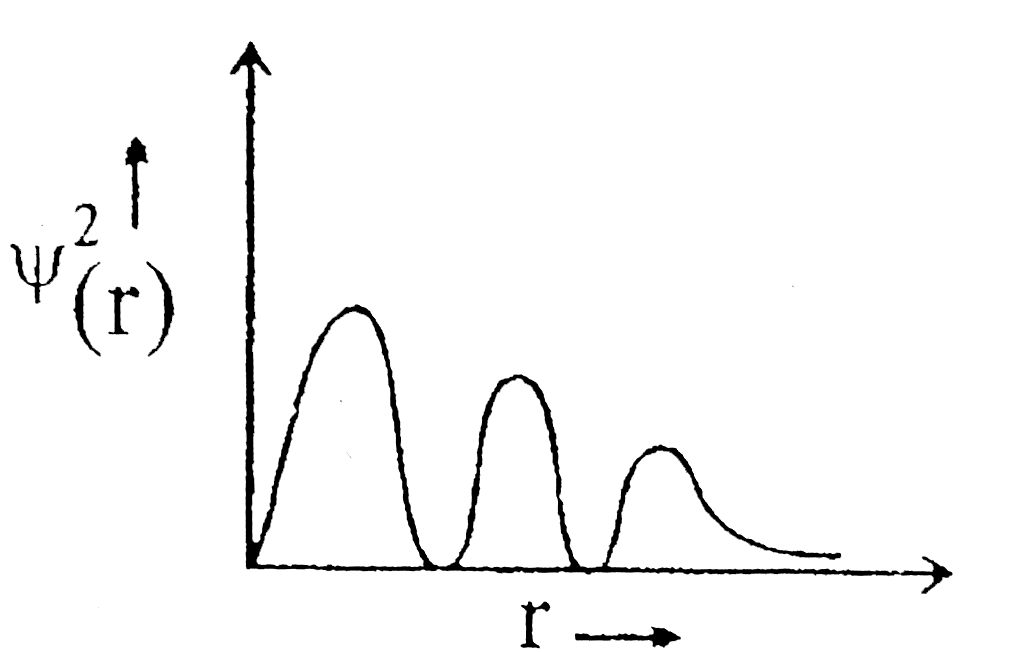 C
C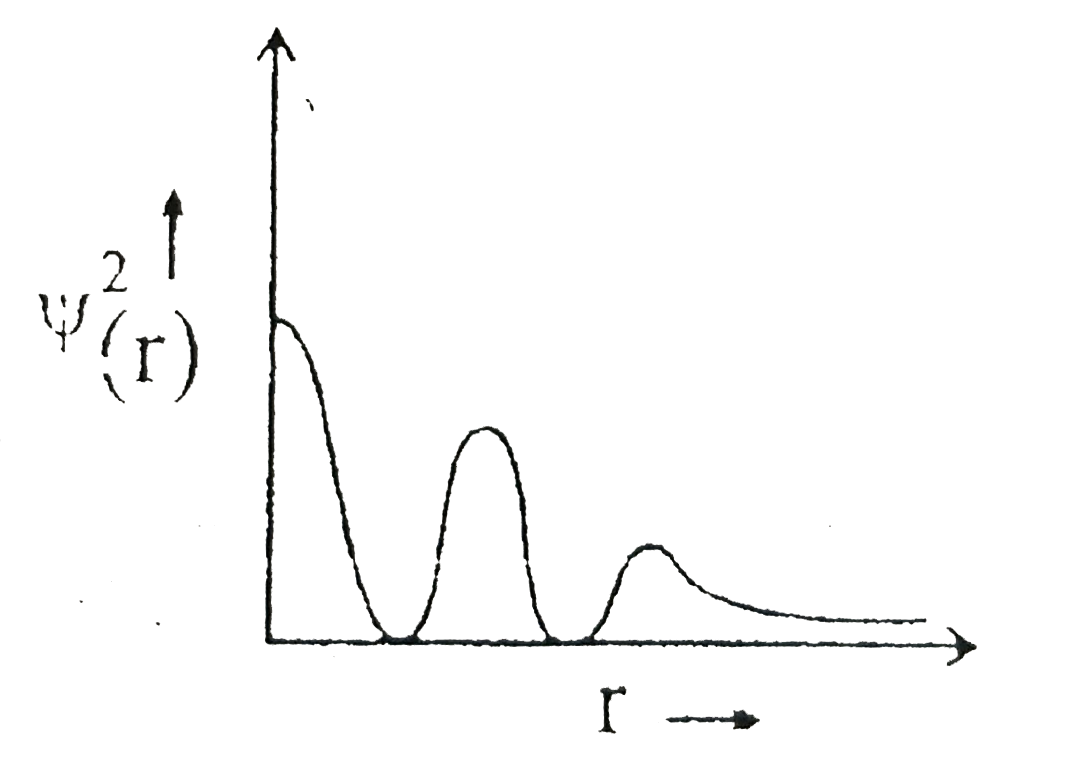 D
D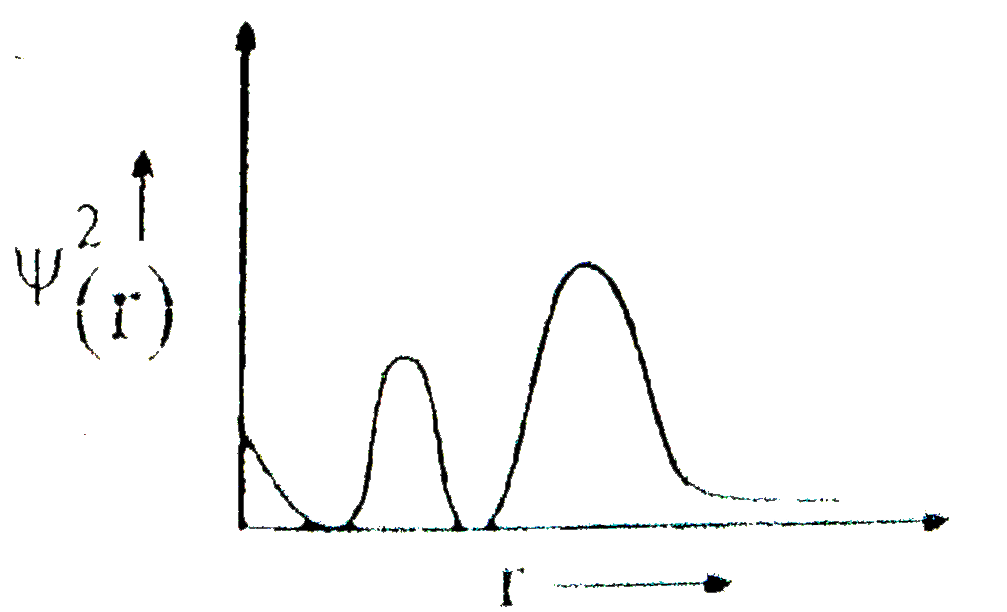
Which of the following plots of radial - probability function 4π2ψ2 is /are correct
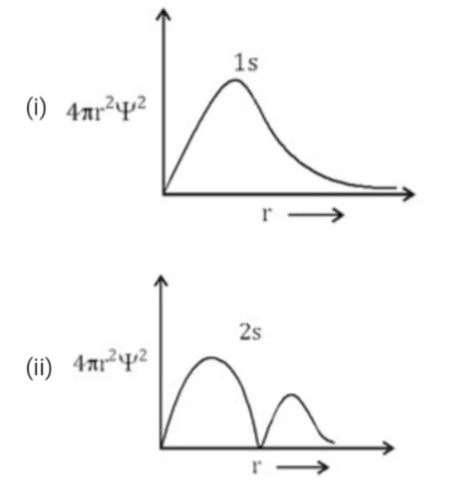
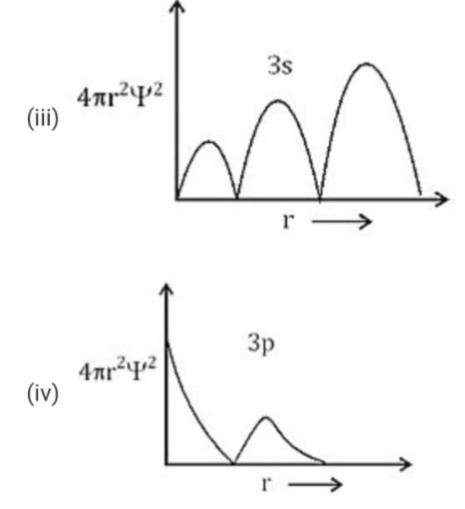 AOnly iBii and iiiCI and iiiDall
For which of the following orbitals is the radial probaility density R2 the maximum at the nucleus and descrease sharply as the distance form the nucleus increases?
A1sB2sC3sDAll the s orbitals
The correct statement about probability density (except at infinite distance from nucleus ) is :
View SolutionOut of the following, which is the correct match for the radial probability of finding the electron for 2s orbital
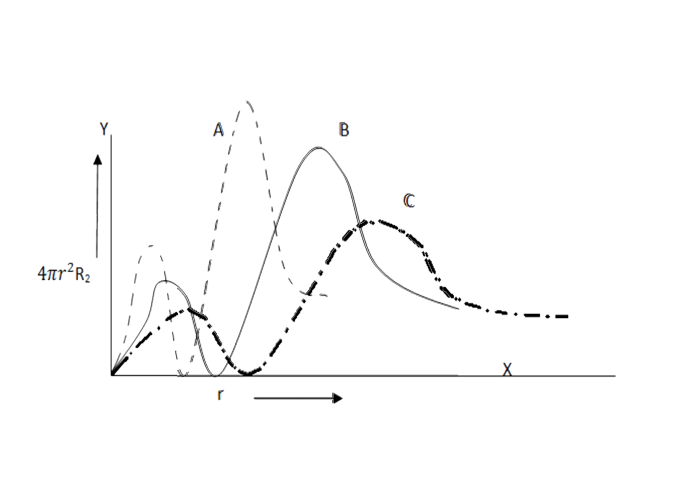
View SolutionWhich of the following statement concerning concerning probability density (Ψ2) and radial distribution function (4πr2Ψ) for a s - orbit of H - like species is correct ?
View SolutionWhich of the following plots of radical probability function 4πr2Ψ2r is incorrectly labelled ?
View SolutionSelect the correct plot of radial probability function (4πr2R2) for 2s - orbital.
View Solution

