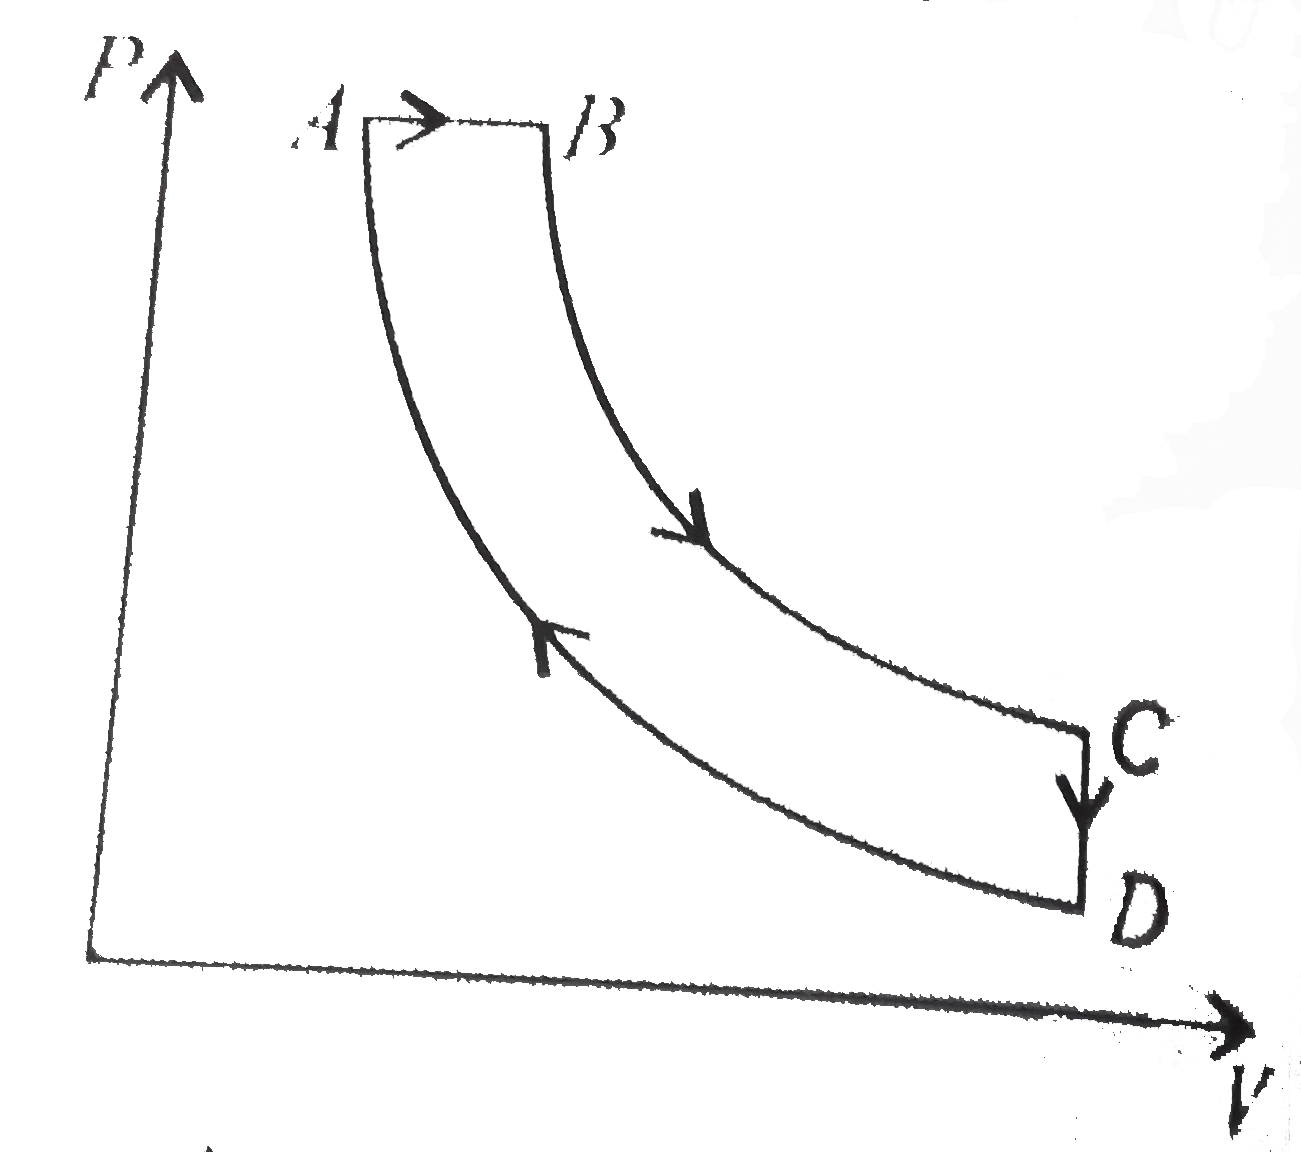
Which of the following p-V curve represents maximum work done?
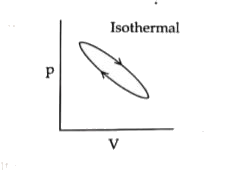
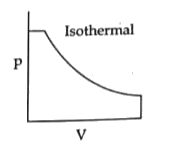
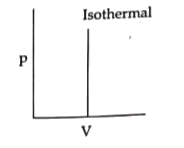
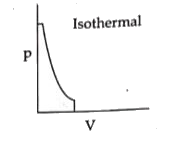
To determine which p-V curve represents the maximum work done, we need to analyze the relationship between the pressure (p), volume (V), and the work done during a thermodynamic process.
1. Understanding Work Done in p-V Diagram:
- The work done (W) by or on a gas during a process can be represented as the area under the p-V curve.
- Mathematically, work done is given by the integral of pressure with respect to volume:
W=∫pdV
2. Identifying the Area Under the Curve:
- In a p-V diagram, the area under the curve between two states (initial and final) represents the work done during the transition from one state to another.
- The larger the area, the greater the work done.
3. Comparing Different p-V Curves:
- If we have multiple p-V curves to compare, we need to look for the curve that encloses the largest area between the initial and final states.
- This could be a straight line or a curve, but the key is to visualize the area under each curve.
4. Determining the Curve with Maximum Area:
- Among the given options, identify which curve has the largest enclosed area under it.
- If one curve is a straight line and another is a curve that bows outward, the outward-bowing curve will typically enclose more area.
5. Conclusion:
- The p-V curve that represents the maximum work done is the one that has the largest area under it when considering the same initial and final states.
- The work done (W) by or on a gas during a process can be represented as the area under the p-V curve.
- Mathematically, work done is given by the integral of pressure with respect to volume:
W=∫pdV
- In a p-V diagram, the area under the curve between two states (initial and final) represents the work done during the transition from one state to another.
- The larger the area, the greater the work done.
- If we have multiple p-V curves to compare, we need to look for the curve that encloses the largest area between the initial and final states.
- This could be a straight line or a curve, but the key is to visualize the area under each curve.
- Among the given options, identify which curve has the largest enclosed area under it.
- If one curve is a straight line and another is a curve that bows outward, the outward-bowing curve will typically enclose more area.
- The p-V curve that represents the maximum work done is the one that has the largest area under it when considering the same initial and final states.
Topper's Solved these Questions
- NEET 2022BOOK - NEET PREVIOUS YEAR (YEARWISE + CHAPTERWISE)CHAPTER - NEET 2022EXERCISE - Section - B (Chemistry)
15 Videos
- NEET 2022BOOK - NEET PREVIOUS YEAR (YEARWISE + CHAPTERWISE)CHAPTER - NEET 2022EXERCISE - Section - B (Chemistry)
15 Videos
- NEET 2021BOOK - NEET PREVIOUS YEAR (YEARWISE + CHAPTERWISE)CHAPTER - NEET 2021EXERCISE - QUESTION
50 Videos
- NEET 2023BOOK - NEET PREVIOUS YEAR (YEARWISE + CHAPTERWISE)CHAPTER - NEET 2023EXERCISE - Question
50 Videos
Similar Questions
Knowledge Check
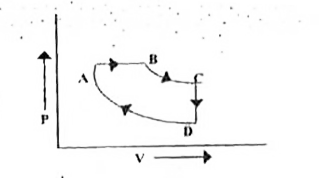
A cyclic process ABCD is shown in the figure P-V diagram. Which of the following curves represent the same process?
 A
A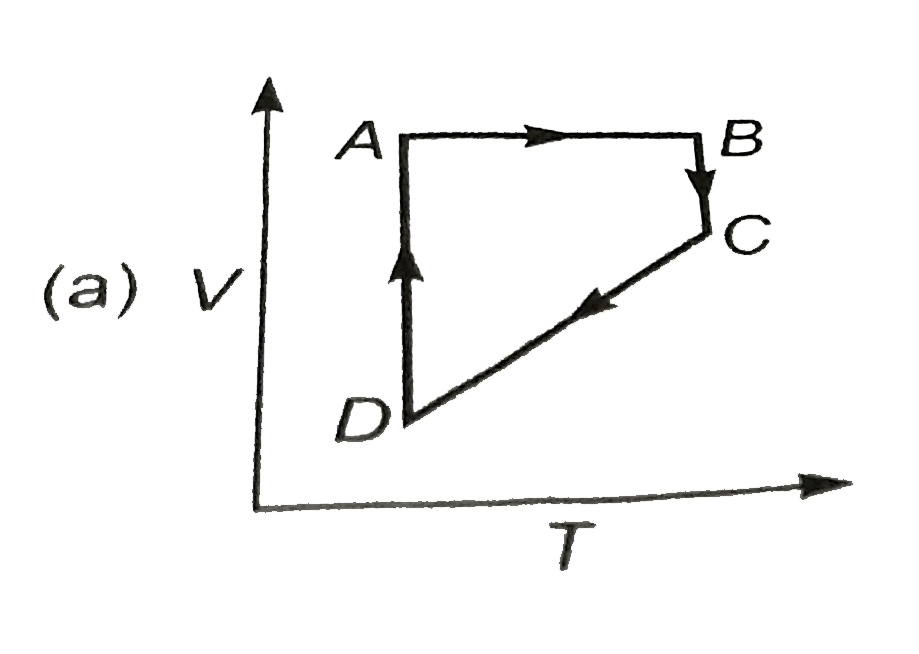 B
B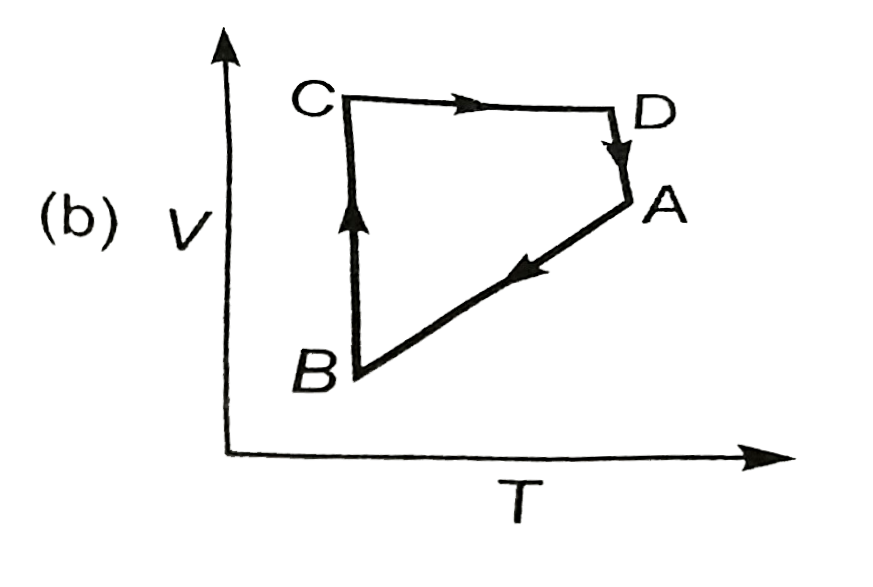 C
C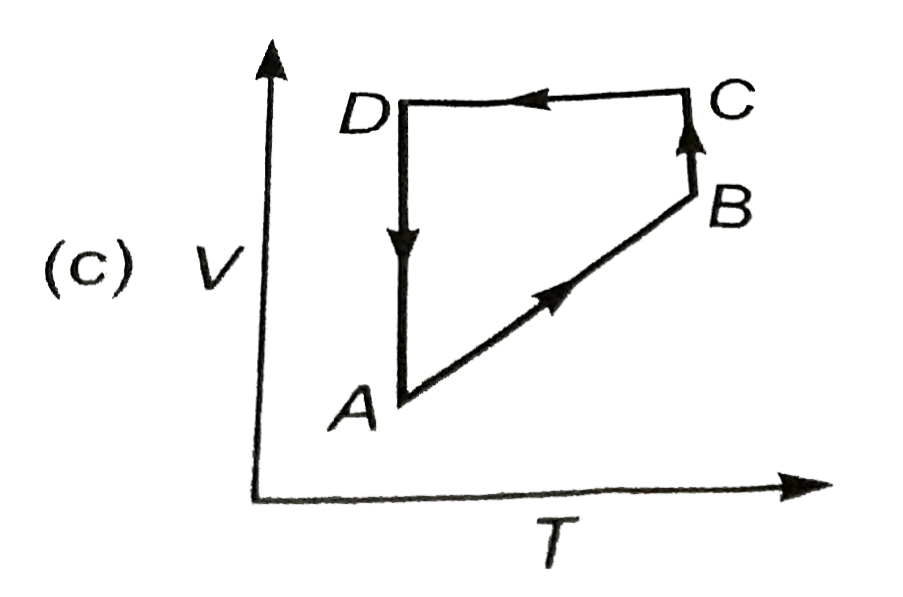 D
D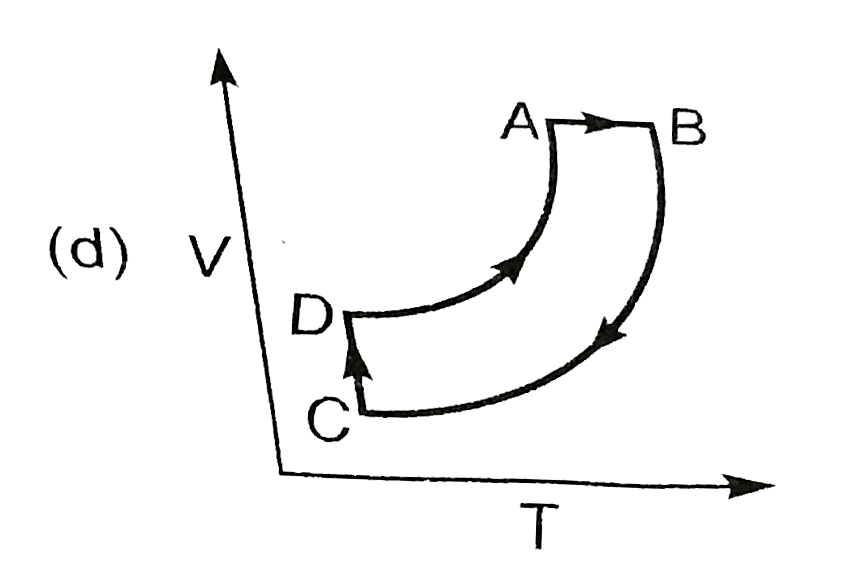
Which of the following curves represent(s) Boyle's law?
A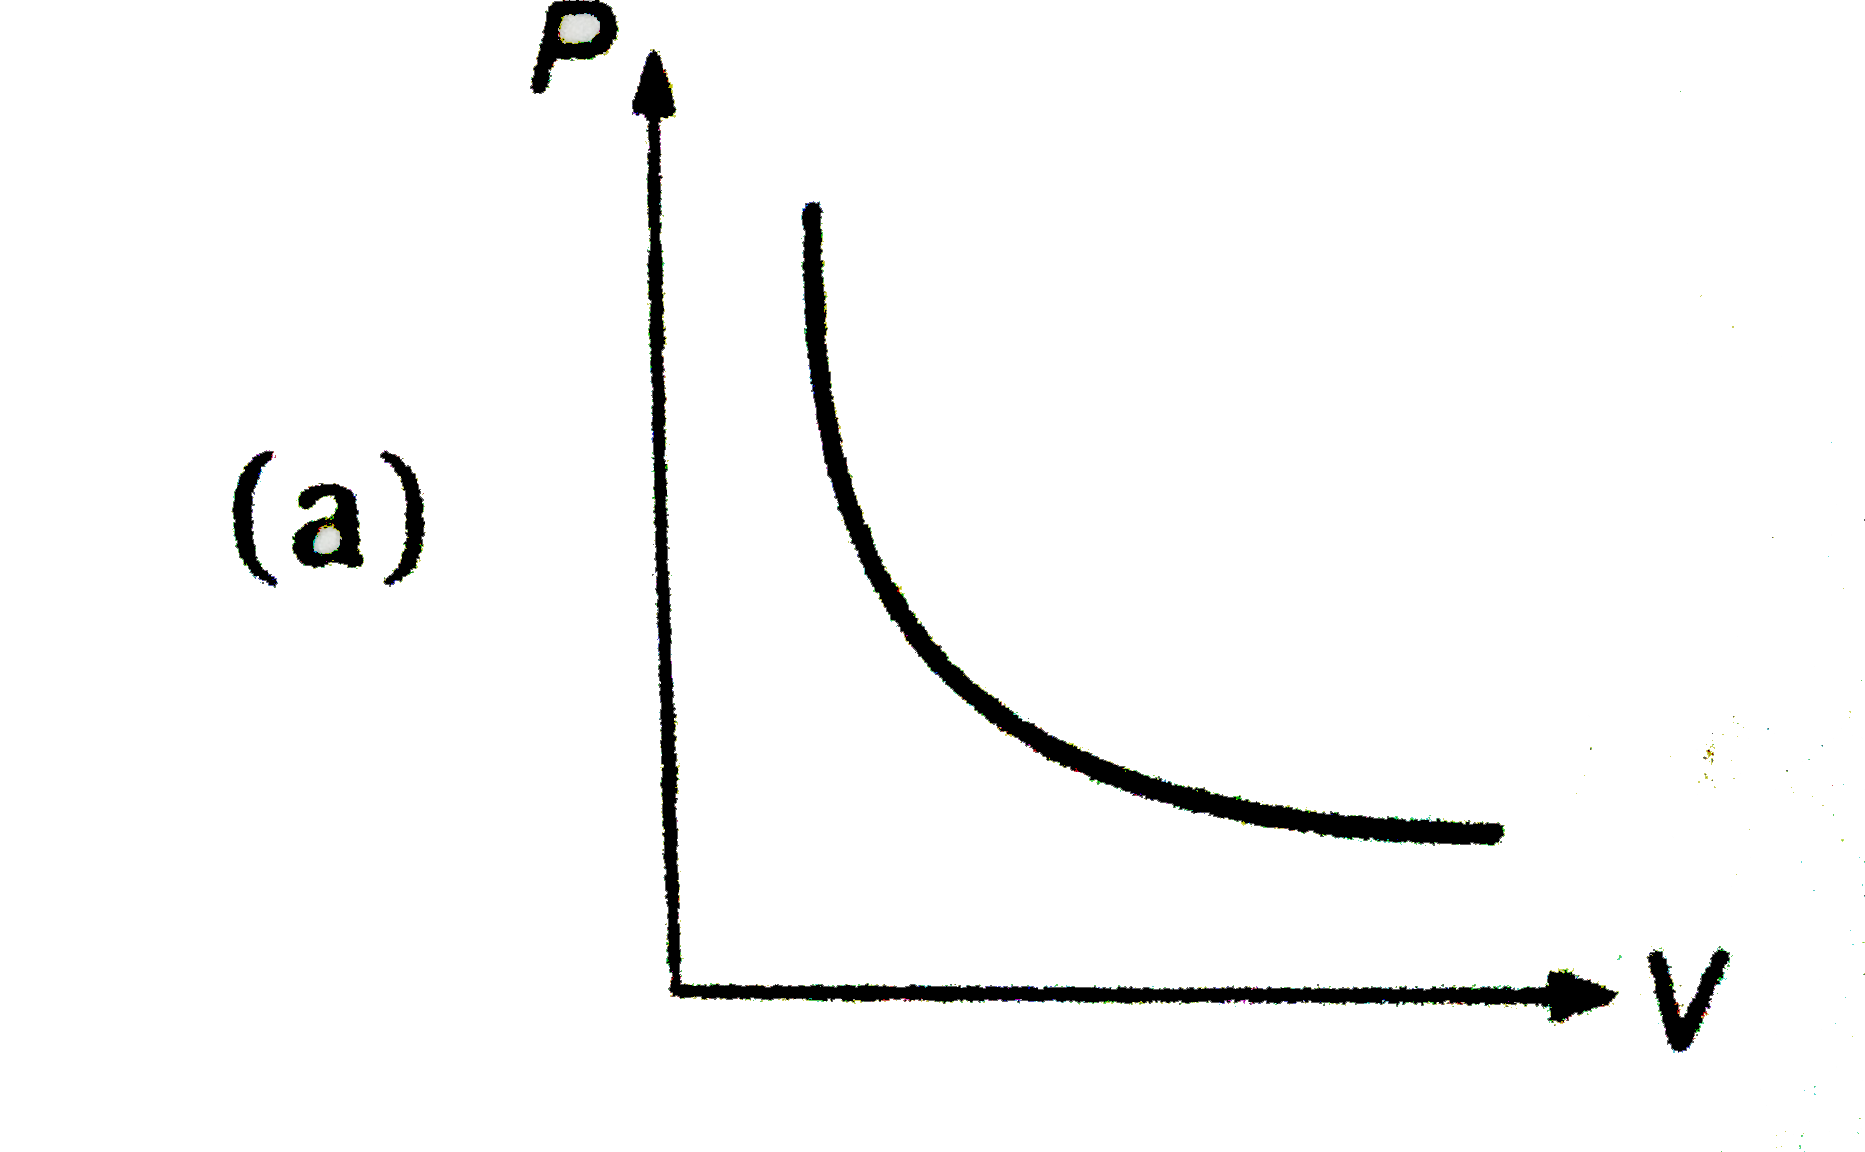 B
B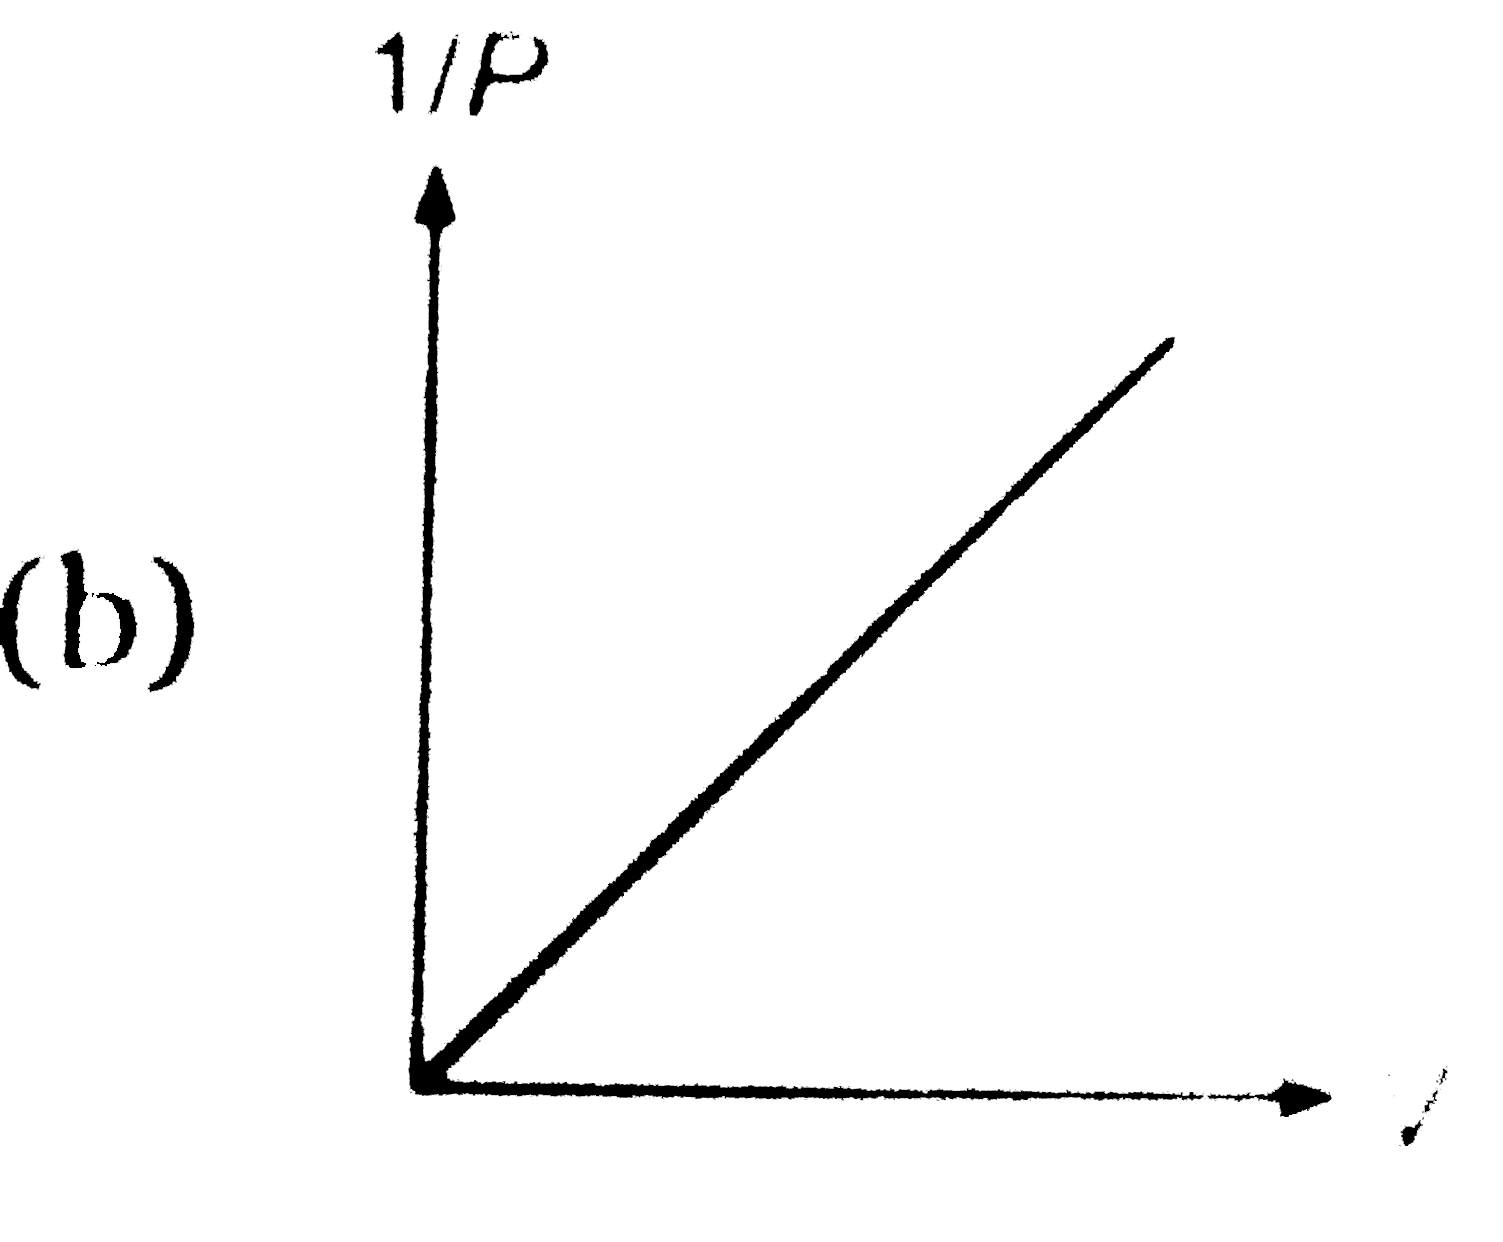 C
C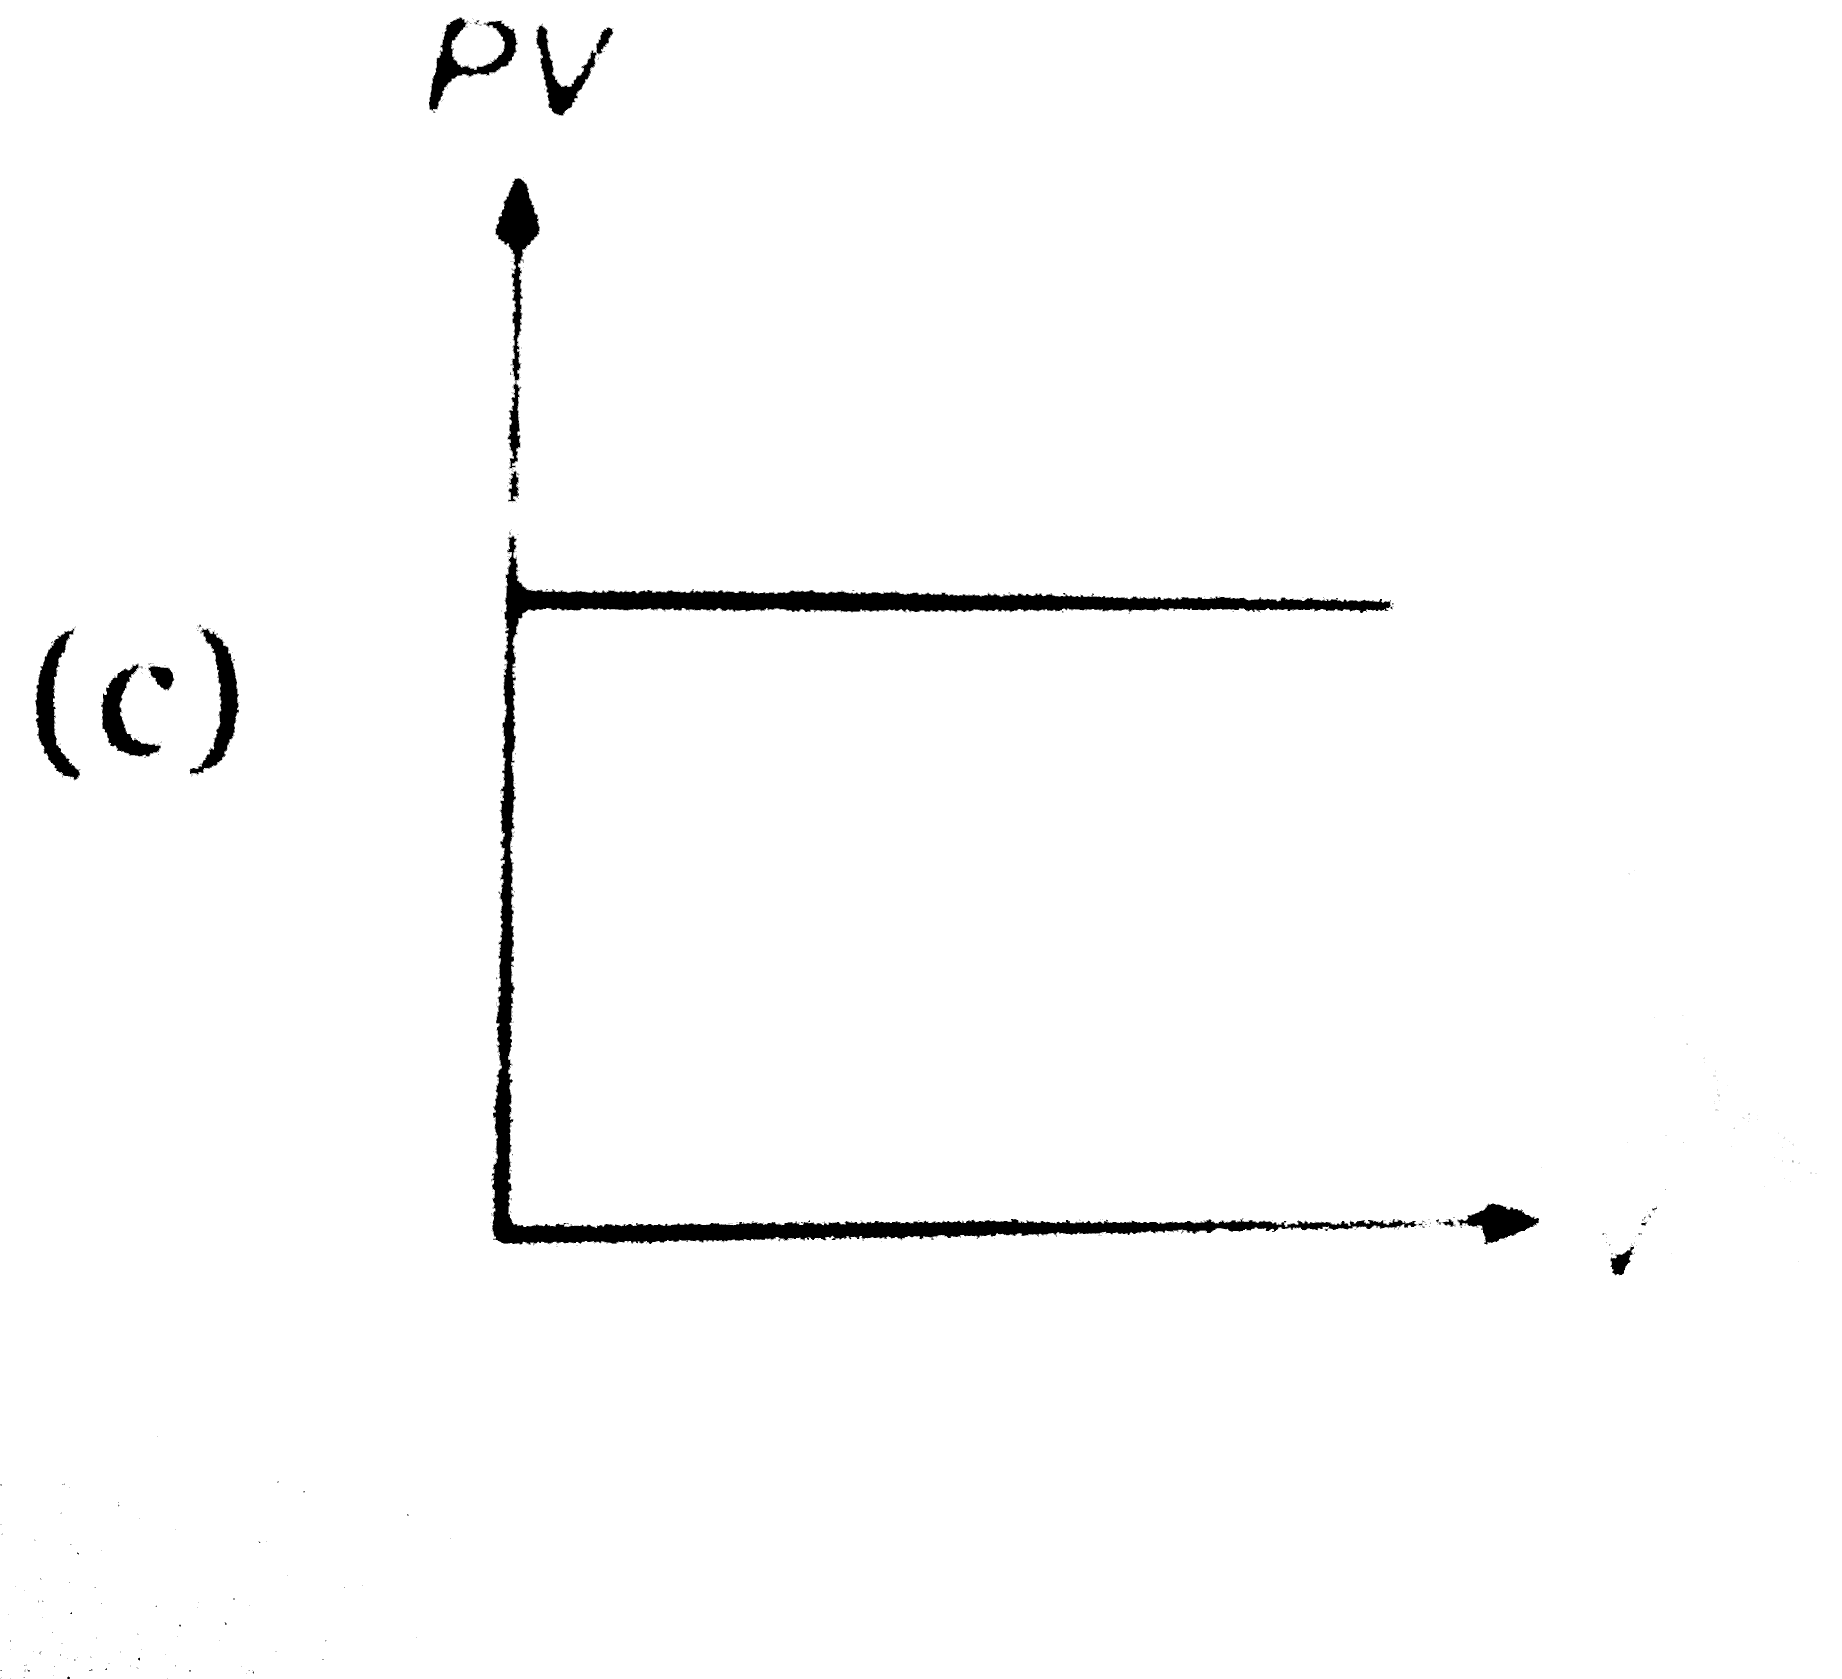 D
D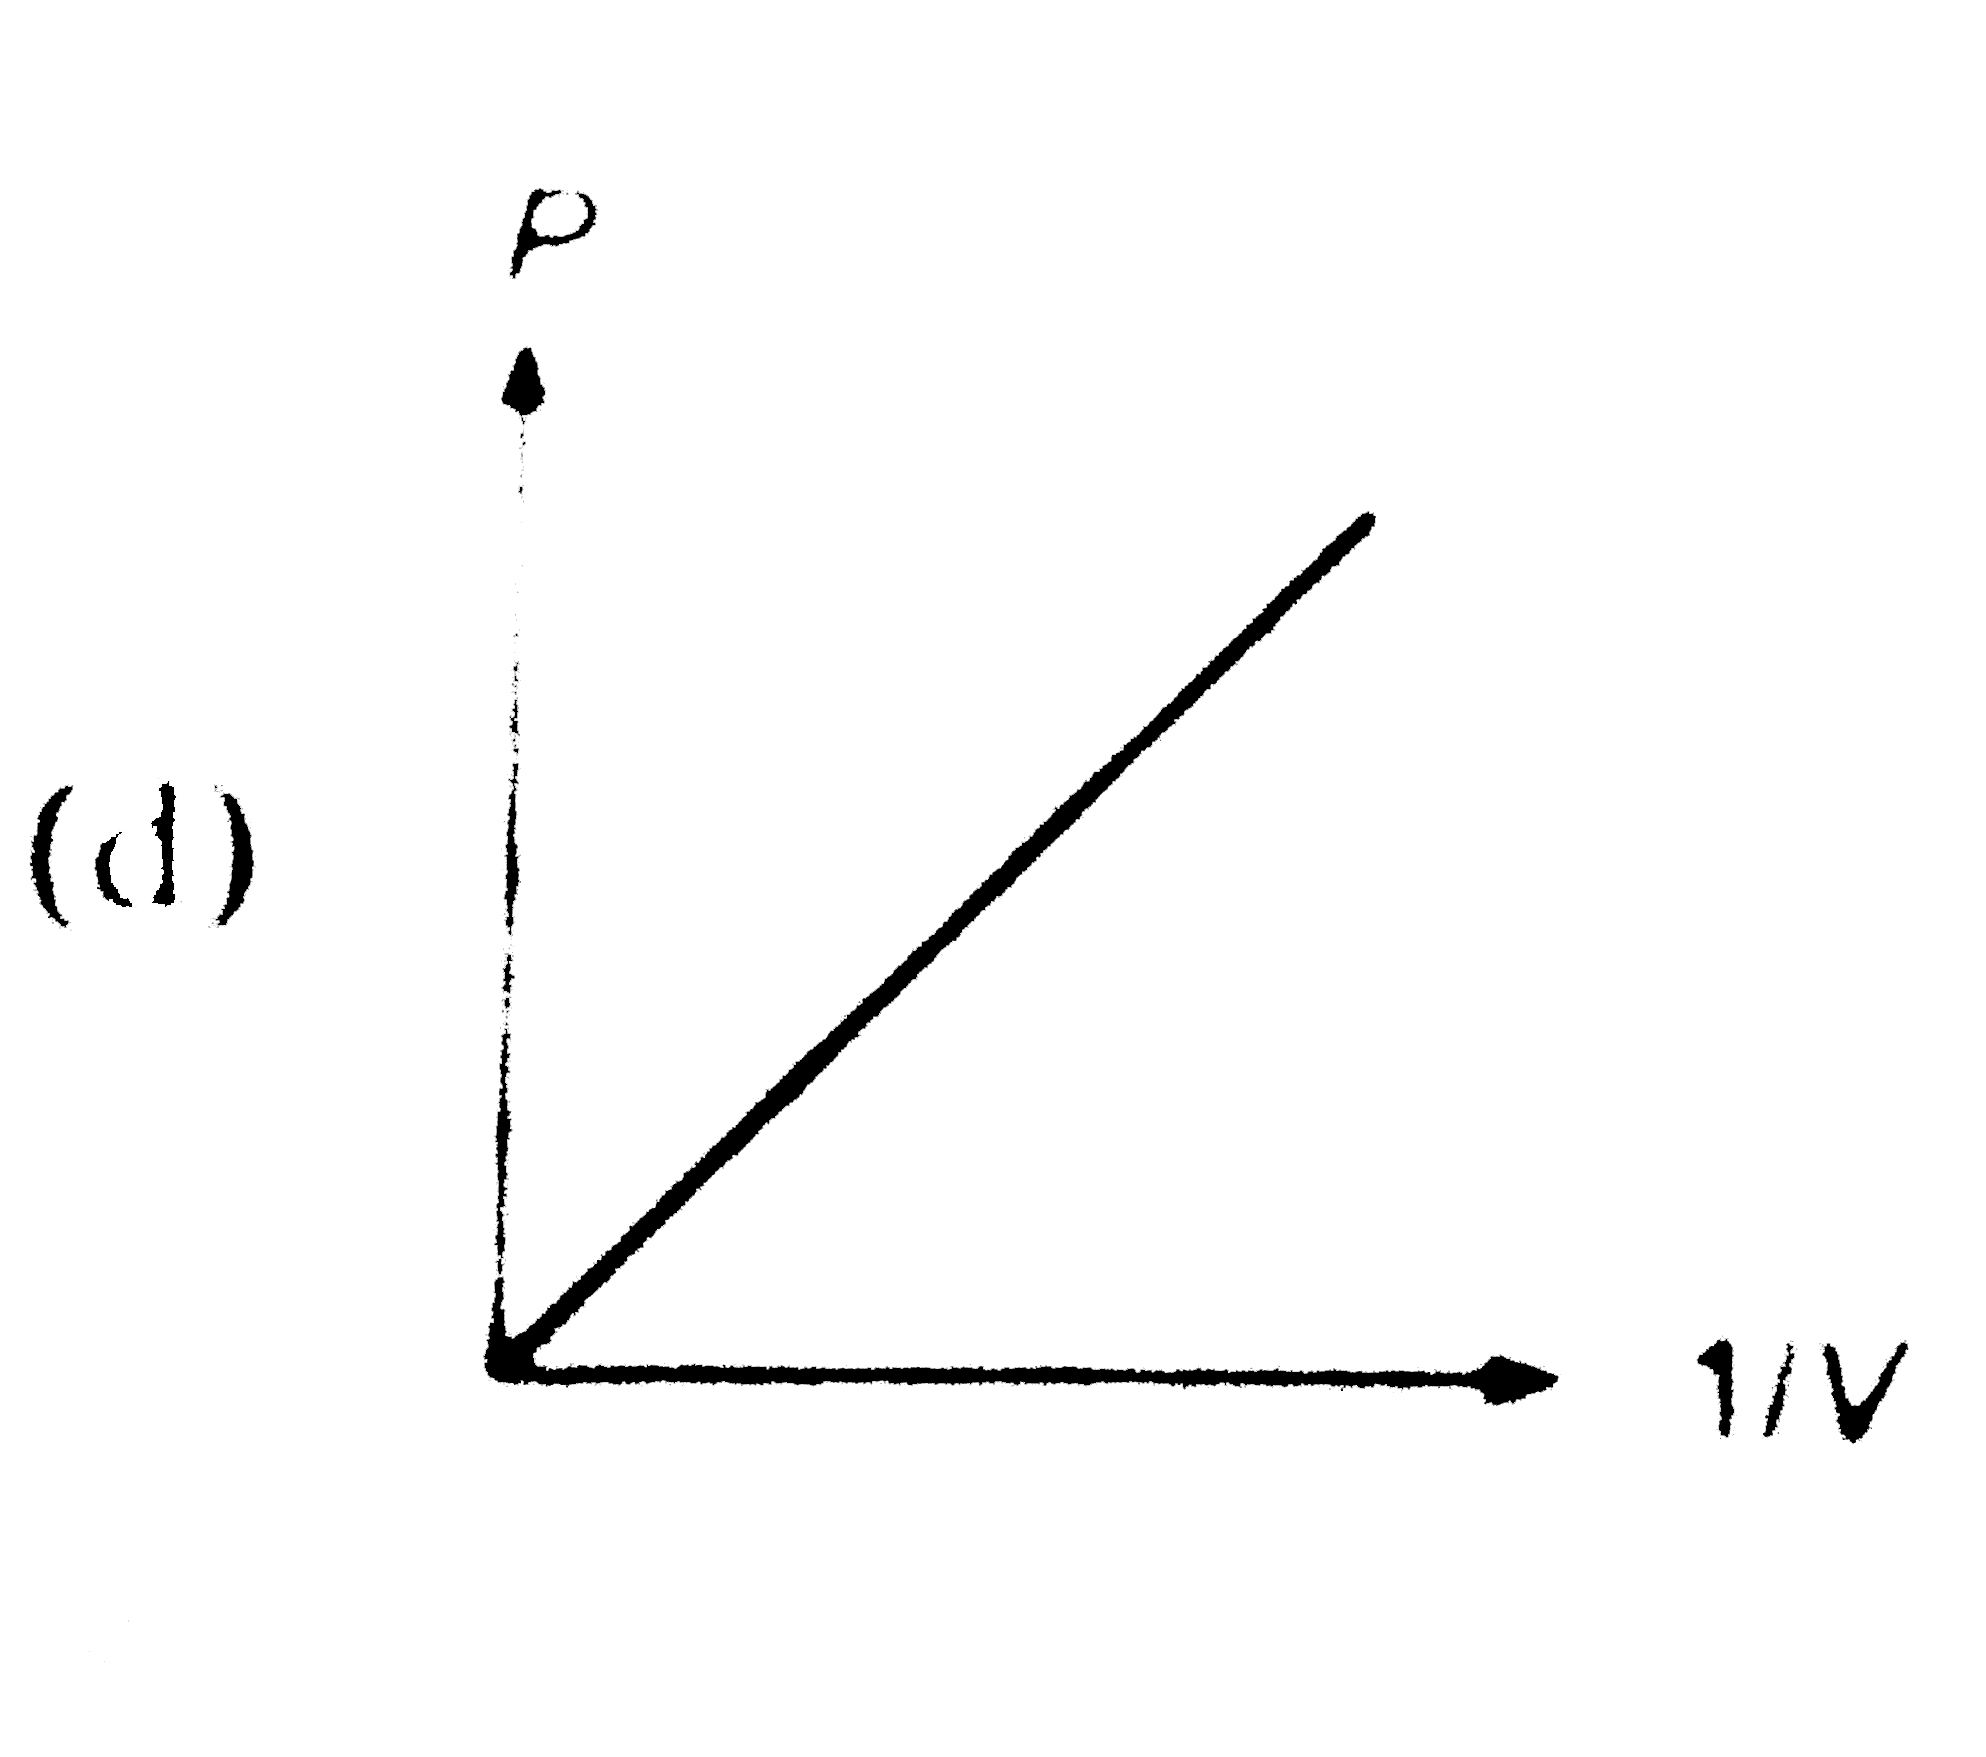
A cyclic process ABCD is shown in the figure P - V diagram. Which of the following curves represent the same process
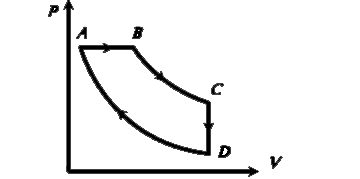 A
A B
B C
C D
D
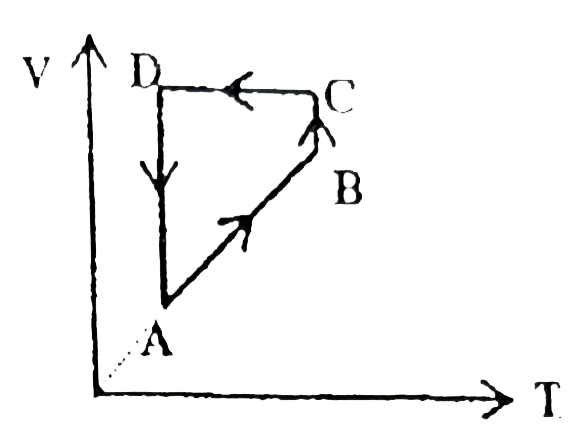
A cyclic process ABCD is shown in the V−T diagram. Which of the following curves represent the same process ?
View SolutionWhich of the following curves represents a third order reaction ?
View SolutionWhich of the following curves represents a third order reaction ?
View SolutionWhich of the following curves represent the Henry's law
View SolutionWhich of the following curves represents the Henry's law ?
View Solution

