A survey was taken at a high school and the results were put in a circular graph. The students were asked to list their favourite is shown. If a person is chosen at random from the school find the probability of each response.
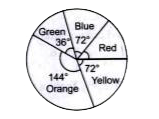
The probability of favourite colour being blue or green is:
0.1
0.2
0.3
0.4
The correct Answer is:B
Topper's Solved these Questions
- PROBABILITYBOOK - OSWAL PUBLICATIONCHAPTER - PROBABILITYEXERCISE - Passage Based Questions
13 Videos
- PROBABILITYBOOK - OSWAL PUBLICATIONCHAPTER - PROBABILITYEXERCISE - Self Assessment
66 Videos
- PROBABILITYBOOK - OSWAL PUBLICATIONCHAPTER - PROBABILITYEXERCISE - Assertion and Reasoning Based Questions
3 Videos
- POLYNOMIALS BOOK - OSWAL PUBLICATIONCHAPTER - POLYNOMIALS EXERCISE - SELF -ASSESSMENT
24 Videos
- QUADRATIC EQUATIONSBOOK - OSWAL PUBLICATIONCHAPTER - QUADRATIC EQUATIONSEXERCISE - Passage Based Questions
10 Videos
Similar Questions
Of the students in a school, it is known that 30% have 100% attendance and 70% students are irregular. Previous year results report that 70% of all students who have 100% attendance attain A grade and 10% irregular students attain A grade in their annual examination. At the end of the year, one student is chosen at random from the school and he was found to have an A grade. What is the probability that the student has 100% attendance ? Is regularity required only in school ? Justify your answer.
View SolutionOf all the students in a school, it is known that 30% have 100% attendance and 70% students are irregular. Previous year results report that 70% of all students who have 100% attendance attain A grade and 10% irregular students attain A grade in their annual examination. At the end of the year, one student is chosen at random from the school and he was found to have an A grade. What is the probability that the student has 100% attendance ? Is regularity required in school ? Justify your answer.
View Solution
Knowledge Check
A survey was taken at a high school, and the results were put in a circle graph. The students were asked to list their favourite colours. The measurement of each central angle is shown. If a person is chosen at random from the school, find the probability of each response.
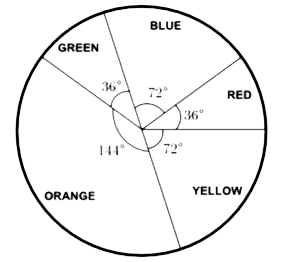
What is the probability of favourite colour being blue or green ?A0.1B0.2C0.3D0.4A survey was taken at a high school, and the results were put in a circle graph. The students were asked to list their favourite colours. The measurement of each central angle is shown. If a person is chosen at random from the school, find the probability of each response.
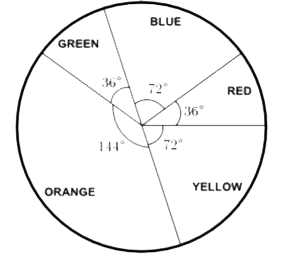
What is the probability of favourite colour not being red or blue?A0.35B0.7C0.15D0.50A survey was taken at a high school, and the results were put in a circle graph. The students were asked to list their favourite colours. The measurement of each central angle is shown. If a person is chosen at random from the school, find the probability of each response.
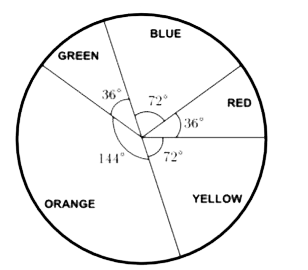
What is the probability of favourite colour being red or blue?A0.2B0.3C0.1D0.4
A survey was taken at a high school, and the results were put in a circle graph. The students were asked to list their favourite colours. The measurement of each central angle is shown. If a person is chosen at random from the school, find the probability of each response.
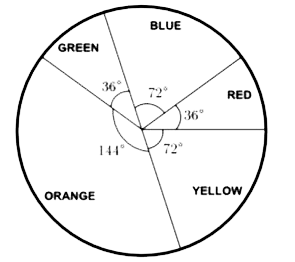
What is the probability of favourite colour not being orange or green ?
View SolutionA survey was taken at a high school, and the results were put in a circle graph. The students were asked to list their favourite colours. The measurement of each central angle is shown. If a person is chosen at random from the school, find the probability of each response.
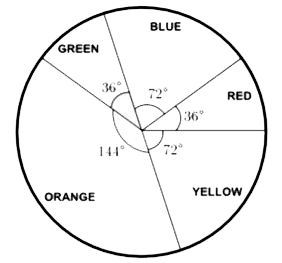
What is the probability of favourite colour being red ?
View SolutionIn a sample survey of 645 people , it was found that 516 people have a high school certificate . If a person is chosen at random , what is the probability that he/she has a high school certificate ?
View SolutionThe Harrisburg Recreation Center recently changed its hours to open 1 hour later and close 3 hours later than it had previously. Residents of Harrisburg age 16 or older were given a survey and 560 residents replied. The survey asked each resident his or her student status (high school, college, or nonstudent) and what he or she thought about the change in hour (approve, disapprove, or no opinion). The results are summarized in the table below.

Suppose a person will be chosen at random from these 560 residents. Which of the following values is closest to the probability that the person chosen will NOT be a high student and will NOT have replied with no opinion?
View SolutionA recent survey reported that 60 percent of the students at a high school are girls and 65 percent of girls at this school play a sport. If a student at this high school were selected at random, what is the probability that the student is a girl who plays a sport?
View Solution
