The graph of potential barrier versus width of depletion region for an unbiased diode is shown in graph A. In comparison to A ,graphs B and C are obtained after biasing the diode in different ways .Identify the type of biasing in B and C and justify your answer.

Step by step video solution for The graph of potential barrier versus width of depletion region for an unbiased diode is shown in graph A. In comparison to A ,graphs B and C are obtained after biasing the diode in different ways .Identify the type of biasing in B and C and justify your answer. by Physics experts to help you in doubts & scoring excellent marks in Class 12 exams.
Updated on:21/07/2023Topper's Solved these Questions
- SAMPLE PAPER 2023 TERM IBOOK - CBSE MODEL PAPERCHAPTER - SAMPLE PAPER 2023 TERM IEXERCISE - SECTION C
7 Videos
- SAMPLE PAPER 2023 TERM IBOOK - CBSE MODEL PAPERCHAPTER - SAMPLE PAPER 2023 TERM IEXERCISE - SECTION D
4 Videos
- SAMPLE PAPER 2023 TERM IBOOK - CBSE MODEL PAPERCHAPTER - SAMPLE PAPER 2023 TERM IEXERCISE - SECTION D
4 Videos
- SAMPLE PAPER 2022 TERM IIBOOK - CBSE MODEL PAPERCHAPTER - SAMPLE PAPER 2022 TERM IIEXERCISE - SECTION B
16 Videos
- SAMPLE QUESTION PAPER (THEORY)BOOK - CBSE MODEL PAPERCHAPTER - SAMPLE QUESTION PAPER (THEORY)EXERCISE - Section – E
6 Videos
Similar Questions
The graphs of y=ax2+bx+c are given in Fig. Identify the signs of a, b and c in each of the following: (FIGURE)
View Solutionp-n junction is a semiconductor diode. It is obtained by bringing p-type semiconductor inclose contact with n-type semiconductor. A thin layer is developed at the p-n junction which is devoid of any charge carrier but has immobile ions. It is called depletion layer. At the junction a potential barrier appears, which does not allow the movement of majority charge carriers across the junction in the absence of any biasing of the junction.
p-n junction offer low resistance when forward biased and high resistance when reverse biased. Read the above paragaph and answer the following question:
(i) Can we measure the potential barrier of p-n junction by putting a sensitive voltmeter across its terminals?
(ii) What practical lesson do you draw from the above study?
View Solution
Knowledge Check
Different types of phyllotaxy are shown the following figures. Identify the types of phyllotaxy (A, B and C).
 AA- Alternate, B - Opposite, C- WhorledBA- Whorled, B-Alternate, C- OppositeCA-Whorled, B - Opposite, C- AlternateDA-Opposite, B - Alternate, C- Whorled
In a forward biased PN- junction diode, the potential barrier in the depletion region is of the from...
A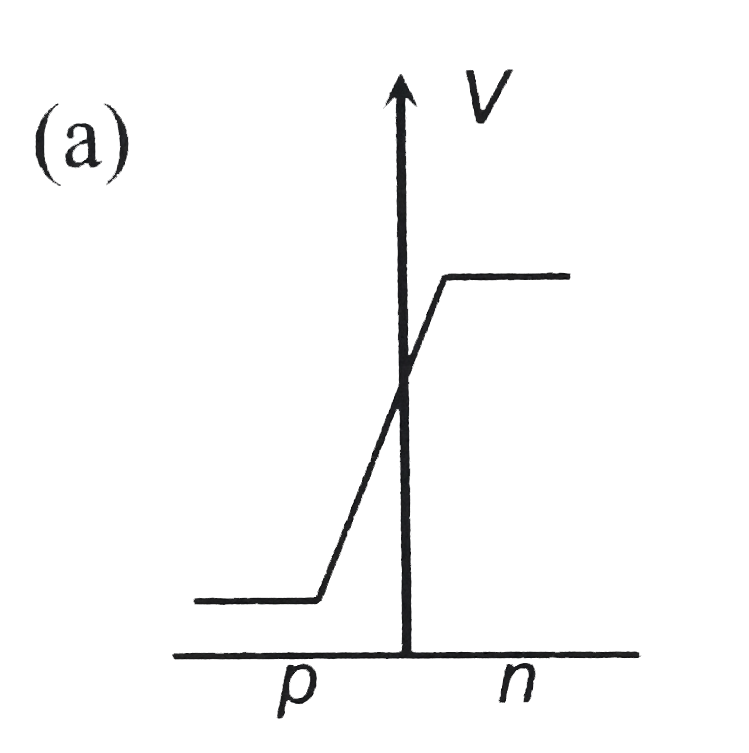 B
B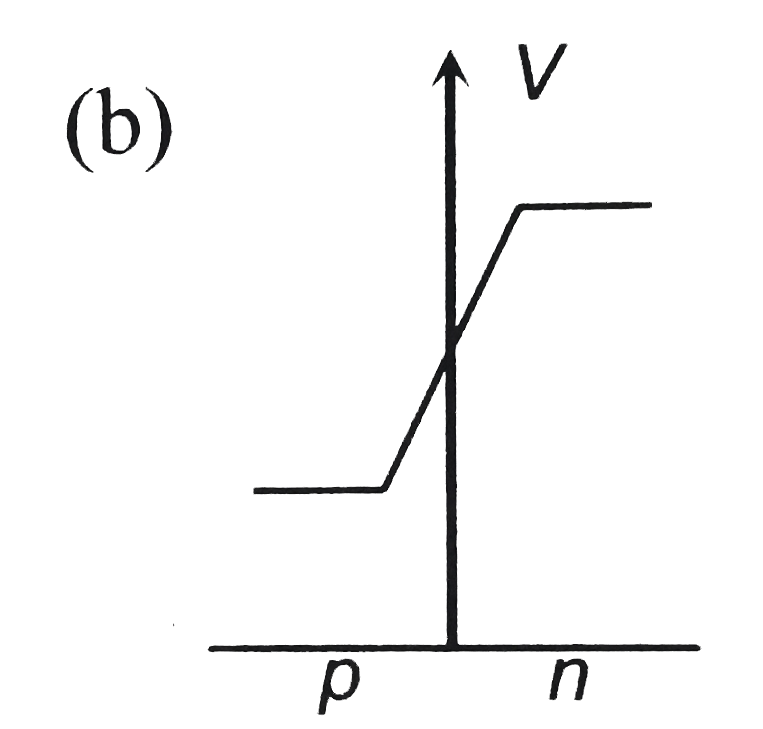 C
C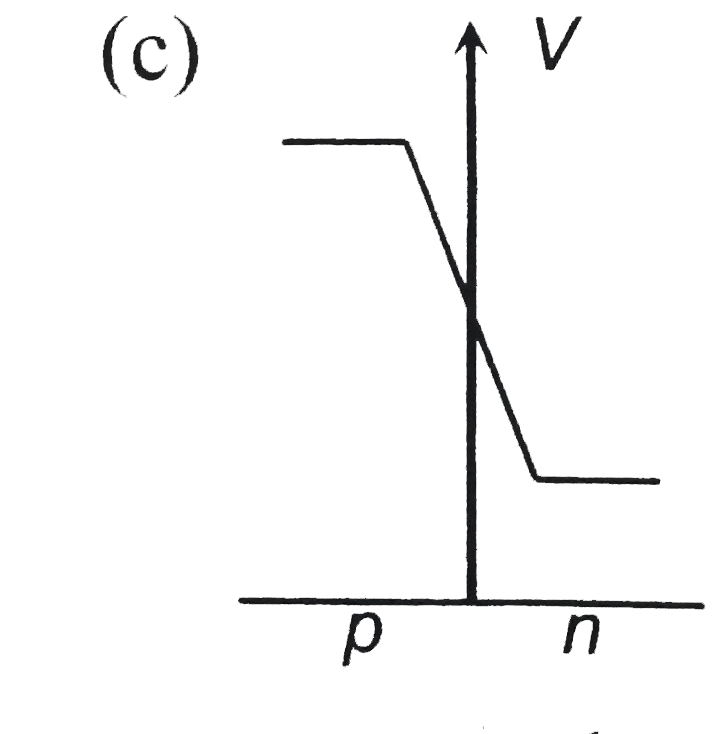 D
D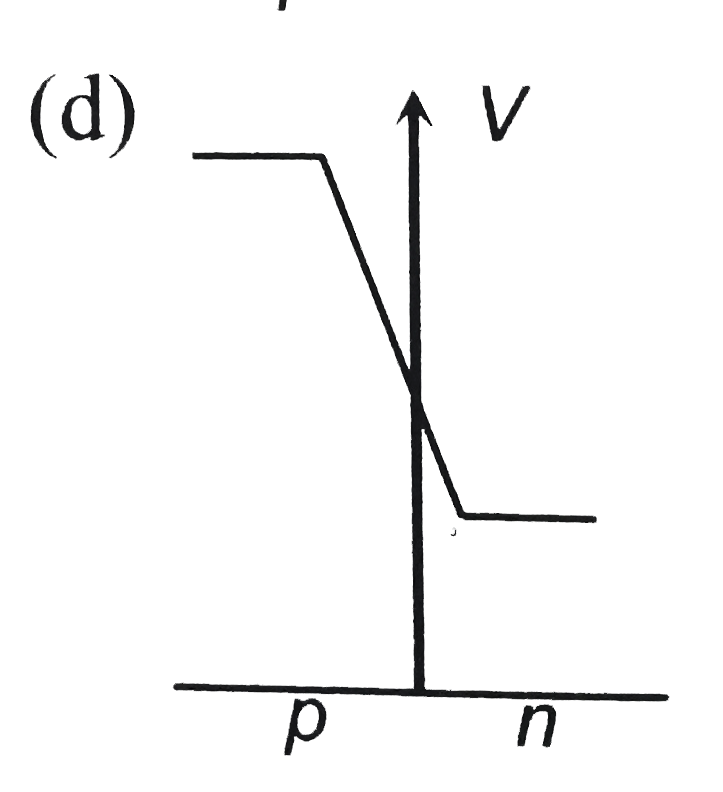
In a forward biased p-n junction diode, the potential barrier in the depletion region will be of the form
A B
B C
C D
D
Q6.When "p" - "n" junction diode is forward biased,then
(a)the depletion region is reduced and barrier height is increased (b) the depletion region is widened and barrier height is reduced (c)both the depletion region and barrier height are reduced (d) both the depletion region and barrier height are increased
View SolutionExplain with the help of a diagram, how depletion region and potential barrier are formed in a junction diode.
If a small voltage is applied to a p-n junction diode how will the barrier potential be affected when it is (i) forward biased and (ii) reverse biased?
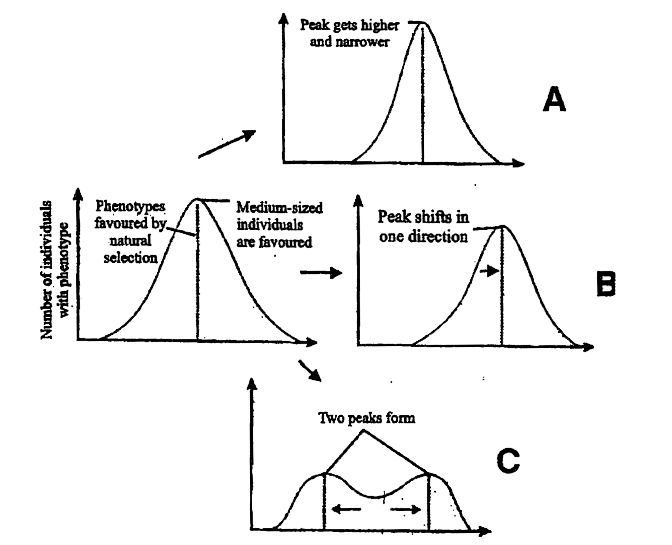
View SolutionFollowing diagrammatic representation refers the natural selection on different traits. In which all the three graphs A, B and C are identified correctly -
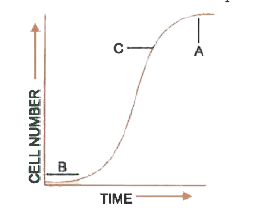
View SolutionGiven below is a graph drawn on the parameters of growth versus time A,B and C respectively represent.
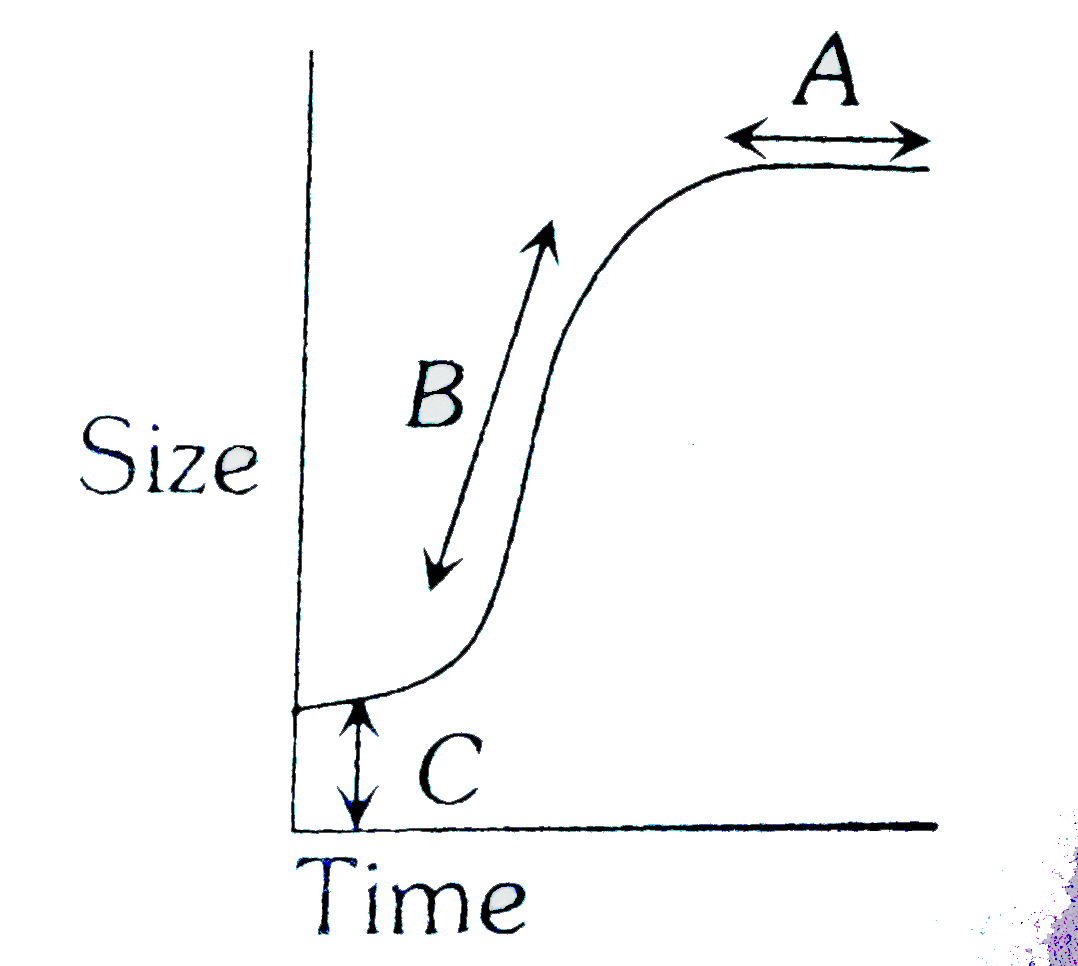
View SolutionGiven below is a graph on the parametes of growth versus time A,B , C respectively represent
View Solution
