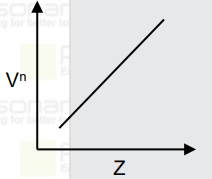
It is observed that characteristic X-ray spectra of elements show regularity. When frequency to the power "n" i.e. v" of X-rays emitted is plotted against atomic number "Z", following graph is obtained

The value of "n" is
2
3
1/2
4
The correct Answer is:D
Step by step video & text solution for It is observed that characteristic X-ray spectra of elements show regularity. When frequency to the power "n" i.e. v" of X-rays emitted is plotted against atomic number "Z", following graph is obtained The value of "n" is by Chemistry experts to help you in doubts & scoring excellent marks in Class 12 exams.
Updated on:21/07/2023Topper's Solved these Questions
Similar Questions
Knowledge Check
Consider the following statements
I.Henry Moseley observed regularities in the characteristics of X ray spectra of elements
II.A plot of frequency of X rays emitted against atomic number (Z) give a straight line
III.The atomic number of element is equal to the number of neutron(s)in a neutral atom
IV.Electron configuration of an atom determine the physical and chemical properties
Choose the correct statementAonly IBI and IIICI,II and IVDII,III,and IvThe plot of square root of frequency of X-ray emitted against atomic number led to suggestion of which law/rule?
APeriodic lawBModernperiodic lawCHund's ruleDNewland's lawThe plot of square root of frequency of X-ray emitted against atomic number led to suggestion of which law/rule?
APeriodic lawBModernperiodic lawCHund's ruleDNewland's law
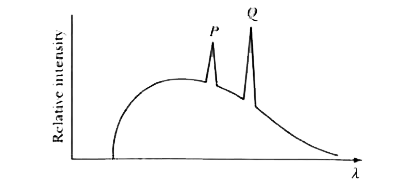
In a characteristic x-ray spectra (as shown in the following figure), L shell of some element is superimposed on continuous x-ray spectra. Ere

View Solutionif the frequency fo Ka X-ray emitted from the element with atomic number 31 is f, then the frequency of Ka x-ray emitted from the elemet with atomic number 51 would be
View SolutionThe graph that correctly represents the relation of frequency v of a particular characteristic X - ray with the atomic number Z of the material is
View SolutionA sound source, emitting sound of constant frequency, moves with a constant speed and crosses a stationary observer. The frequency (n) of sound heard by the observer is plotted against time (t). Which of the following graphs represents the correct variation :-
View SolutionA sound source, emitting sound of constant frequency, moves with a constant speed and crosses a stationary observer. The frequency (n) of sound heard by the observer is plotted against time (t). Which of the following graphs represents the correct variation :-
View Solution


