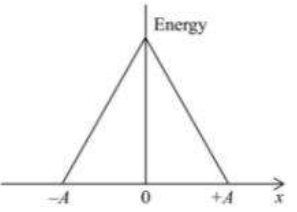
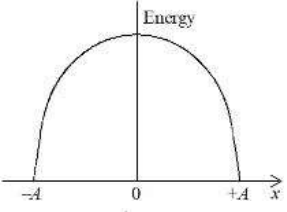
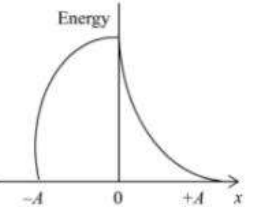
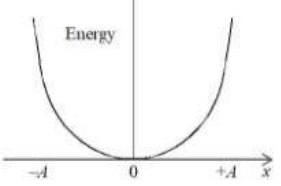
Which graph represents the difference between total energy and potential energy of a partical execution SHM vs it's distance from mean position


The correct Answer is:B
Step by step video & text solution for Which graph represents the difference between total energy and potential energy of a partical execution SHM vs it's distance from mean position by Physics experts to help you in doubts & scoring excellent marks in Class 12 exams.
Topper's Solved these Questions
Similar Questions
Knowledge Check
- Question 1 - Select One
The potential energy of a particle (Ux) executing SHM is given by
AUx=K2(x−x0)2BUx=K1x+K2x2+K3x3CUx=Ae−bxDUx= constant - Question 2 - Select One
The total energy of particle executing SHM is proportional to
AdisplacementBfrequencyCvelocity at mean positionDsquare of amplitude - Question 3 - Select One
The total energy of particle executing SHM is proportional to
AdisplacementBfrequencyCvelocity at mean positionDsquare of amplitude
Draw the graph between displacement and
kinetic energy for a particle executing SHM.View SolutionThe total energy of a particle executing S.H.M. is proportional to
View SolutionWhat is the ratio betweenthe potential energy and the total energy of a particel executing SHM, when its diplacement is half of its amplitude?
View SolutionThe graph between total energy and displacement of a particle performing S.H.M. is
View SolutionThe kinetic energy and the potential energy of a particle executing SHM are equal The ratio of its displacement and amplitude will be
View Solution
