Given below are two statements related to Ellingham diagram:
Statement I: Ellingham diarams can be constructed for formation of oxides,sulfides and halides of metals .
Statement II .It consists of plots of ΔfH0 vs T for formation of oxides of elements.
In the light of the above statements, choose the most appropriate answer from the options given below:
Both statement I and Statement II are incorrect
Statement I is incorrect but Statement II is correct
Both Statement I and Statement II are correct
Statement I is correct but Statement II is incorrect
The correct Answer is:A
To solve the question regarding the Ellingham diagram, we need to analyze the two statements provided:
Step 1: Analyze Statement I
- Statement I claims that "Ellingham diagrams can be constructed for the formation of oxides, sulfides, and halides of metals."
- This statement is true. Ellingham diagrams are indeed used to represent the thermodynamic stability of various compounds, including oxides, sulfides, and halides of metals. They provide valuable information about the temperature dependence of the stability of these compounds.
Step 2: Analyze Statement II
- Statement II states that "It consists of plots of ΔfH° vs T for the formation of oxides of elements."
- This statement is false. The Ellingham diagram actually plots the Gibbs free energy change (ΔG°) versus temperature (T) for the formation of oxides, not the standard enthalpy change (ΔfH°). The Gibbs free energy is crucial for understanding the thermodynamic favorability of reactions at different temperatures.
Step 3: Conclusion
- Based on the analysis, we conclude that Statement I is correct and Statement II is incorrect.
Thus, the most appropriate answer is that Statement I is true and Statement II is false.
- Statement I claims that "Ellingham diagrams can be constructed for the formation of oxides, sulfides, and halides of metals."
- This statement is true. Ellingham diagrams are indeed used to represent the thermodynamic stability of various compounds, including oxides, sulfides, and halides of metals. They provide valuable information about the temperature dependence of the stability of these compounds.
- Statement II states that "It consists of plots of ΔfH° vs T for the formation of oxides of elements."
- This statement is false. The Ellingham diagram actually plots the Gibbs free energy change (ΔG°) versus temperature (T) for the formation of oxides, not the standard enthalpy change (ΔfH°). The Gibbs free energy is crucial for understanding the thermodynamic favorability of reactions at different temperatures.
- Based on the analysis, we conclude that Statement I is correct and Statement II is incorrect.
Topper's Solved these Questions
Similar Questions
Knowledge Check
- Question 1 - Select One
Match List - I with List- II
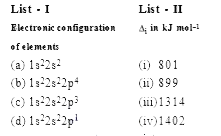
Choose the most appropriate answer from the options given below -A(a)→(ii),(b)→(iii),(c)→(iv),(d)→(i)B(a)→(i),(b)→(iv),(c)→(iii),(d)→(ii)C(a)→(i),(b)→(iii),(c)→(iv),(d)→(ii)D(a)→(iv),(b)→(i),(c)→(ii),(d)→(iii)
Match List-I with List-II :
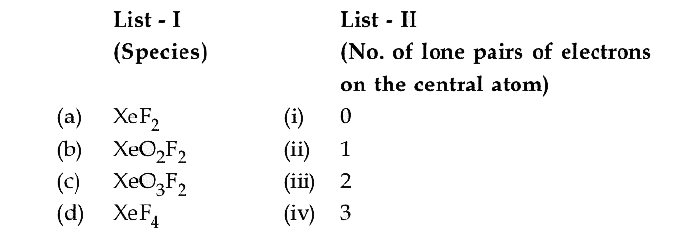
Choose the most appropriate answer from the options given below :View SolutionMatch List-I with List-II :
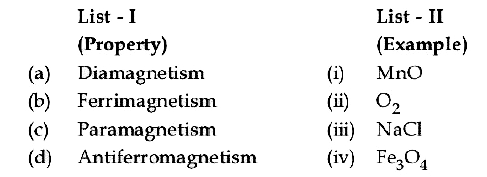
Choose the most appropriate answer from the options given below :View SolutionMatch List - I with List -II

Choose the most appropriate answer from the options given below :View SolutionMatch List -I with List-II :
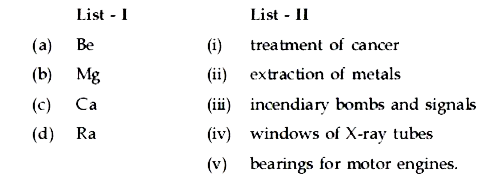
Choose the most appropriate answer from the option given below:View SolutionMatch list - I with List - II :

Choose the most appropriate answer from the options given below :View SolutionMatch List - I with List - II.

Choose the most appropriate answer from the options given below :View SolutionMatch List - I with List - II.

Choose the most appropriate answer from the options given below :View Solution


