Gibbs energy vs T plot for the formation of oxides is given below.
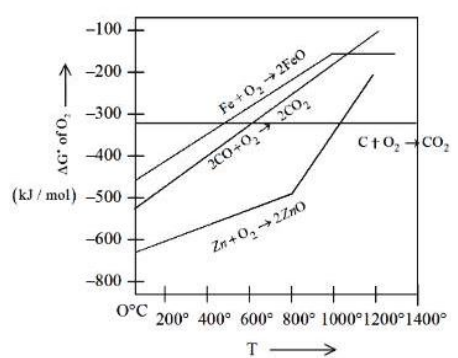
For the given diagram, the correct statement is:-
At 600∘C, CO cannot reduce FeO
At 600∘C, CO can reduce ZnO
At 600∘C, C can reduce ZnO
At 600∘C, C can reduce FeO
Step by step video solution for Gibbs energy vs T plot for the formation of oxides is given below. For the given diagram, the correct statement is:- by Chemistry experts to help you in doubts & scoring excellent marks in Class 12 exams.
Updated on:21/07/2023Topper's Solved these Questions
Similar Questions
Knowledge Check
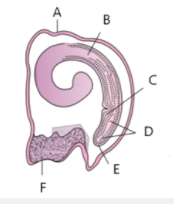
On the basis of below given diagram select the incorrect statement -
 AA and B acts as a regulatory proteinsBSize of C doesn't change during muscle contractionCA-binds Ca2+ during contraction.DB-it contains myosin binding site which helps in cross bridge formation.
Identify the correct statement given below.
AAlpha rays have the highest penetrating poweBBeta rays have the highest penetrating powerCGamma rays have the highest penetrating powerDAll three kinds of rays have the same penetrating powerV-T diagram for n mol monoatomic gas is given below
_PHY_E01_011_Q01.png)
Choose the correct statement"A∣∣∣ΔQ1→2ΔQ3→4∣∣∣=12B∣∣∣ΔQ1→2ΔQ2→3∣∣∣=53CWork done in cyclic process is ΔW=nRT02DThere are only adiabatic and isochoric processes are involved
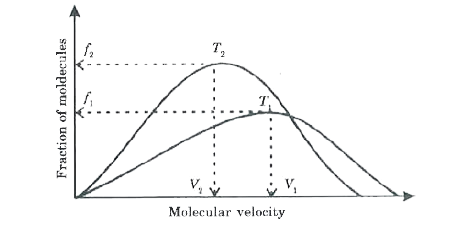
Plot of Maxwell's distribution of velocities is given below:
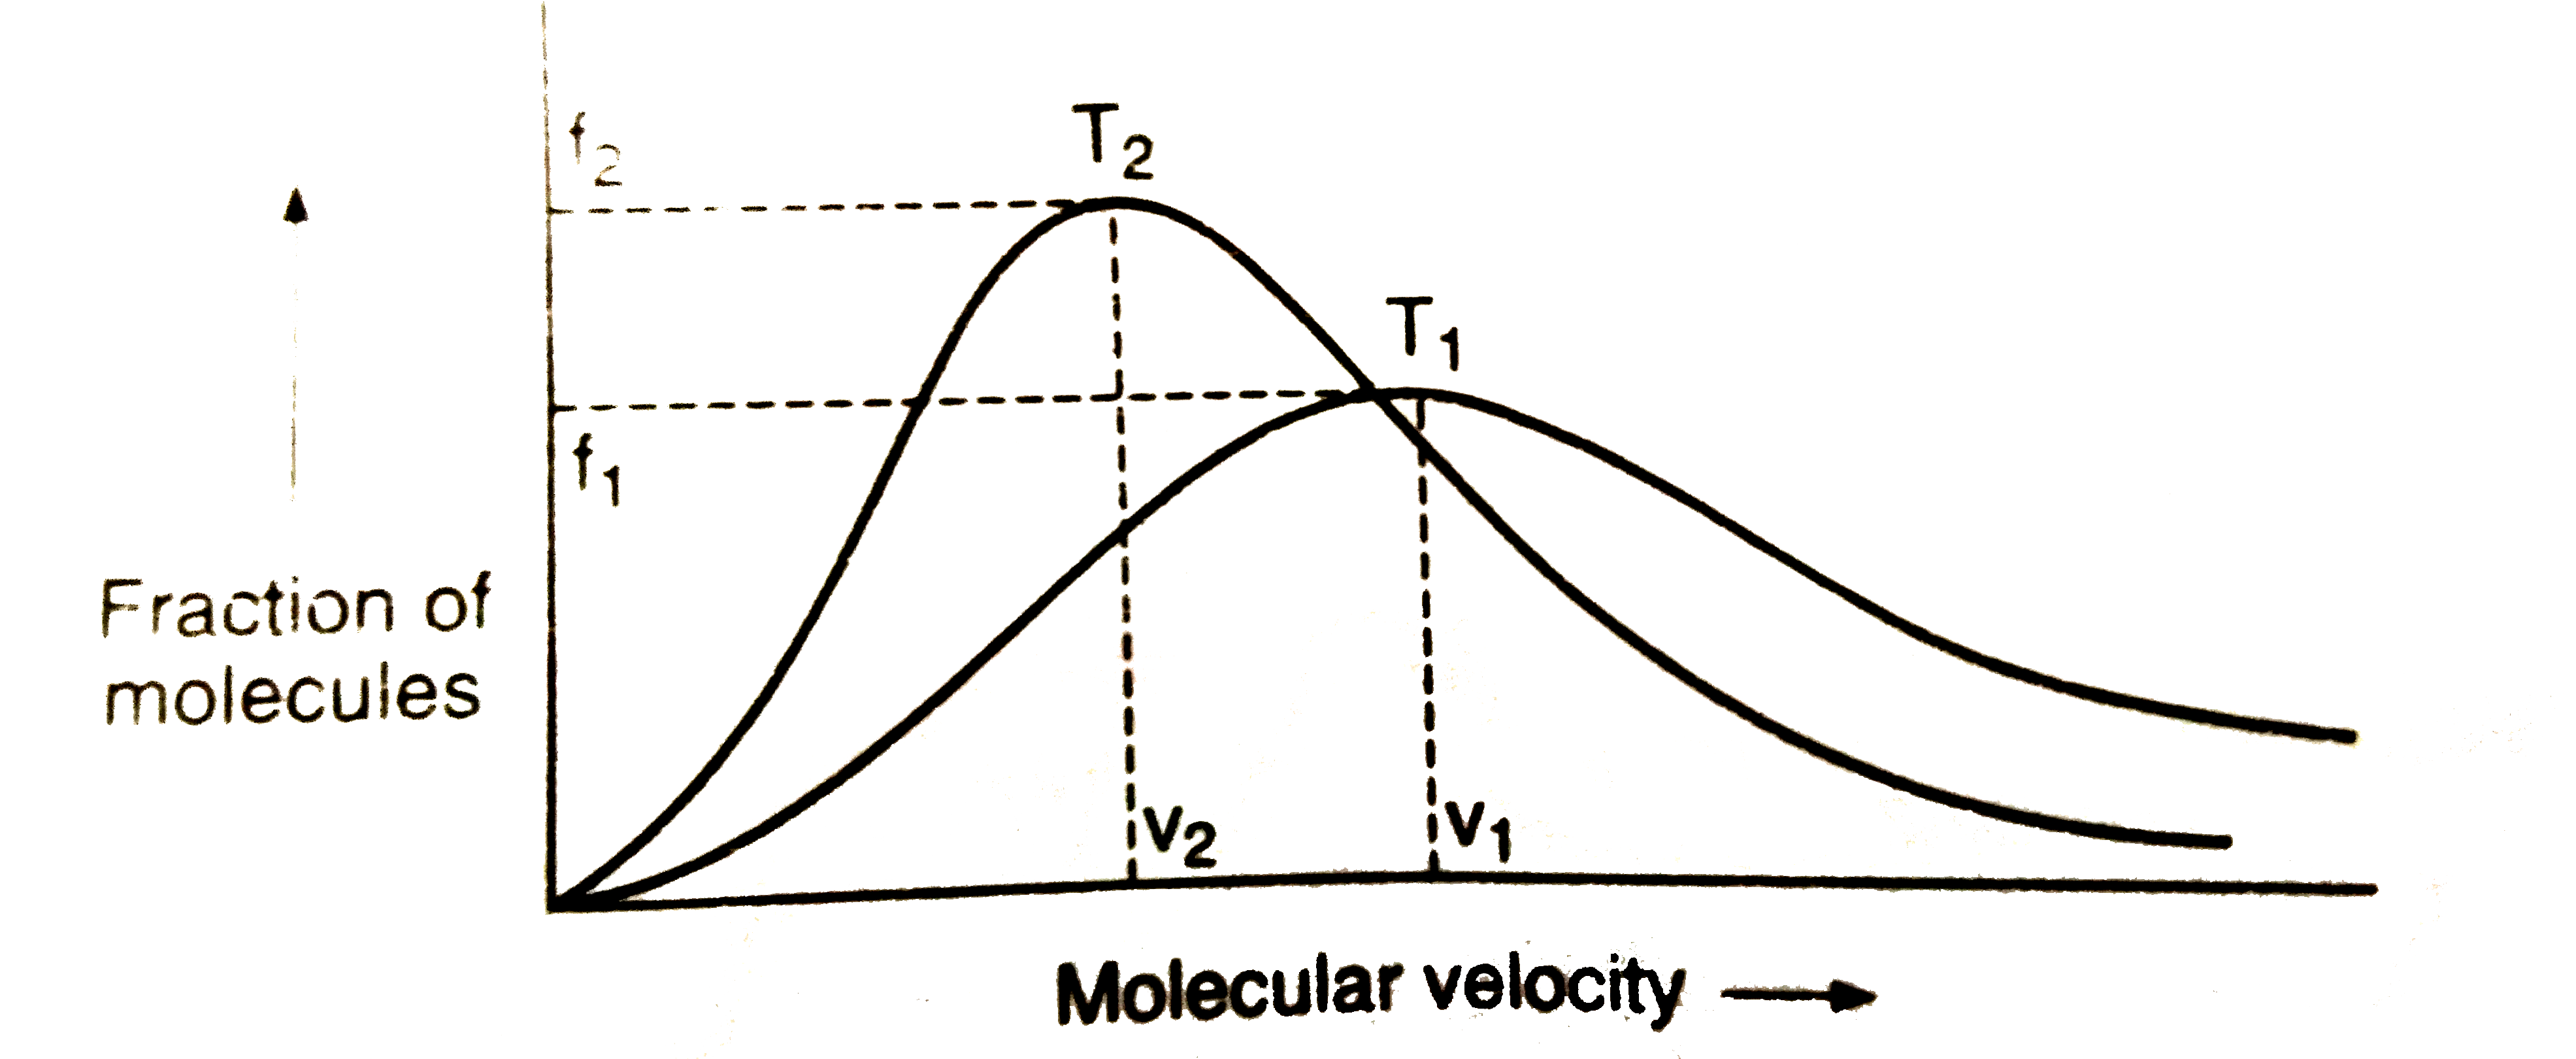
which of following is correct ?
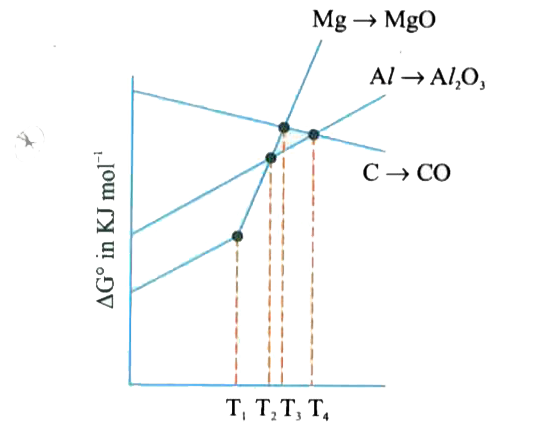
View SolutionEllingham diagram is given below for the formation of some oxides. Then select the correct combination
View SolutionPlot of Maxwell's distribution of velocities is given below:
Which of the following is correct about this plot?
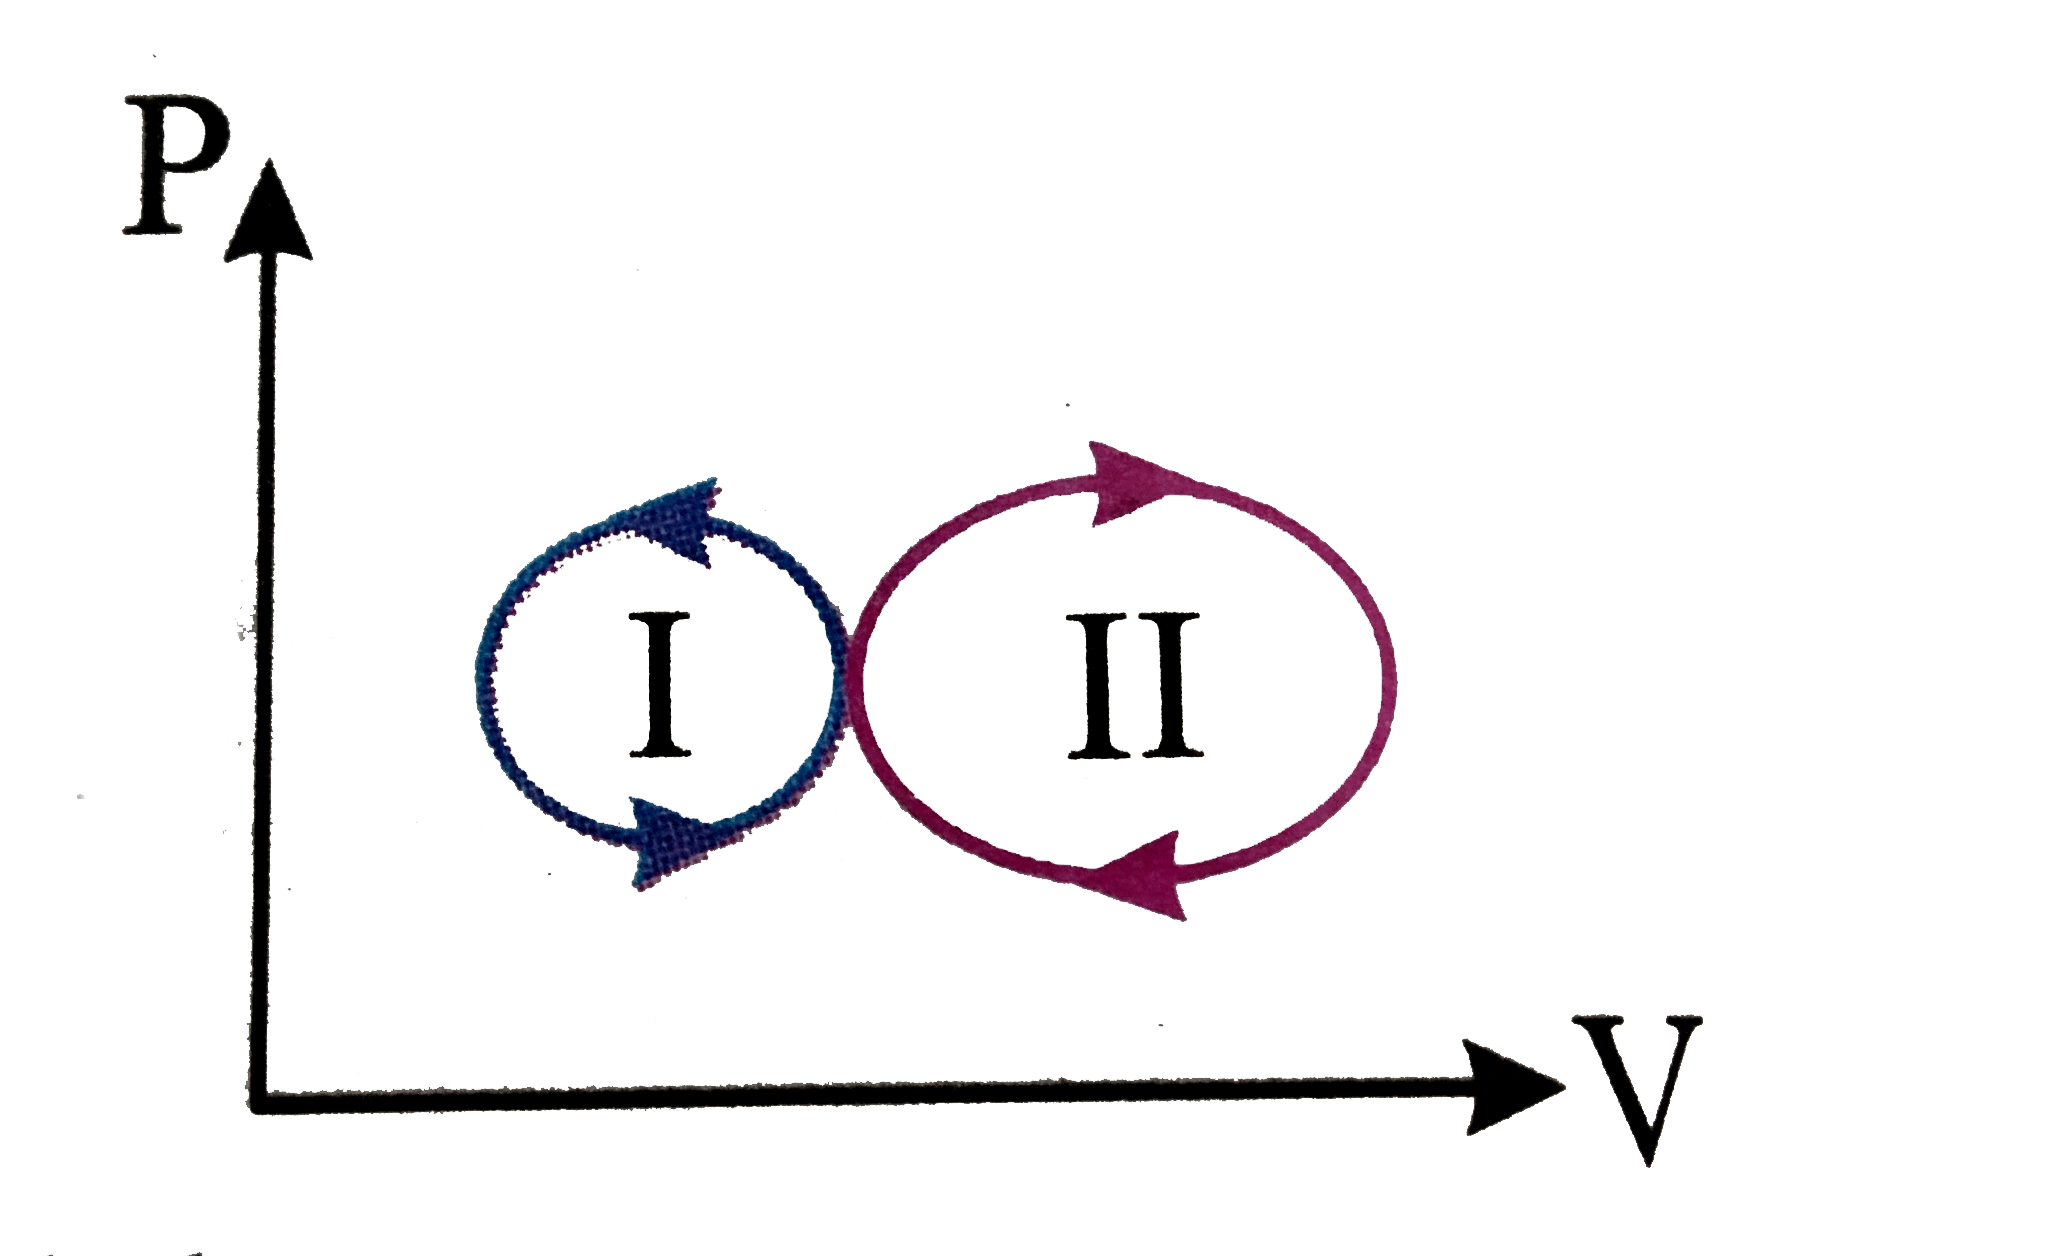
View SolutionSelect the correct statement for diagram below

View SolutionFor the indicator diagram given below, select wrong statement?
View Solution


