Which amongst the following options is correct graphical representation of Boyle's Law?
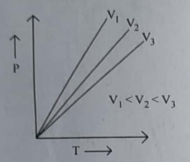
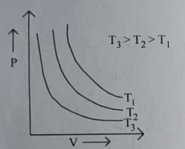
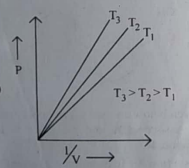
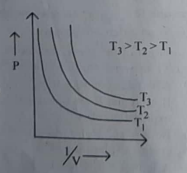
To determine the correct graphical representation of Boyle's Law, let's break down the steps involved in understanding the relationship described by this law.
1. Understand Boyle's Law:
Boyle's Law states that at constant temperature, the pressure (P) of a gas is inversely proportional to its volume (V). This can be mathematically expressed as:
P∝1VorPV=k
where k is a constant for a given amount of gas at a constant temperature.
2. Rearranging the Equation:
From the equation PV=k, we can express pressure in terms of volume:
P=kV
This indicates that if we plot pressure (P) on the y-axis and volume (V) on the x-axis, we will get a hyperbolic curve.
3. Graphical Representation:
However, if we want to express this relationship in terms of 1V (which is the reciprocal of volume), we can rearrange the equation:
P=nRT⋅1V
Here, nRT is a constant at a given temperature.
4. Choosing Axes for the Graph:
In this case, we can plot P (pressure) on the y-axis and 1V (the reciprocal of volume) on the x-axis. The resulting graph will be a straight line, with the slope equal to nRT.
5. Identifying the Correct Graph:
Among the given options, we need to identify the graph where:
- The y-axis represents pressure (P).
- The x-axis represents 1V.
- The graph is a straight line, indicating that pressure increases linearly with 1V at constant temperature.
6. Temperature Representation:
If the graph includes multiple lines, each line represents a different temperature. The line corresponding to a higher temperature will have a greater slope than that of a lower temperature.
7. Conclusion:
After analyzing the options, the correct graphical representation of Boyle's Law is the one that shows pressure on the y-axis and 1V on the x-axis, with straight lines indicating different temperatures.
Boyle's Law states that at constant temperature, the pressure (P) of a gas is inversely proportional to its volume (V). This can be mathematically expressed as:
P∝1VorPV=k
where k is a constant for a given amount of gas at a constant temperature.
From the equation PV=k, we can express pressure in terms of volume:
P=kV
This indicates that if we plot pressure (P) on the y-axis and volume (V) on the x-axis, we will get a hyperbolic curve.
However, if we want to express this relationship in terms of 1V (which is the reciprocal of volume), we can rearrange the equation:
P=nRT⋅1V
Here, nRT is a constant at a given temperature.
In this case, we can plot P (pressure) on the y-axis and 1V (the reciprocal of volume) on the x-axis. The resulting graph will be a straight line, with the slope equal to nRT.
Among the given options, we need to identify the graph where:
- The y-axis represents pressure (P).
- The x-axis represents 1V.
- The graph is a straight line, indicating that pressure increases linearly with 1V at constant temperature.
If the graph includes multiple lines, each line represents a different temperature. The line corresponding to a higher temperature will have a greater slope than that of a lower temperature.
After analyzing the options, the correct graphical representation of Boyle's Law is the one that shows pressure on the y-axis and 1V on the x-axis, with straight lines indicating different temperatures.
Topper's Solved these Questions
Similar Questions
Knowledge Check
Select the correct graphical representation :
A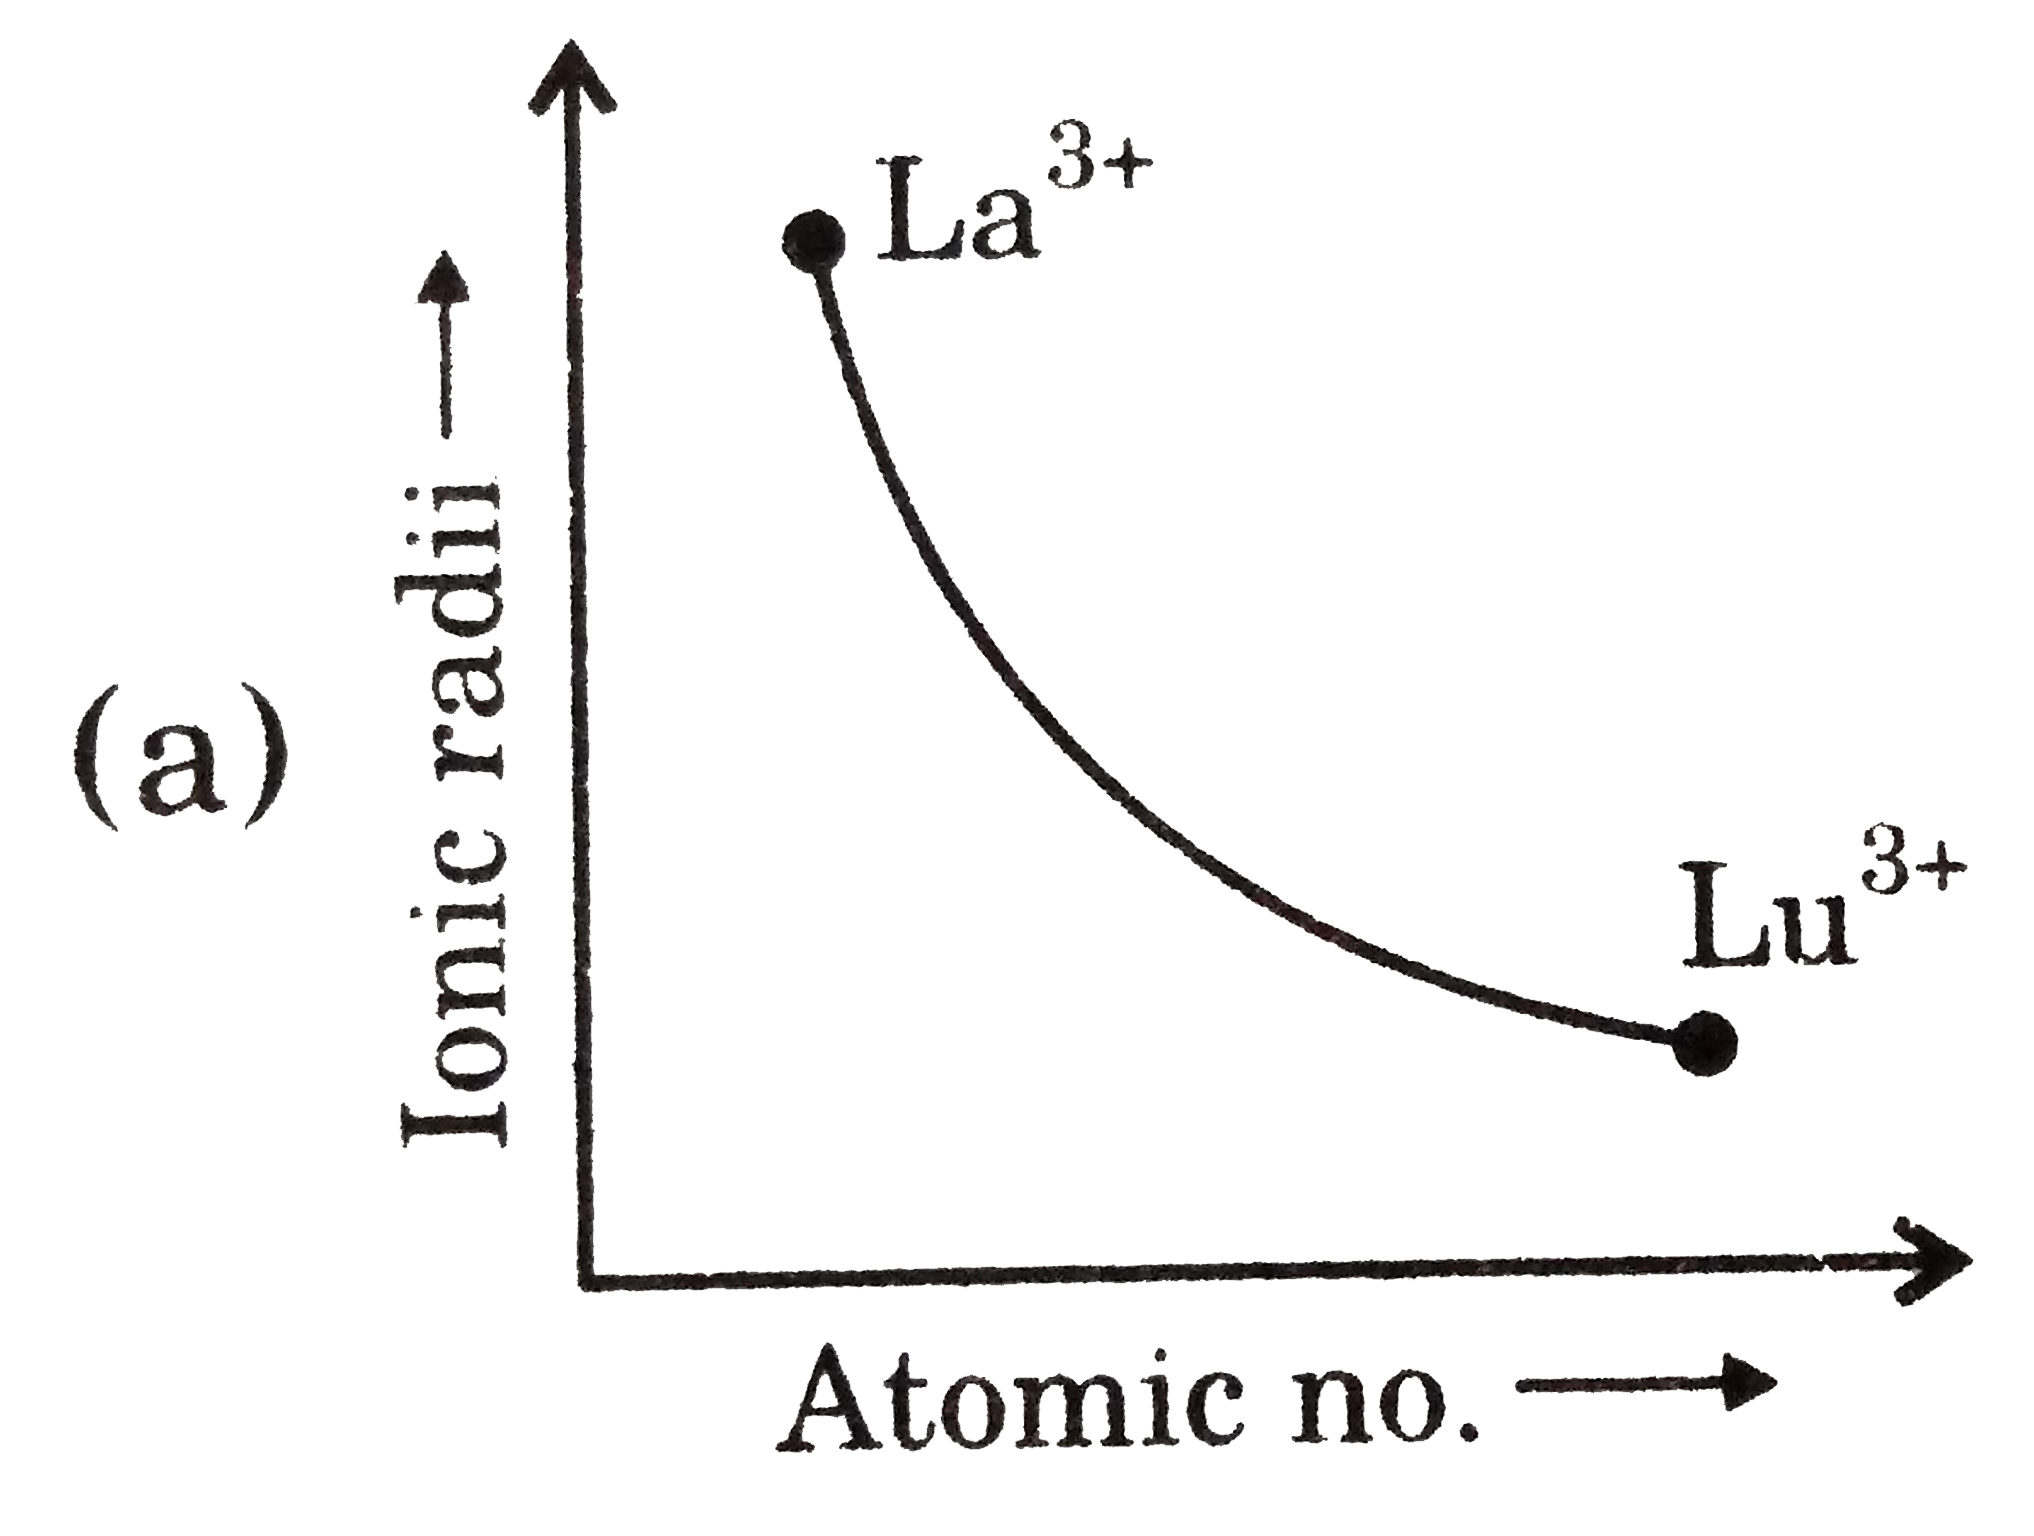 B
B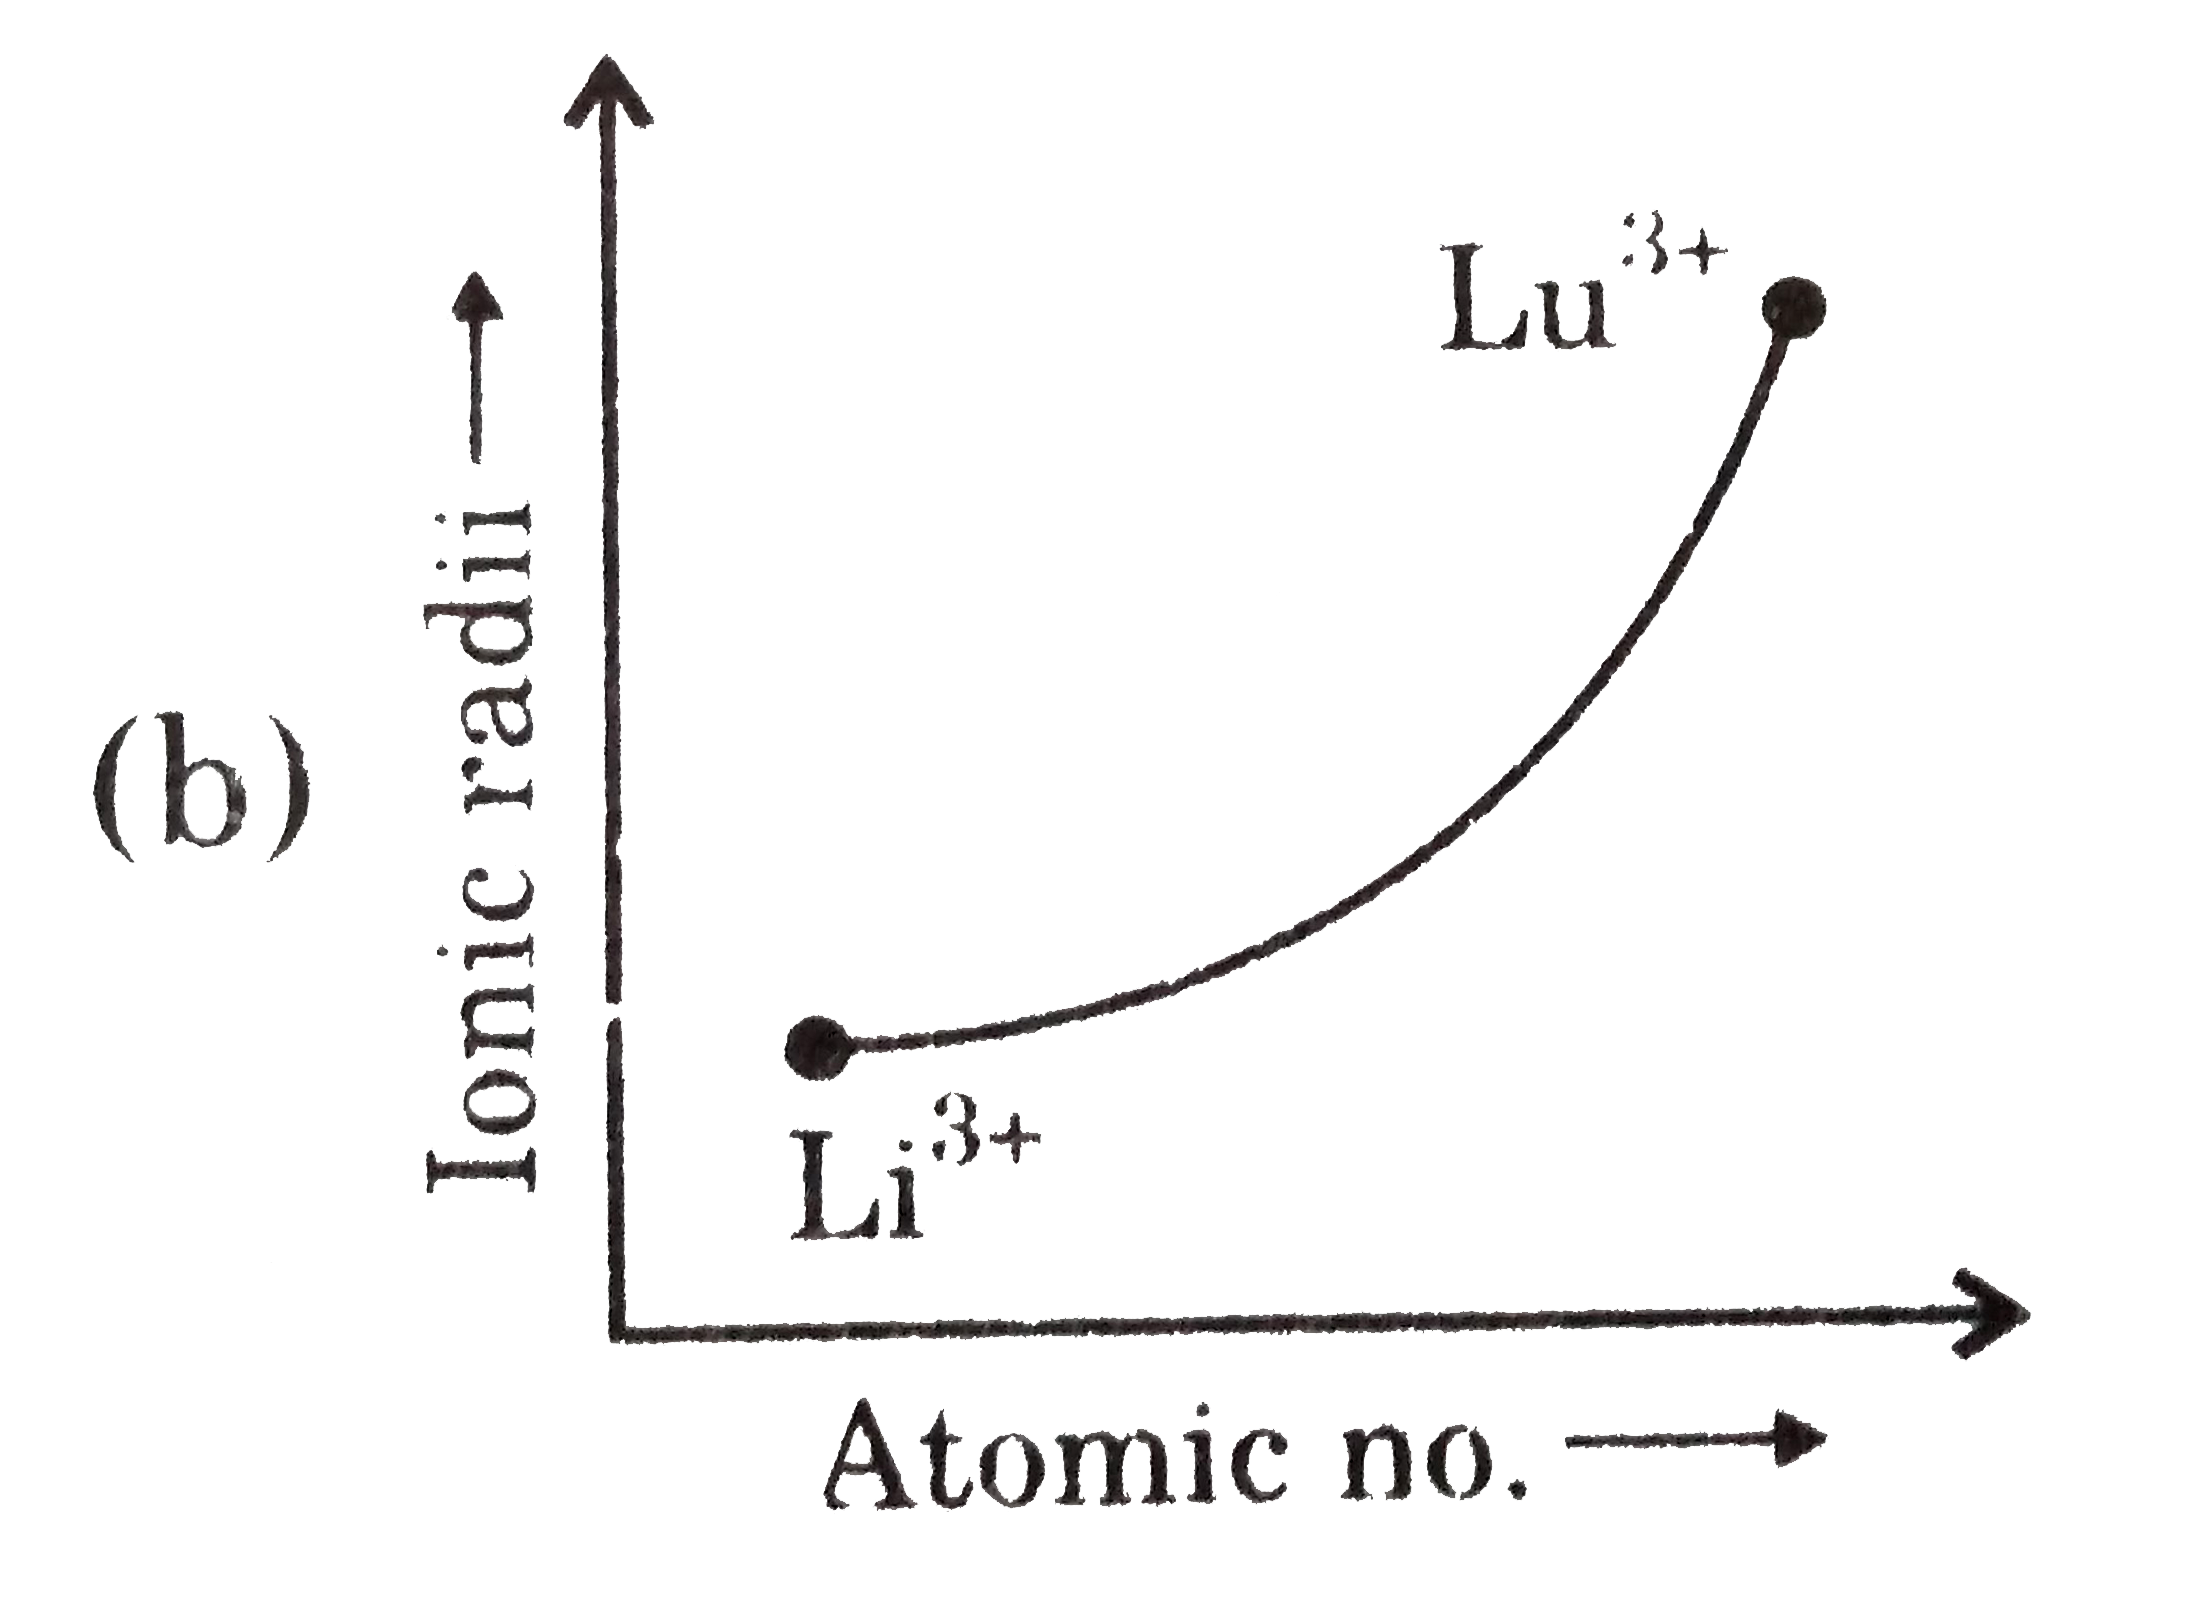 C
C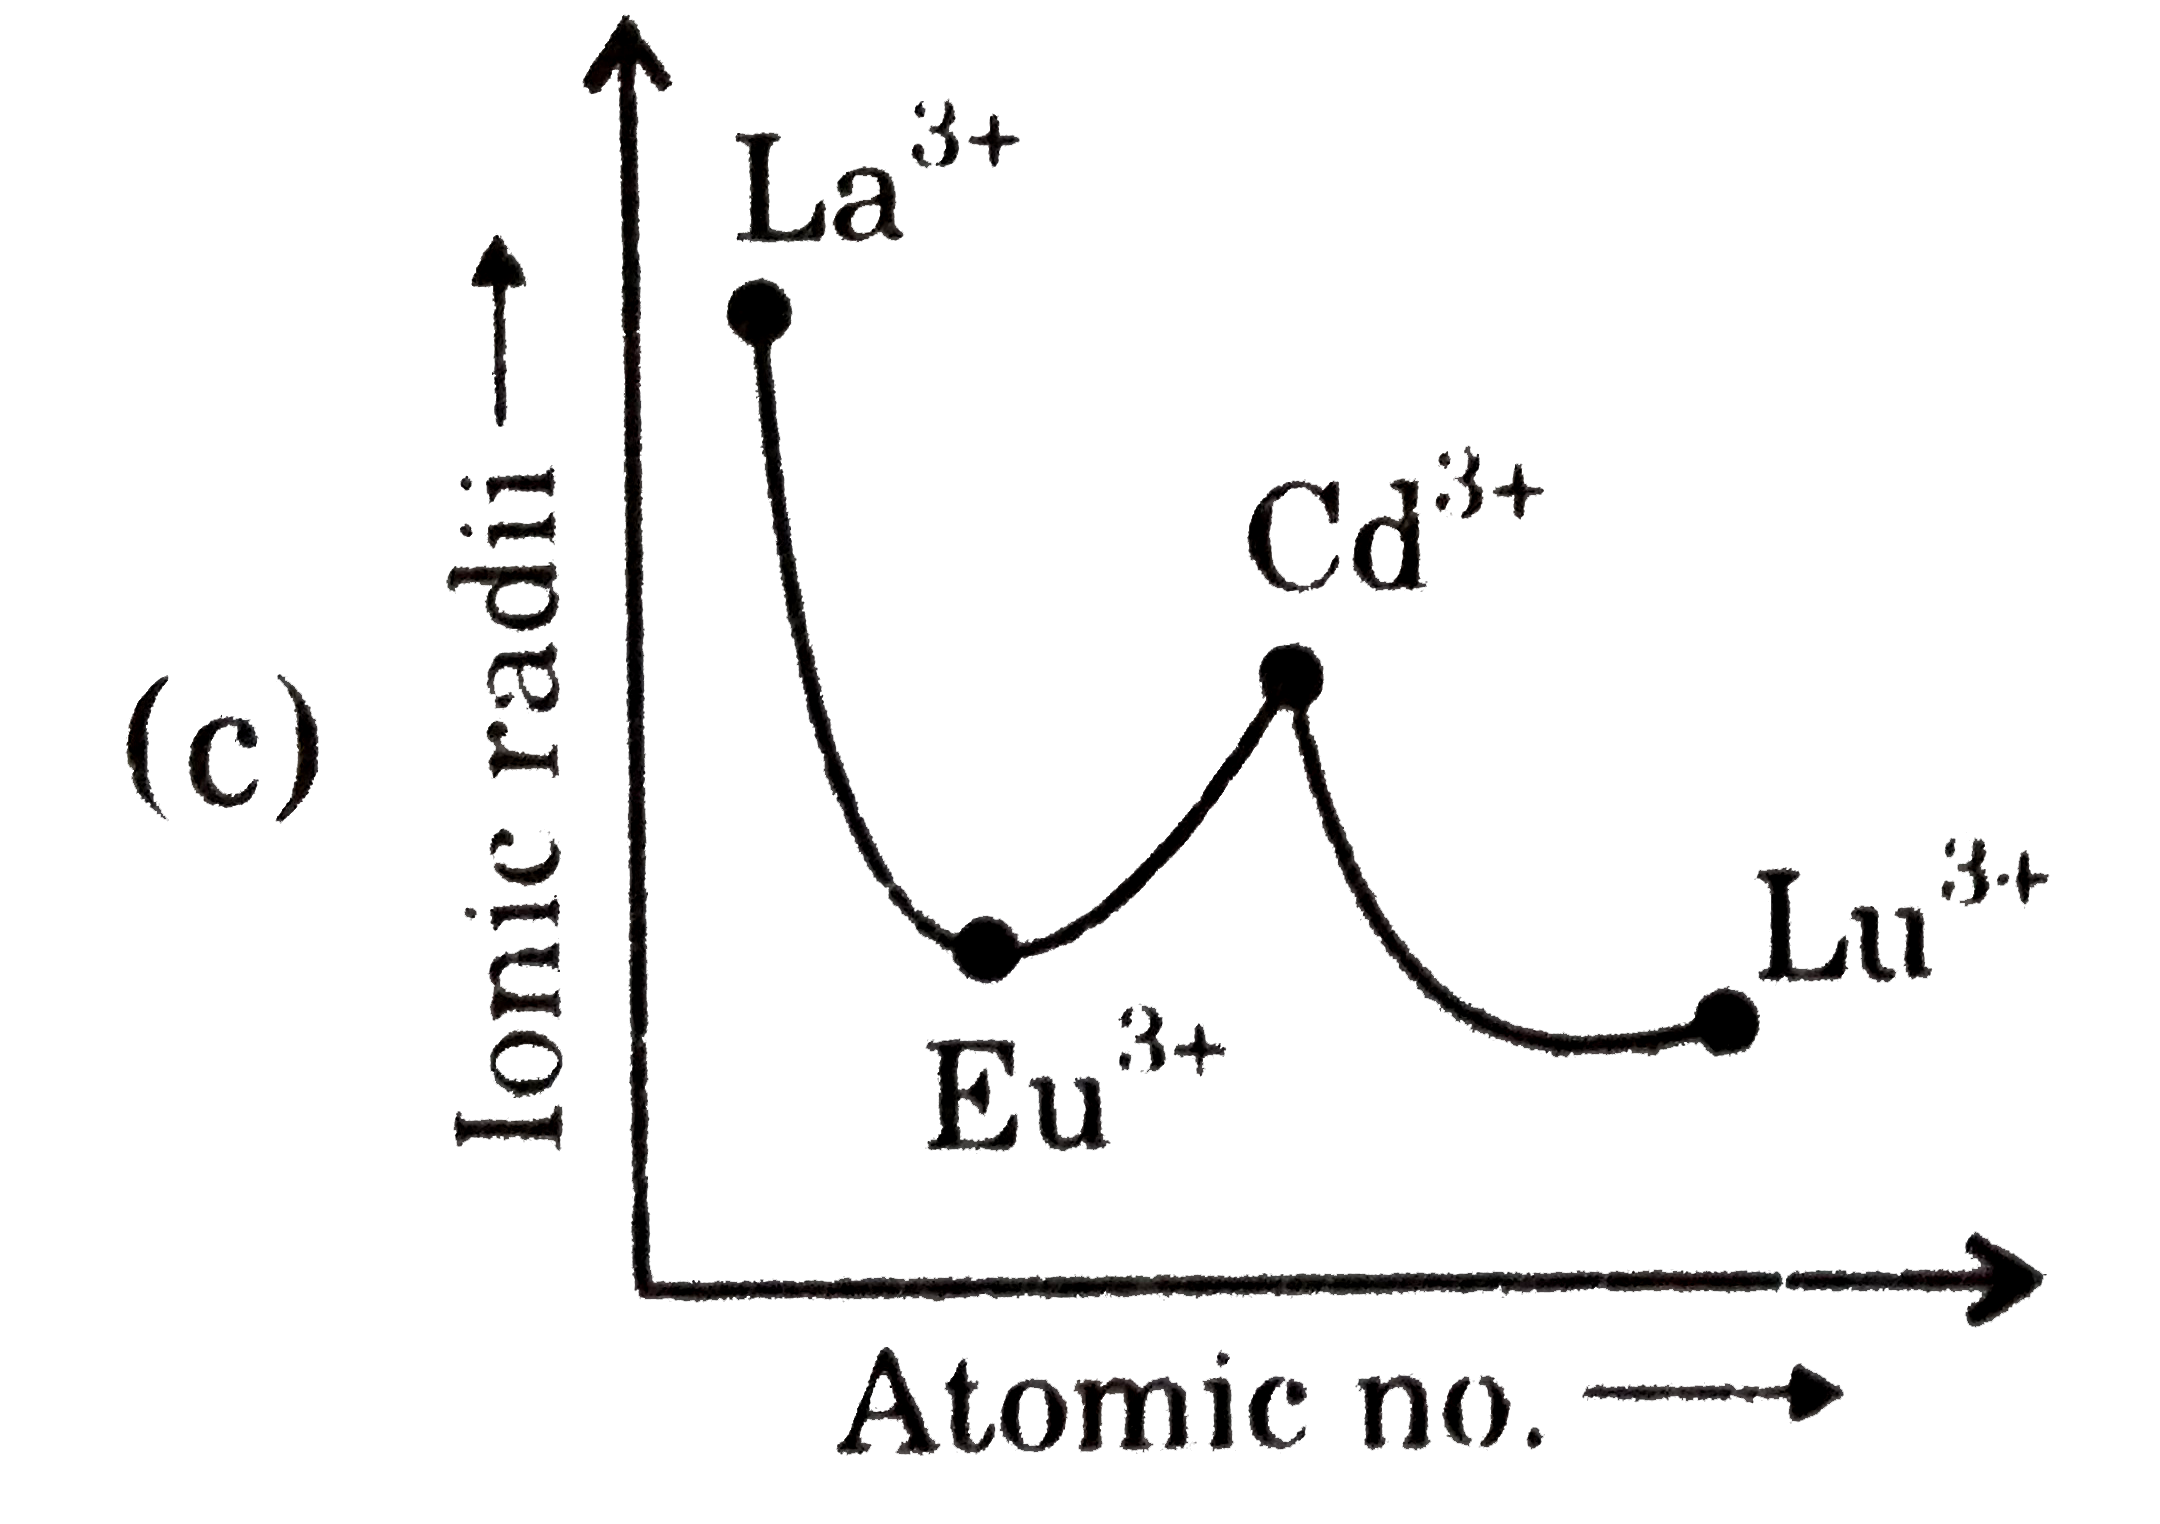 D
D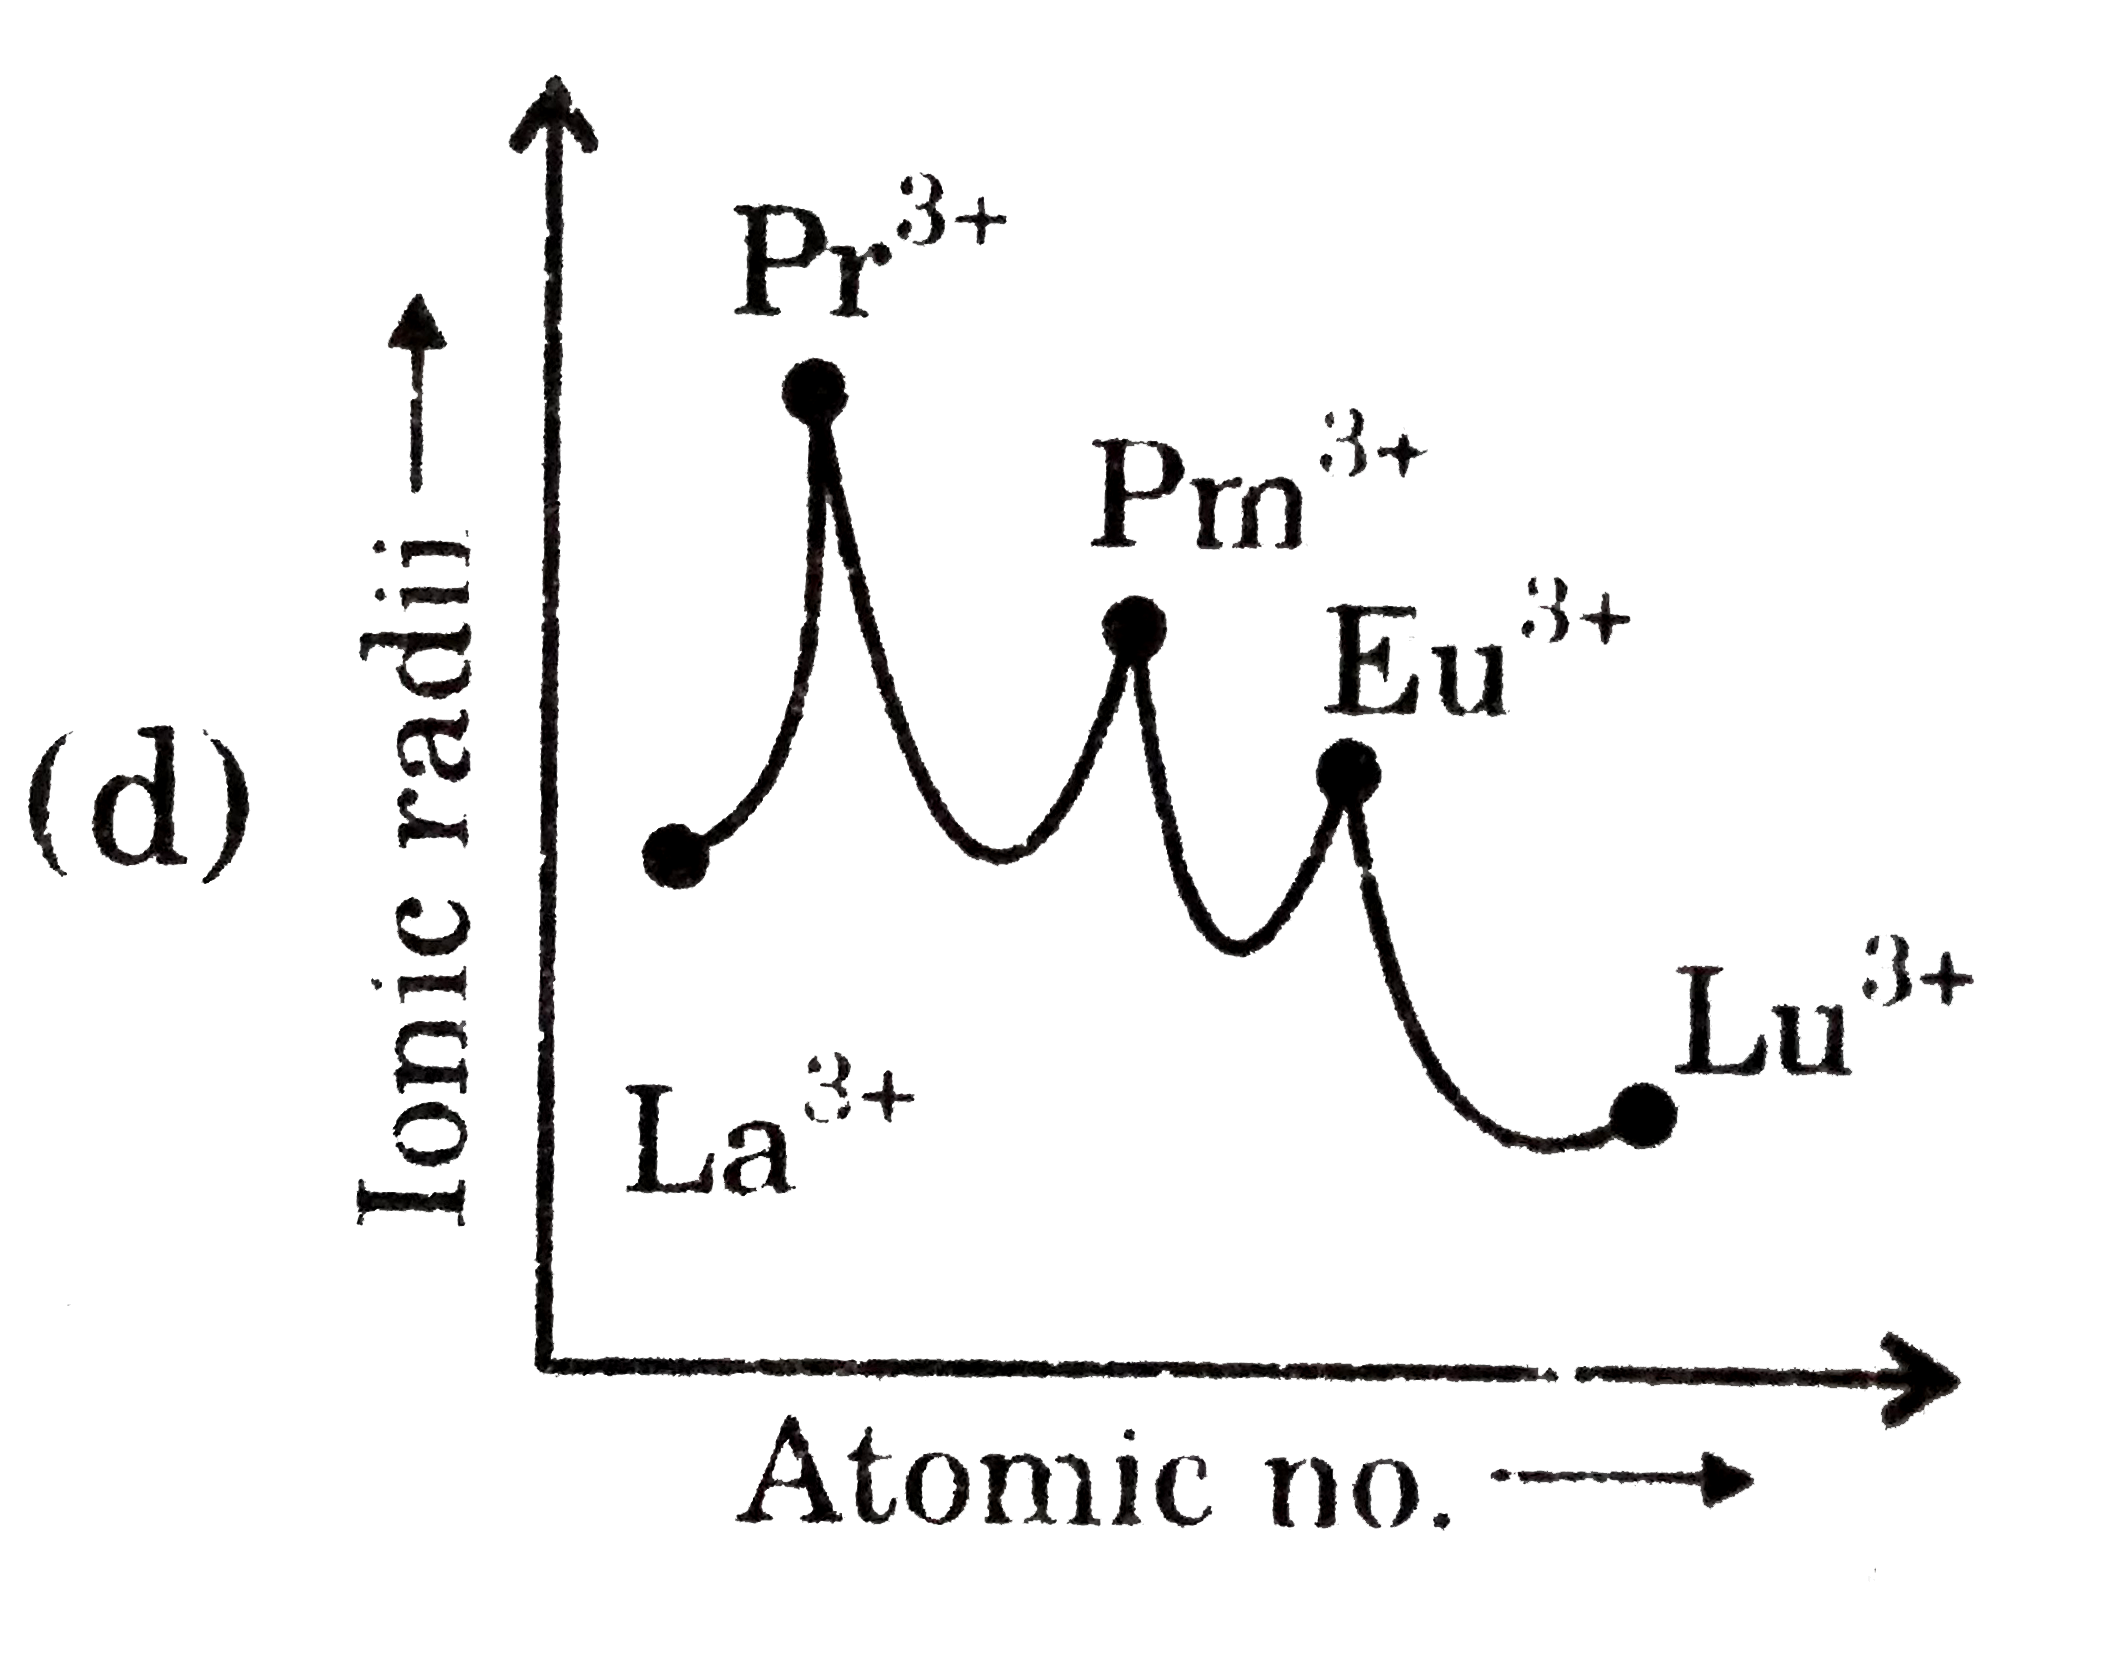
Which among the following is the correct mathematical representation of Dalton's law of partial pressures?
APr=x1P∘1+x2P∘2BPT=P∘1+(P∘2−P∘1)x2CPT=(1−x2)P∘1+x2P∘2DAll of theseEquation of Boyle's law is
AdPP=dVVBdPP=dVVCd2PP=dVVDd2PP=+dVV
Graphical Representation For Motion
View SolutionGraphical representation of cartesian product
View SolutionWhich of the following option given below is correct representation of net filtration pressure?
View SolutionEllingham diagram is a graphical representation of :
View SolutionWhich of the following option is /are the correct representation of the formula for the compoud CaCl2 ?
View Solution
