Graph of maximum possible K.E. of photo-electron and frequency of incident photons is as shown in figure. Find slope of graph.
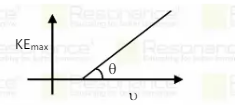
h/e
h
e/h
1/h
The correct Answer is:B
Topper's Solved these Questions
Similar Questions
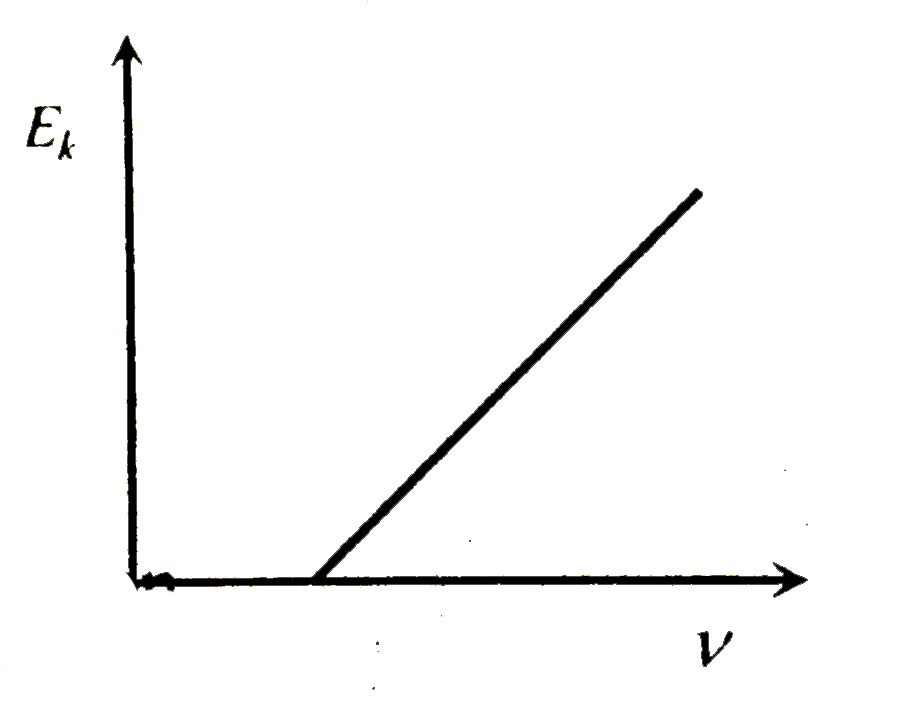
For the photoelectric effect, the maximum kinetic energy Ek of the emitted photoelectrons is plotted against the frequency of the incident photons as shown in the figure. The slope of the curve gives
View SolutionPlot a labelled graph of maximum kinetic energy of photo electrons versus frequency of incident radiation. State how you will obtain the value of Planck.s constant h from the graph.
View Solution
Knowledge Check
For the photoelectric effect, the maximum kinetic energy Ek of the emitted photoelectrons is plotted against the frequency of the incident photons as shown in the figure. The slope of the curve gives
 Acharge of the electronBwork function of the metalCPlank's constantDratio of the Plank's constant to electronic charge
For the photoelectric effect, the maximum kinetic energy Ek of the emitted photoelectrons is plotted against the frequency ν of the incident photons as shown in the figure. The slope of the curve gives
 ACharge of the electronBWork function of the metalCPlanck's constantDRatio of the Planck’s constant to electronic charge
Initially, energy of incident photon was double of the work function of metal in a photoelectric effect. Finally energy of incident photon made 10 times of the work function. The ratio of maximum possible speed of photo electrons in initial & final case is αβ. Then find minimum value of α :
A2B1C4D3
A graph regarding photoelectric effect is shown between the maximum kinetic energy of electrons and the frequency of the incident light. On the basis of data as shown in the graph, calculate (a) threshold frequency , (b) work- function, (c ) planck constant
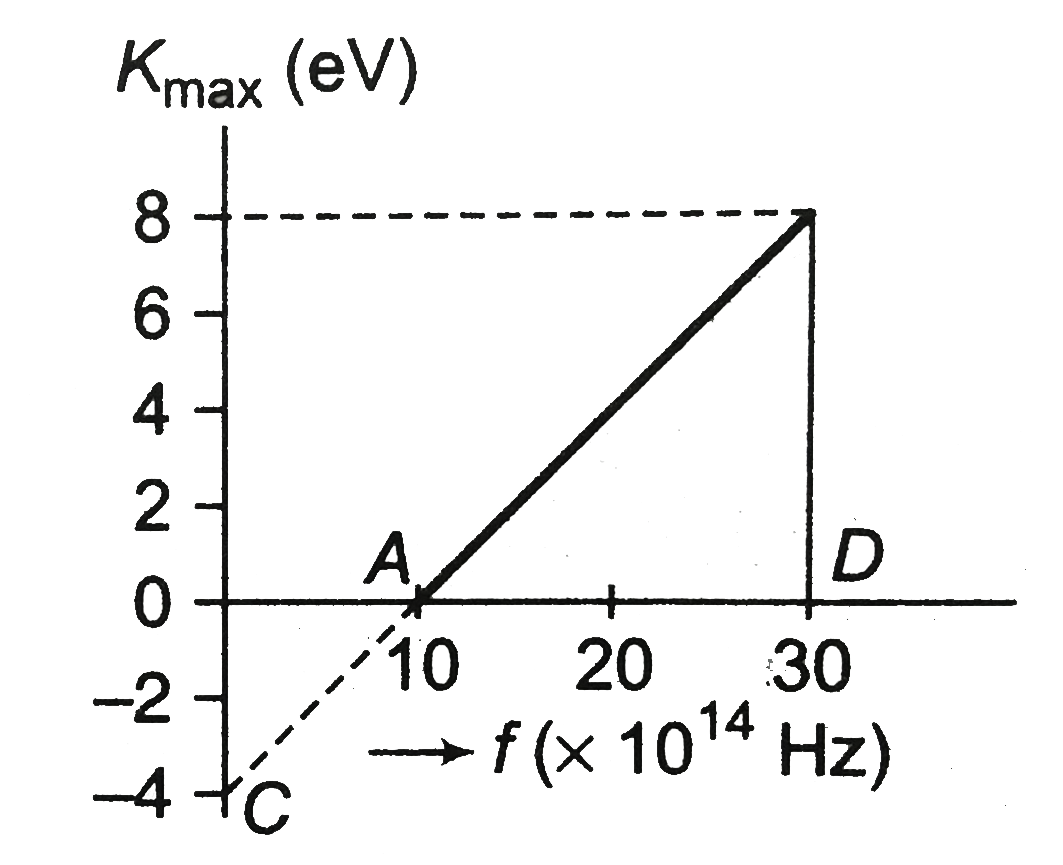
View SolutionA graph regarding photoelectric effect is shown between the maximum kinetic energy of electrons and the frequency of the incident light. On the basis of data as shown in the graph, calculate (a) threshold frequency , (b) work- function, (c ) planck constant

View SolutionIn an experiment of photo-electric effect, the graph of maximum kinetic energy Ek of the emitted photoelectrons versus the frequency v of the incident light is a straight line AB as shown in figure below :
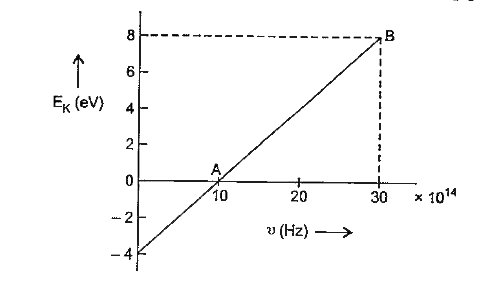
Threshold frequency of the metal.
View SolutionIn an experiment of photo-electric effect, the graph of maximum kinetic energy Ek of the emitted photoelectrons versus the frequency v of the incident light is a straight line AB as shown in figure below :
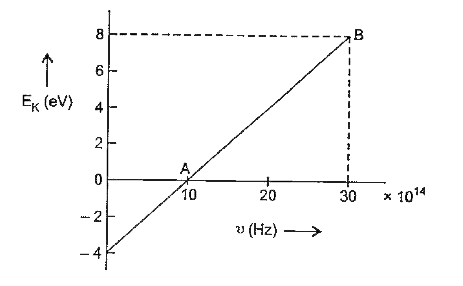
Work function of the metal.
View SolutionIn an experiment of photo-electric effect, the graph of maximum kinetic energy Ek of the emitted photoelectrons versus the frequency v of the incident light is a straight line AB as shown in figure below :
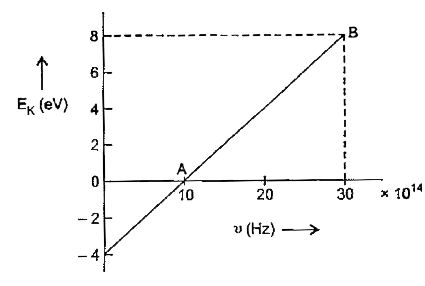
Stopping potential for the photoelectrons emitted by the light of frequency
v=30×1014Hz
View Solution
