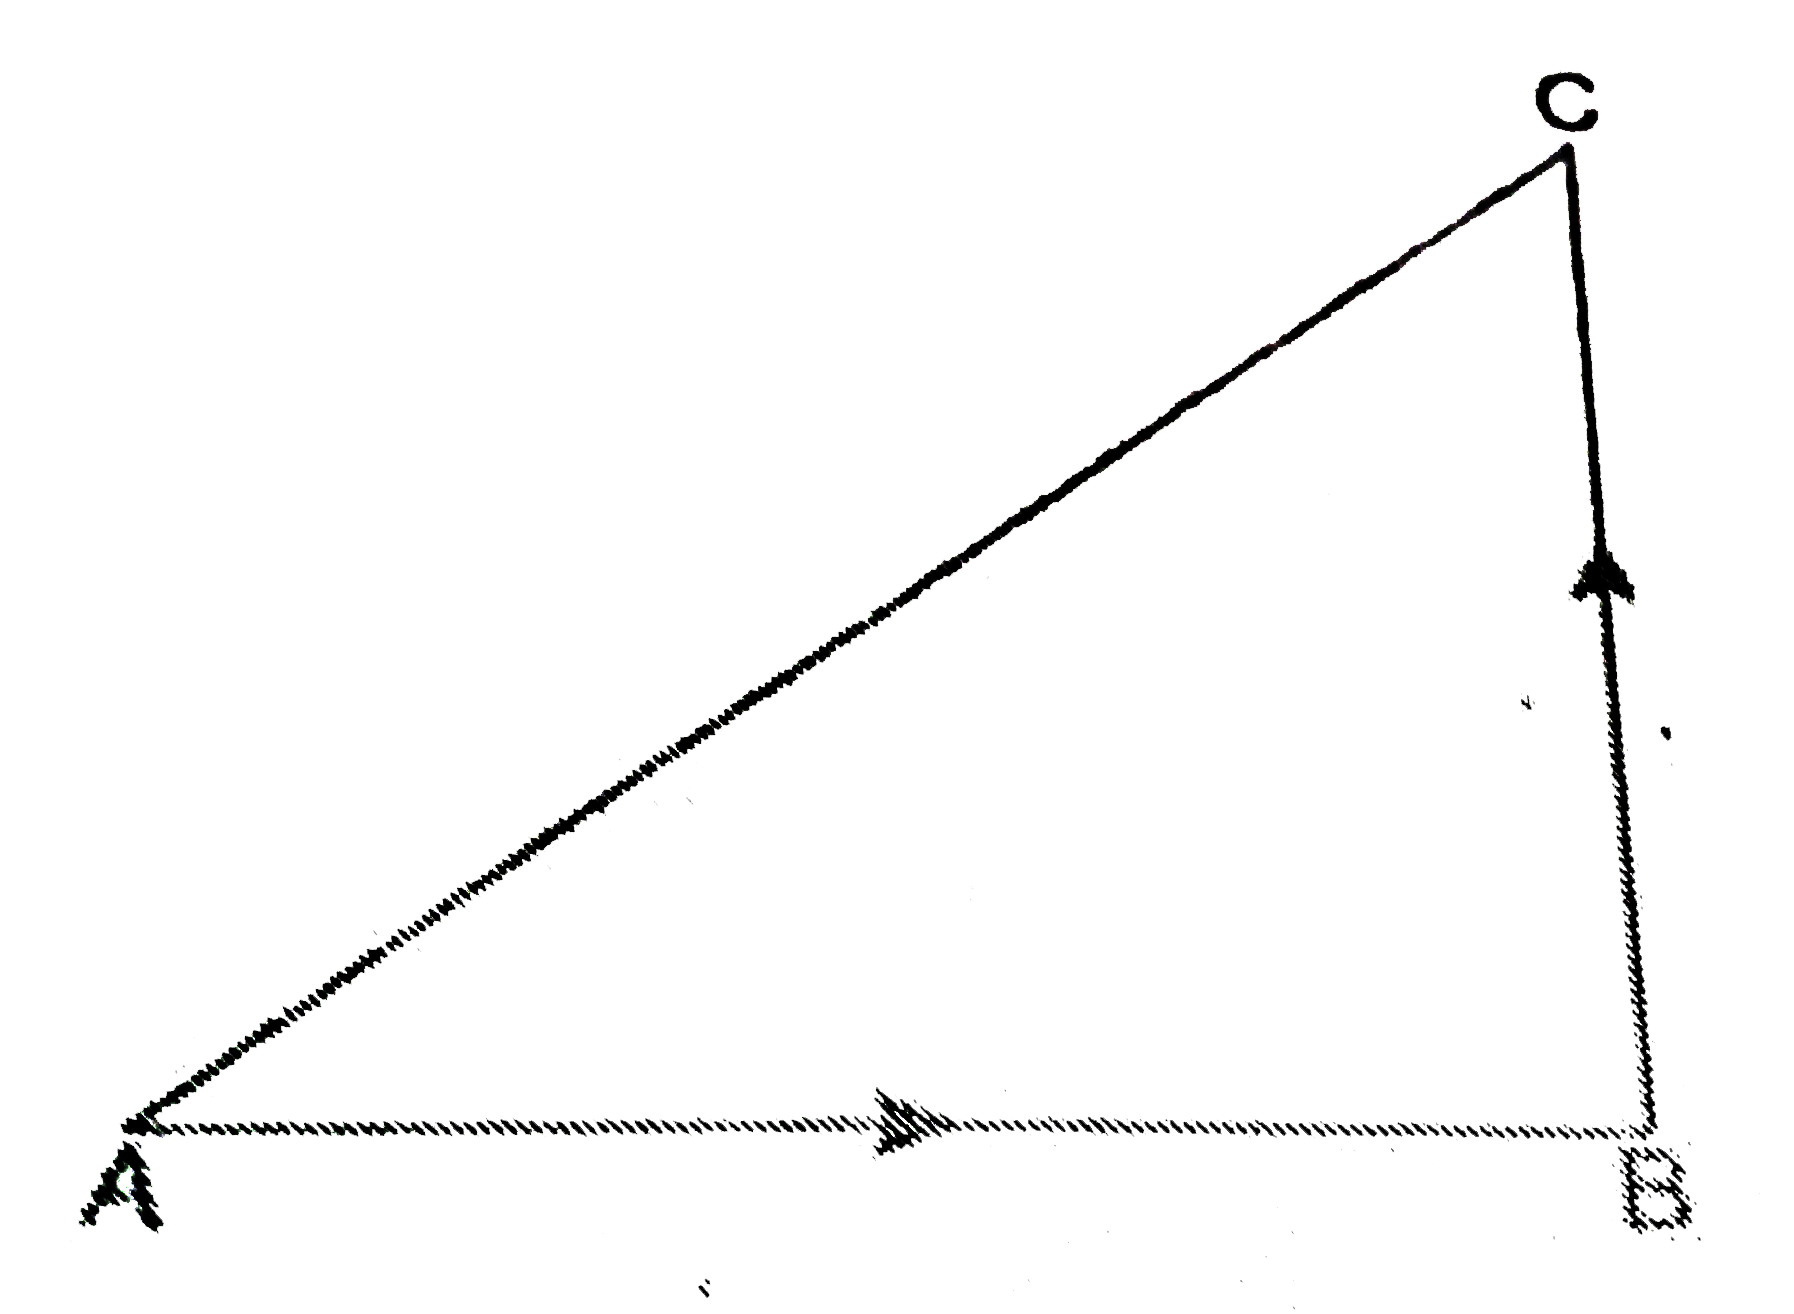
(a) निम्न चित्र में त्रिभुज ABC में सदिश −−→AB तथा −−→BC का योगफल ज्ञात कीजिए।

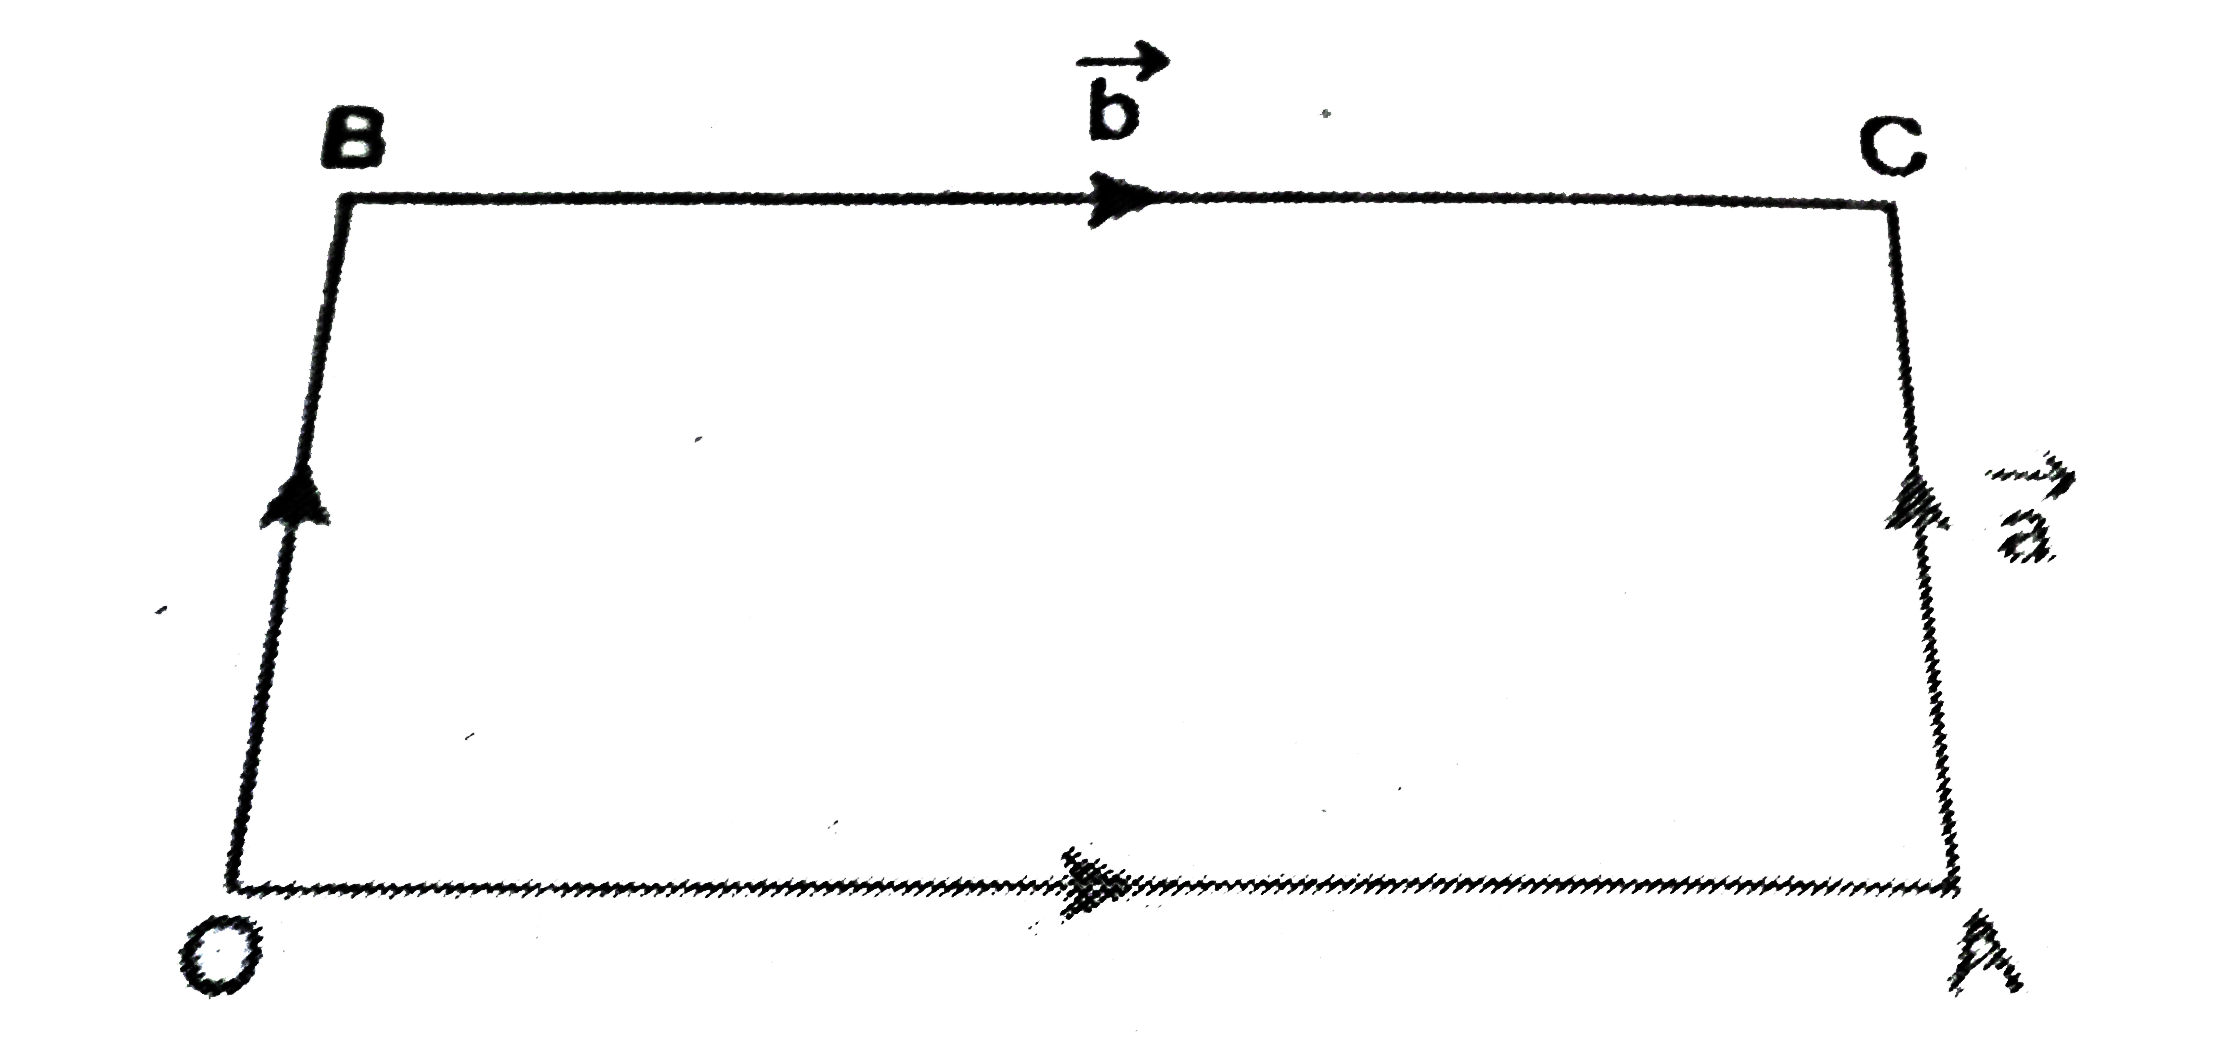
(b) निम्न चित्र में −−→OA+−−→OB ज्ञात कीजिए।

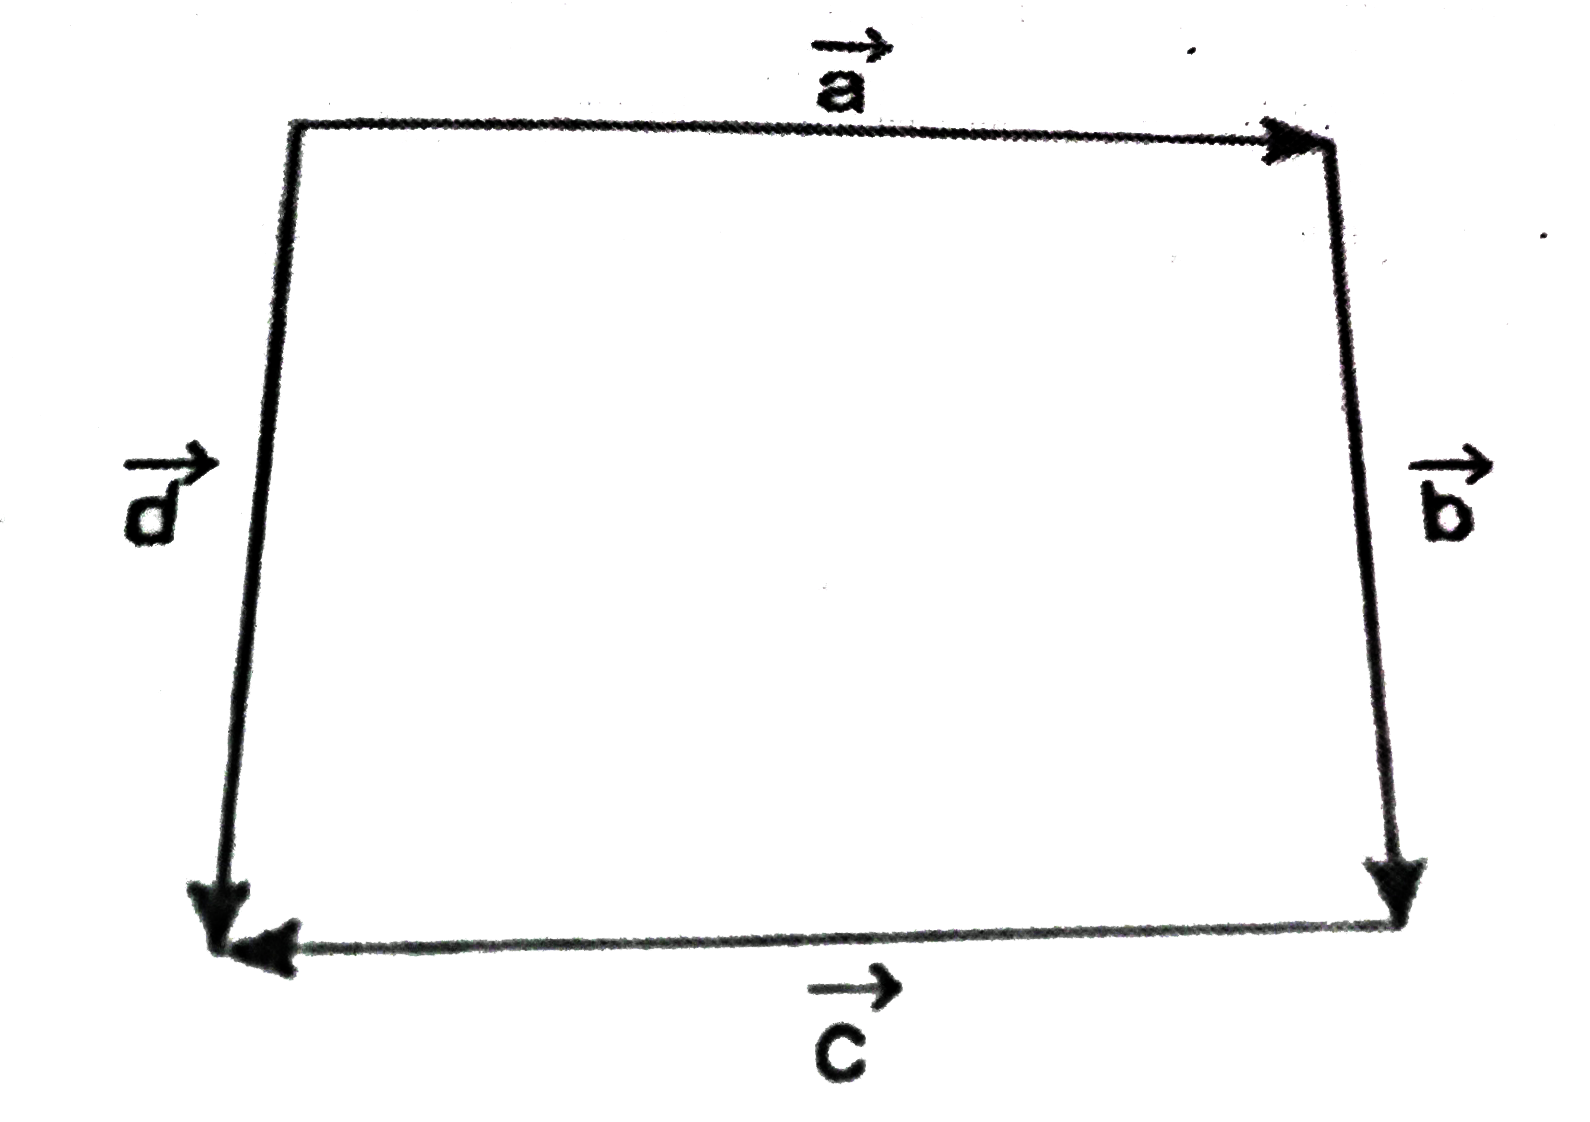
(c) ΔABC में क्रमशः −−→AB,−−→BC,−−→CA से निरूपित सदिशों का योग कितना है?
Step by step video & image solution for (a) निम्न चित्र में त्रिभुज ABC में सदिश vec(AB) तथा vec(BC) का योगफल ज्ञात कीजिए। (b) निम्न चित्र में vec(OA)+vec(OB) ज्ञात कीजिए। (c) DeltaABC में क्रमशः vec(AB),vec(BC),vec(CA) से निरूपित सदिशों का योग कितना है? by Maths experts to help you in doubts & scoring excellent marks in Class 12 exams.
Topper's Solved these Questions
- BOOK - MANOHAR RAYCHAPTER - सदिश बीजगणित EXERCISE - प्रश्नावली 10(C)33videos
सदिश बीजगणित
- BOOK - MANOHAR RAYCHAPTER - सदिश बीजगणित EXERCISE - प्रश्नावली 10(D)21videos
सदिश बीजगणित
- BOOK - MANOHAR RAYCHAPTER - सदिश बीजगणित EXERCISE - प्रश्नावली 10 (A)1videos
सदिश बीजगणित
- BOOK - MANOHAR RAYCHAPTER - सततता तथा अवकलनीयता EXERCISE - इंजीनियरिंग परीक्षाओ के प्रश्न7videos
सततता तथा अवकलनीयता
- BOOK - MANOHAR RAYCHAPTER - समाकलनEXERCISE - प्रश्नावली 7(Z)40videos
समाकलन
Similar Questions
सदिशों ˆi−2ˆj+ˆk और 3ˆi−2ˆj−3ˆk के योग तथा अन्तर ज्ञात कीजिए।
01:37View Solution(→a+3→b).(2→a−→b) ज्ञात कीजिए यदि →a=ˆi+ˆj+2ˆk तथा →b=2ˆi+2ˆj−ˆk.
06:07View Solutionदी गई आकृति में निम्न सदिशों को पहचानिए-
(i) सह-आदिम (ii) समान (iii) संरेख परन्तु असमान
 02:11View Solution
limx→0sin(πcos2x)x2 का मान है ।
01:31View Solution∫x0dx का मान होगा
02:45View SolutionHow many lines of symmetry does the above figure have ?
02:17View SolutionWhich of the following are correct chain isomers of butane ? (i)
05:41View SolutionDetermine the point of symmetry of a regular hexagon.
02:10View SolutionDtermine the images of the following figure about the given line :
02:17View SolutionMatch the following Column A to Column B
 02:10View Solution
Match the following Column A to Column B
 04:23View Solution
Match the following Column A to Column B
 01:19View Solution
The inequation represented by the graph given below is :
01:46View SolutionThe inequation that best describes the graph given below is _________
03:10View SolutionThe inequation that best describes the following graph is _________
01:45View SolutionWhich inequations represent the shaded region in the given figure
01:49View Solution

