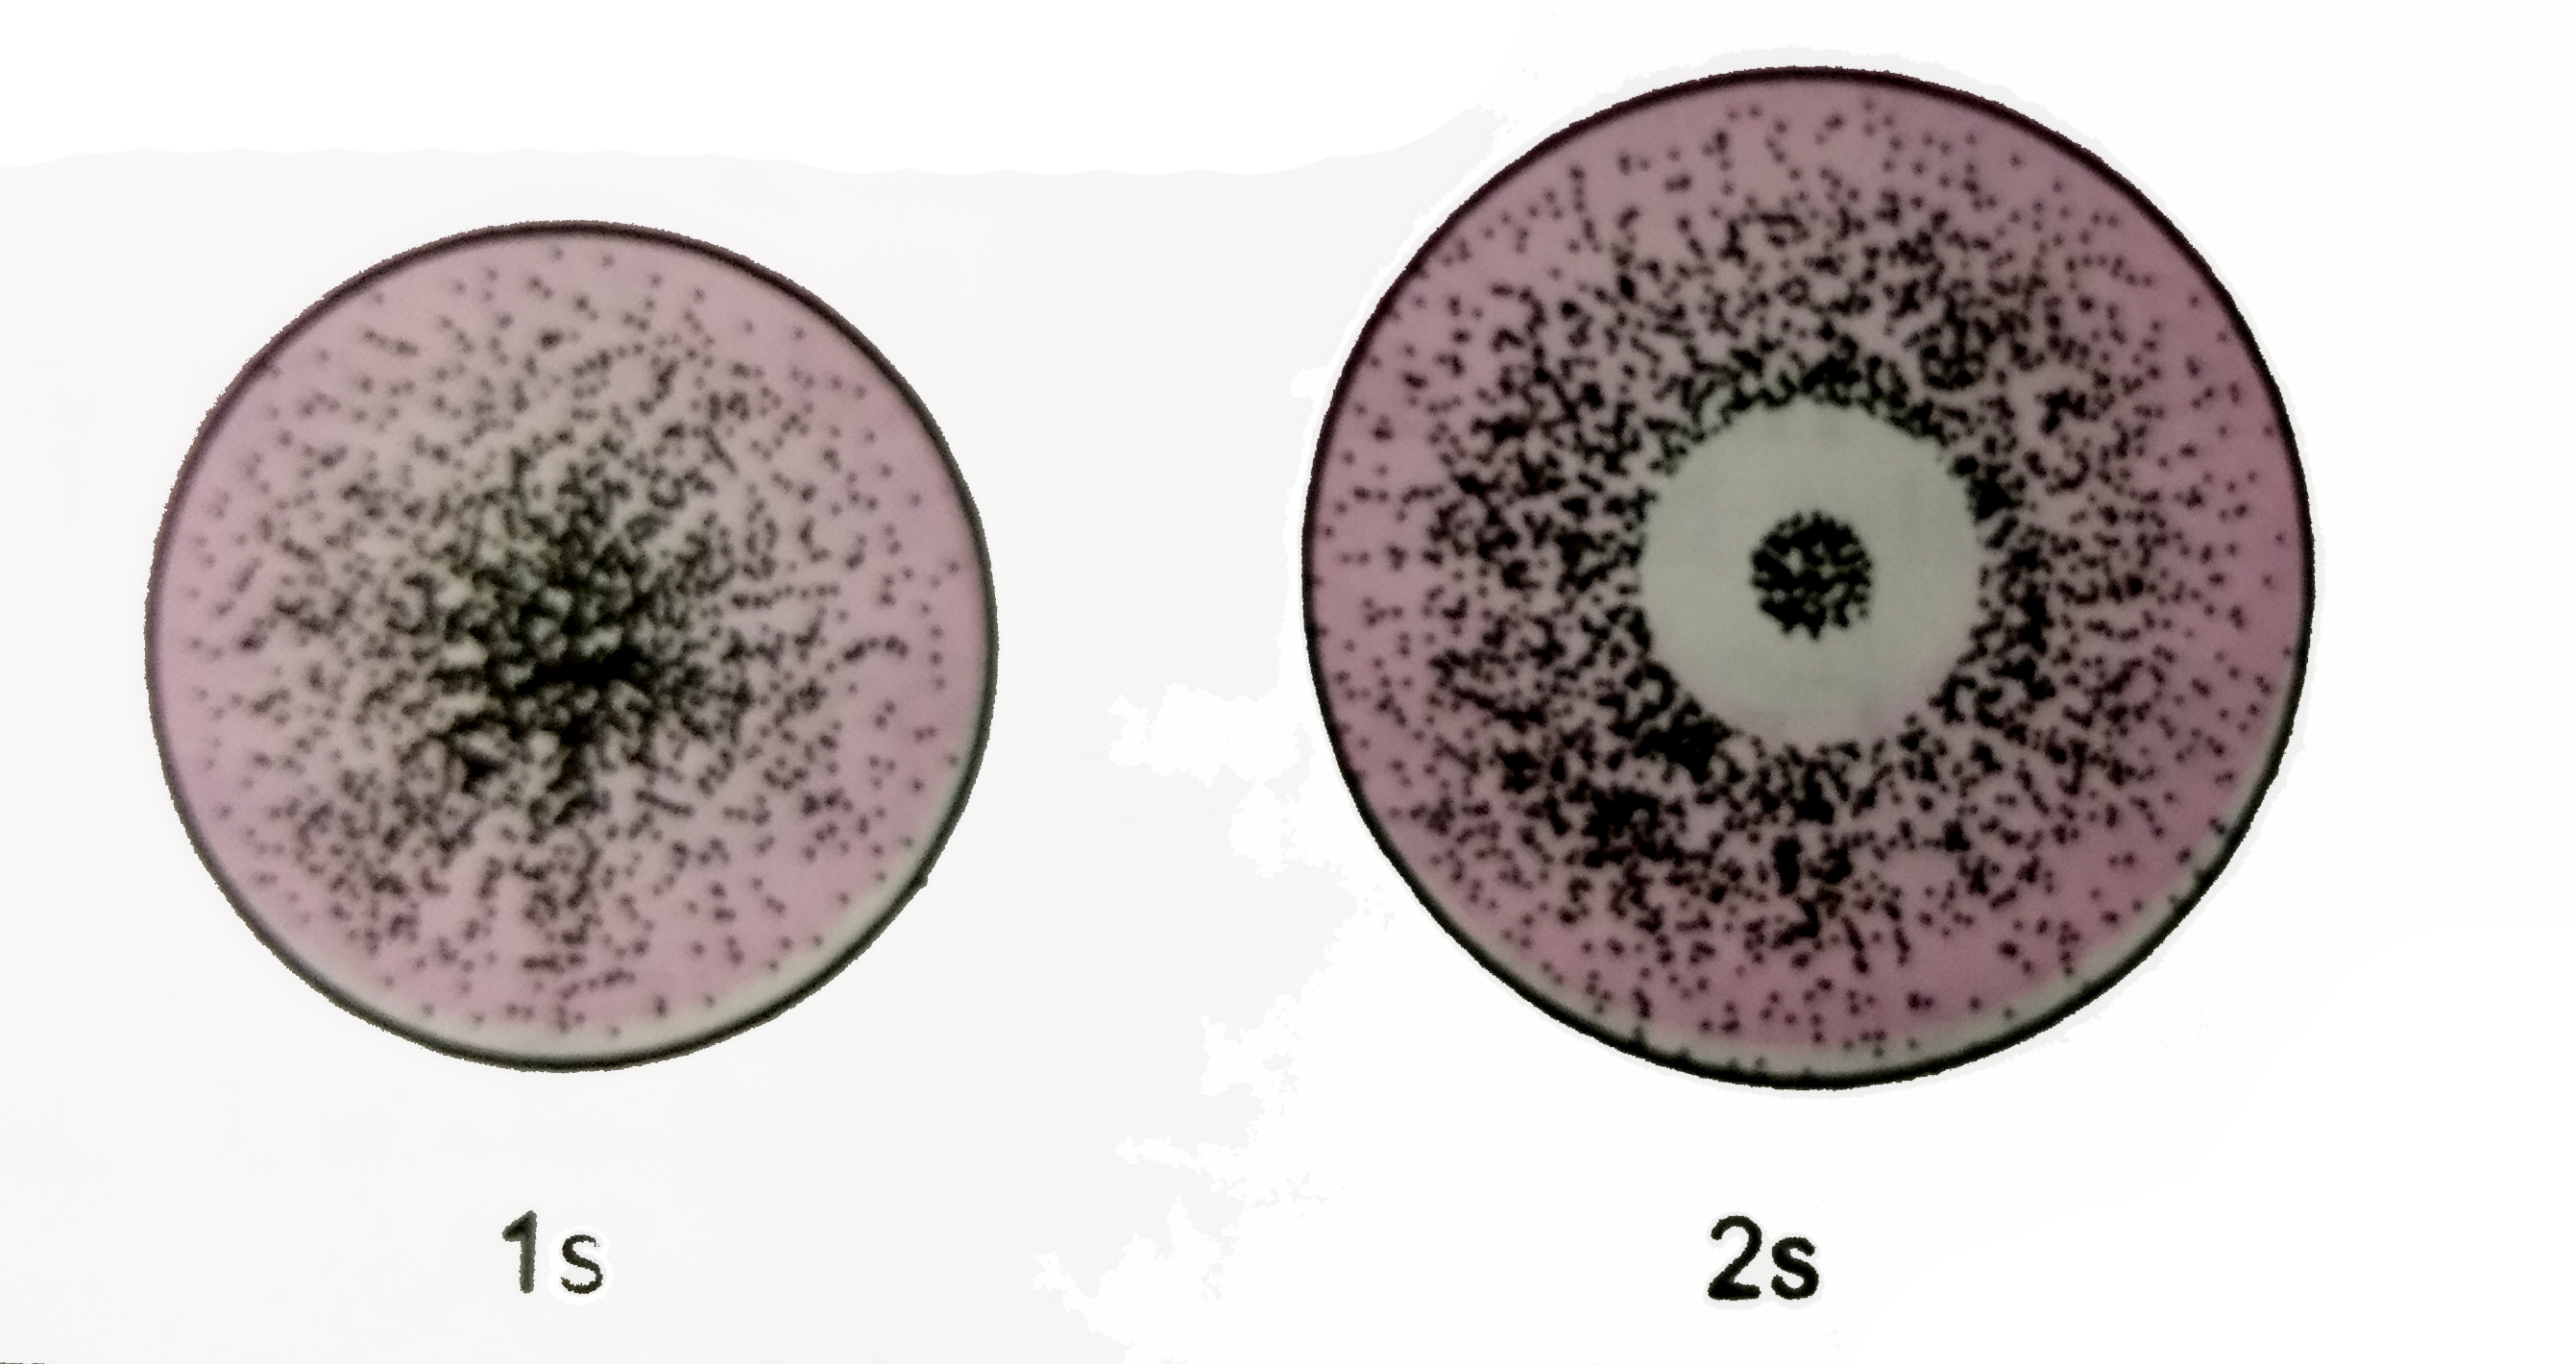
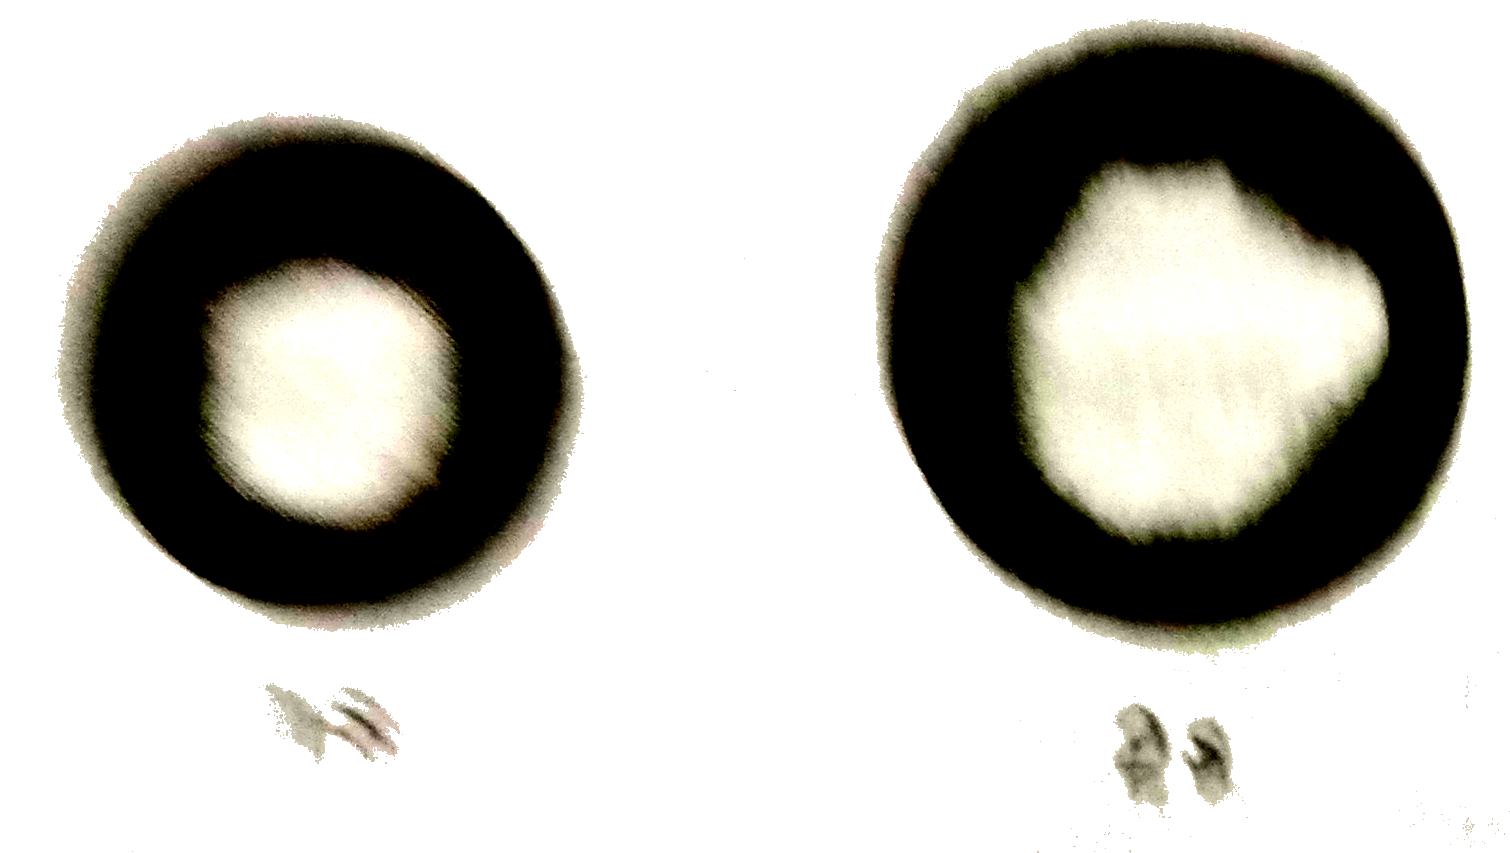
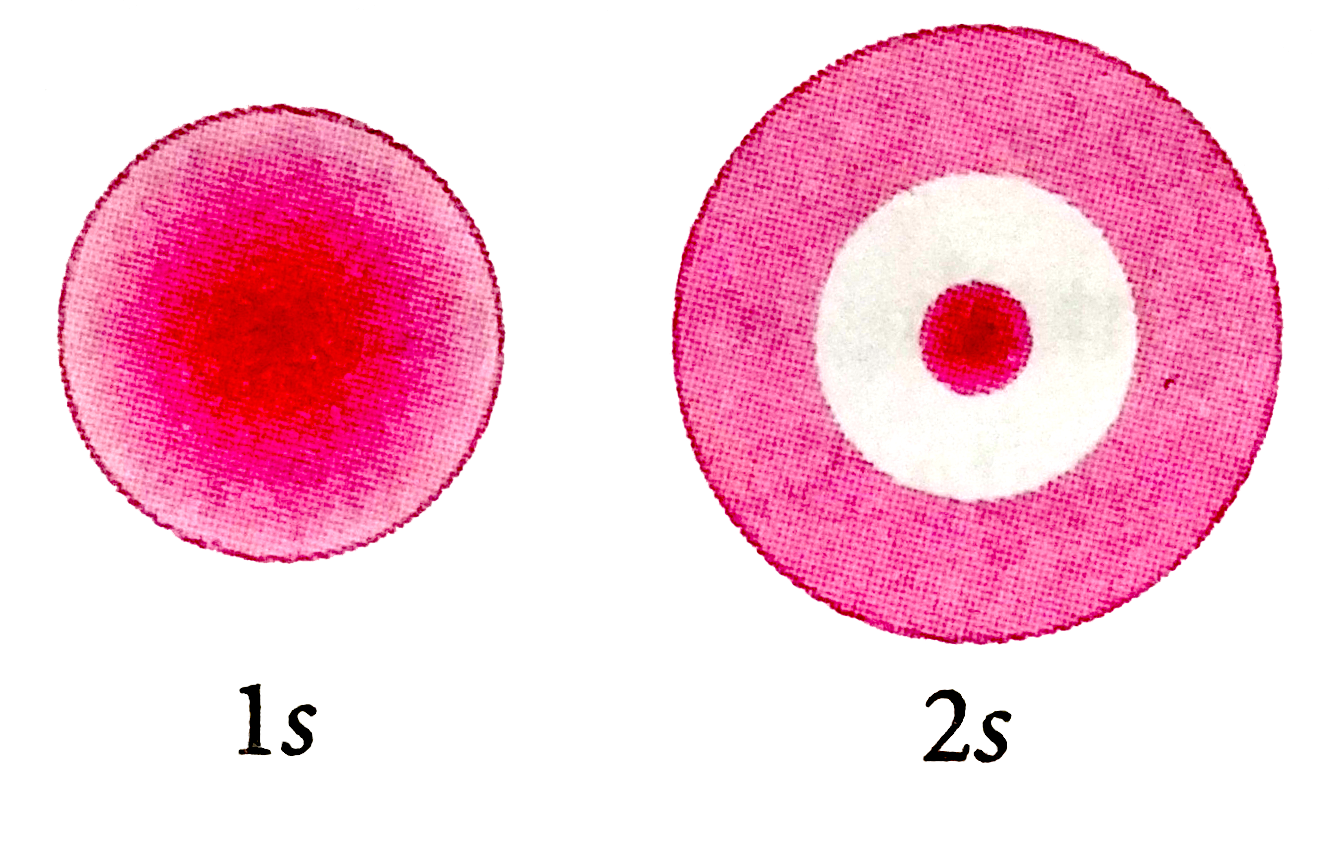
The probability density plots of 1s and 2s orbitals are given in Fig:

The density of dots in a region represents the probability density of finding electrons in the regions
on the basis of above diagram which one of the following statements is incorrect ?
1s and 2s orbitals are spherical in shape
The probability of finding the electron is maximum near the nucleus
The probability of finding the electron at a given distance is equal in all directions
The probability density of electrons for 2s orbital decrease uniformly as distance from the nucleus increases.
The correct Answer is:D
The probability density of electrons in 2s orbital first increases then decreases and after that it begins to increase agains
Topper's Solved these Questions
- STRUCTURE OF ATOMBOOK - PRADEEPCHAPTER - STRUCTURE OF ATOMEXERCISE - NCERT Exemplar Problems With Answers, Hints and Solution (II. Multiple Choice Questions)
5 Videos
- STRUCTURE OF ATOMBOOK - PRADEEPCHAPTER - STRUCTURE OF ATOMEXERCISE - NCERT Exemplar Problems With Answers, Hints and Solution (Short Answer questions)
20 Videos
- STRUCTURE OF ATOMBOOK - PRADEEPCHAPTER - STRUCTURE OF ATOMEXERCISE - NCERT Questions And Exercises with Answers
67 Videos
- STATES OF MATTER: SOLID MATTERBOOK - PRADEEPCHAPTER - STATES OF MATTER: SOLID MATTEREXERCISE - COMPETITION FOCUS (ASSERTION-REASON)
17 Videos
- THERMODYNAMICSBOOK - PRADEEPCHAPTER - THERMODYNAMICSEXERCISE - MULTIPLE CHOICE QUESTION ( BASED ON PRACTICAL CHEMISTRY)
3 Videos
Similar Questions
The probability density plots of 1 s and 2s orbitals are given in figure.

The density of dots in a region represetns the probability density of finding electrons in the region. On the basis of above diagram which of the following statements is incorrect?
View SolutionThe probability density plots of 1s and 2s atomic orbitals are given in figures.

The density of dots in a region represents the probability density of finding electrons in the region. On the basis of the above diagram, which of the following statements is incorect?
View Solution
Knowledge Check
The probability density plots of 1 s and 2s orbitals are given in figure.

The density of dots in a region represetns the probability density of finding electrons in the region. On the basis of above diagram which of the following statements is incorrect?A1s and 2s orbitals are spherical in shapeBThe probability of finding the electron is maximum near the nucleusCThe probability of finding the electron at a given distance is equal in all directionsDThe probability density of electrons for 2s orbital dec reases uniformly as distance from the nucleus increases.The probability density curve for 2s electron appears like
A B
B C
C D
D
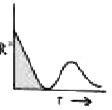
The probability density curve for 2s electron appears like
A B
B C
C D
D
Probability density curve for 3s orbital
View SolutionEnergy density in the region between 1s and 2s orbital is …………
View SolutionEnergy density in the region between 1s and 2s orbital is …………
View SolutionThe electron density between 1s and 2s is
View SolutionWhich of the following statements is incorrect for 1s orbital of hydrogen atom?
View Solution
