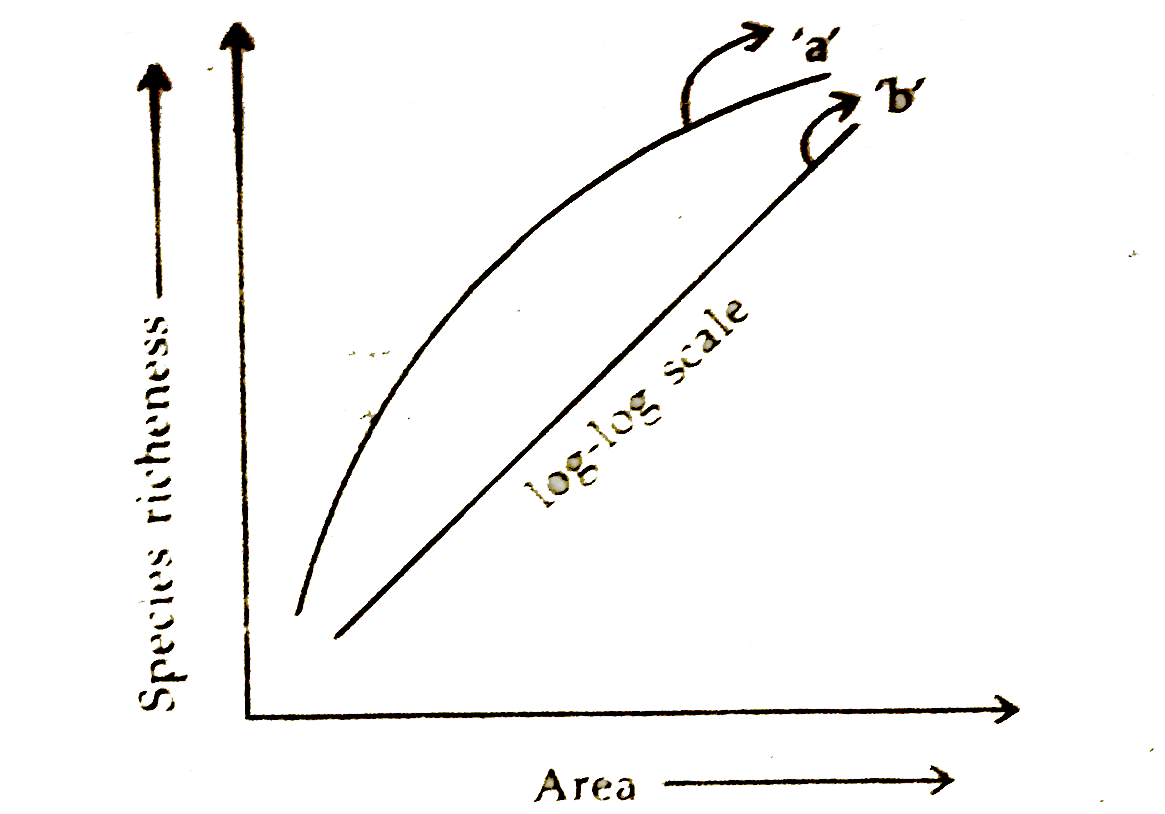
If we analyse the species-area relationships among very large areas like the entire continents, then slope of line becomes much steeper in the range of
0.1 to 0.6
0.1 to 0.2
0.6 to 1.2
0.2 to 0.6
The correct Answer is:C
Topper's Solved these Questions
- BIODIVERSITY AND CONSERVATIONBOOK - AAKASH INSTITUTECHAPTER - BIODIVERSITY AND CONSERVATIONEXERCISE - SECTION - A (Objective Type Questions)
34 Videos
- BIODIVERSITY AND CONSERVATIONBOOK - AAKASH INSTITUTECHAPTER - BIODIVERSITY AND CONSERVATIONEXERCISE - SECTION - B (Objective Type Questions)
34 Videos
- BIODIVERSITY AND CONSERVATIONBOOK - AAKASH INSTITUTECHAPTER - BIODIVERSITY AND CONSERVATIONEXERCISE - Try yourself
10 Videos
- ANIMAL KINGDOM (GENERAL ACCOUNTS & NON-CHORDATES)BOOK - AAKASH INSTITUTECHAPTER - ANIMAL KINGDOM (GENERAL ACCOUNTS & NON-CHORDATES)EXERCISE - Assignment (Section-D)
10 Videos
- BIOLOGICAL CLASSIFICATIONBOOK - AAKASH INSTITUTECHAPTER - BIOLOGICAL CLASSIFICATIONEXERCISE - Assignment (Section-D) Assertion - Reason Type Questions
15 Videos
Similar Questions
A species area curve is drawn by plotting the number of species against the area. How is it that when a very large area is considered the slope is steeper than that for smaller areas ?
View SolutionA species area curve is drawn by plotting the number of species against the area. How is it that when a very large area is considered the slope is steeper than that for smaller areas ?
View Solution
Knowledge Check
The species-area relationships among very large areas like entire continents
AThe slope of the line to be much steeperBZ values lies in the range of 0.1 to 0.2CZ values lies in the range of 0.6 to 1.2DBoth A and CDuring the analysing the surface area relationship among very large area like entire continents, the slope of the line is found much steeper and the Z values ranges
A0.1to0.2B1.15to3C0D0.6to1.2Assertion : If the species-area relationship are analysed among very large areas like the entire continents, the value of Z, i.e., slope of line in the range of 0.1 to 0.2.
Reason : The value of Z, i.e., slope of line of species area relationship lies in the range of 0.6 to 1.2 when analysis is done among small areas.AIf both assertion and reason are true and reason is the correct explanation of assertion.BIf both assertion and reason are true but reason is not the correct explanation of assertion.CIf assertion is true but reason is false.DIf both assertion and reason are false.
A species-area curve is drawn by plotting the number of species against the area. How is it that when a very large area is considered the slope is steeper than that of smaller areas?
View SolutionThe following graph shows the species area relationship. Answers the Questions as directed.
(a) Name the naturalist who studied the kind of relationship shown in the graph.
Write the observations made by him.
(b) Write the situations as discovered by the ecologists when the value of 'Z' (slope of the line) lies between
(i) 0.1 and 0.2, (ii) 0.6 and 1.2
What does 'Z' stand for ?
(c ) When would the slope of the line 'b' become steeper ?

View SolutionAssertion : If the species-area relationship are analysed among very large areas like the entire continents, the value of Z, i.e., slope of line in the range of 0.1 to 0.2.
Reason : The value of Z, i.e., slope of line of species area relationship lies in the range of 0.6 to 1.2 when analysis is done among small areas.
View SolutionFor frugivorous birds and mammals in the tropical forests of different continents the slope is found to be
View Solution
