Draw the position-time graph of an object moving with positive accceleration.
To draw the position-time graph of an object moving with positive acceleration, we can follow these steps:
Step 1: Understand the Concept of Positive Acceleration
Positive acceleration means that the velocity of the object is increasing over time. This implies that the object is speeding up.
Step 2: Use the Kinematic Equation
For an object moving with constant positive acceleration, we can use the kinematic equation for position:
x(t)=x0+v0t+12at2
where:
- x(t) is the position at time t,
- x0 is the initial position,
- v0 is the initial velocity,
- a is the constant acceleration,
- t is the time.
Step 3: Consider Initial Conditions
Assume:
- The initial position x0=0 (the object starts from the origin).
- The initial velocity v0=0 (the object starts from rest).
- The acceleration a is a positive constant.
Step 4: Substitute Values into the Equation
Substituting the initial conditions into the equation gives:
x(t)=0+0⋅t+12at2
This simplifies to:
x(t)=12at2
Step 5: Analyze the Graph
The equation x(t)=12at2 indicates that the position x is proportional to the square of time t. This means:
- At t=0, x=0.
- As t increases, x increases at an increasing rate because of the t2 term.
Step 6: Draw the Graph
1. Draw a set of axes with time t on the x-axis and position x on the y-axis.
2. Start at the origin (0,0).
3. As time increases, the position will curve upwards, indicating that the object is moving faster and faster.
4. The graph will be a parabola opening upwards, starting from the origin.
Final Graph
The final position-time graph will look like a curve that rises steeply as time progresses, indicating positive acceleration.
---
Positive acceleration means that the velocity of the object is increasing over time. This implies that the object is speeding up.
For an object moving with constant positive acceleration, we can use the kinematic equation for position:
x(t)=x0+v0t+12at2
where:
- x(t) is the position at time t,
- x0 is the initial position,
- v0 is the initial velocity,
- a is the constant acceleration,
- t is the time.
Assume:
- The initial position x0=0 (the object starts from the origin).
- The initial velocity v0=0 (the object starts from rest).
- The acceleration a is a positive constant.
Substituting the initial conditions into the equation gives:
x(t)=0+0⋅t+12at2
This simplifies to:
x(t)=12at2
The equation x(t)=12at2 indicates that the position x is proportional to the square of time t. This means:
- At t=0, x=0.
- As t increases, x increases at an increasing rate because of the t2 term.
1. Draw a set of axes with time t on the x-axis and position x on the y-axis.
2. Start at the origin (0,0).
3. As time increases, the position will curve upwards, indicating that the object is moving faster and faster.
4. The graph will be a parabola opening upwards, starting from the origin.
The final position-time graph will look like a curve that rises steeply as time progresses, indicating positive acceleration.
Topper's Solved these Questions
- BOOK - AAKASH INSTITUTECHAPTER - MOTION IN STRAIGHT LINEEXERCISE - Try Yourself40videos
MOTION IN STRAIGHT LINE
- BOOK - AAKASH INSTITUTECHAPTER - MOTION IN STRAIGHT LINEEXERCISE - Assignment (SECTION - A)50videos
MOTION IN STRAIGHT LINE
- BOOK - AAKASH INSTITUTECHAPTER - MOTION IN A STRAIGHT LINEEXERCISE - ASSIGNMENT (SECTION - D)15videos
MOTION IN A STRAIGHT LINE
- BOOK - AAKASH INSTITUTECHAPTER - MOVING CHARGE AND MAGNESIUMEXERCISE - SECTION D16videos
MOVING CHARGE AND MAGNESIUM
Similar Questions
Knowledge Check
- Question 1 - Select One
Position - time graph for motion with negative acceleration is
A B
B C
C D
D
- Question 2 - Select One
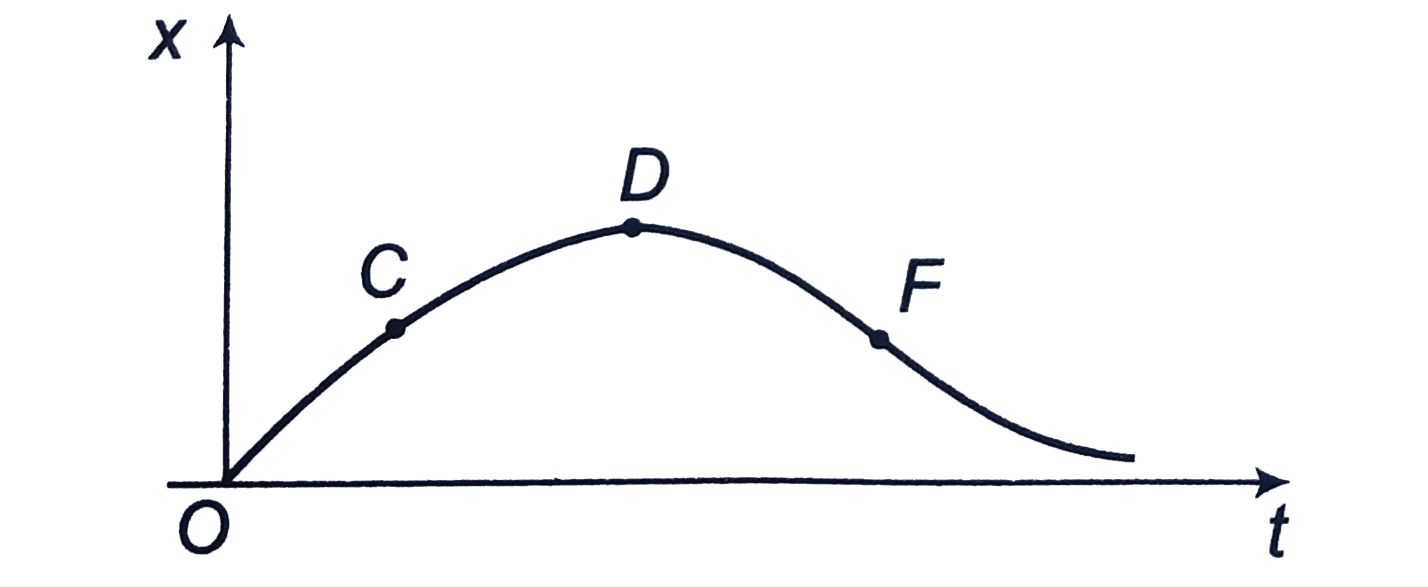
The position-time graph of an object moving in a straight line is shown below. The object has zero velocity at
 AOBCCDDF
 - Question 3 - Select One
Figure shows the position -time graph of an object in SHM. The correct equation representing this motion is
 A2sin(2π5t+π6)B4sin(π5t+π6)C4sin(π6t+π3)D4sin(π6t+π6)
Draw the velocity-time graph of an object moving with uniform negative acceleration.
View SolutionDraw the position-time graph of a stationary object.
View SolutionDraw distance time graph of a body moving with :
(i) positive acceleration
(ii) negative acceleration.View SolutionDraw distance time graph of a body moving with constant acceleration.
View SolutionDraw the position-time graph for an object in uniform motion. Show that the slope of the position-time graph gives the velocity of the object.
View Solution
