Which of the following is a V-T curve for isobaric process?
A
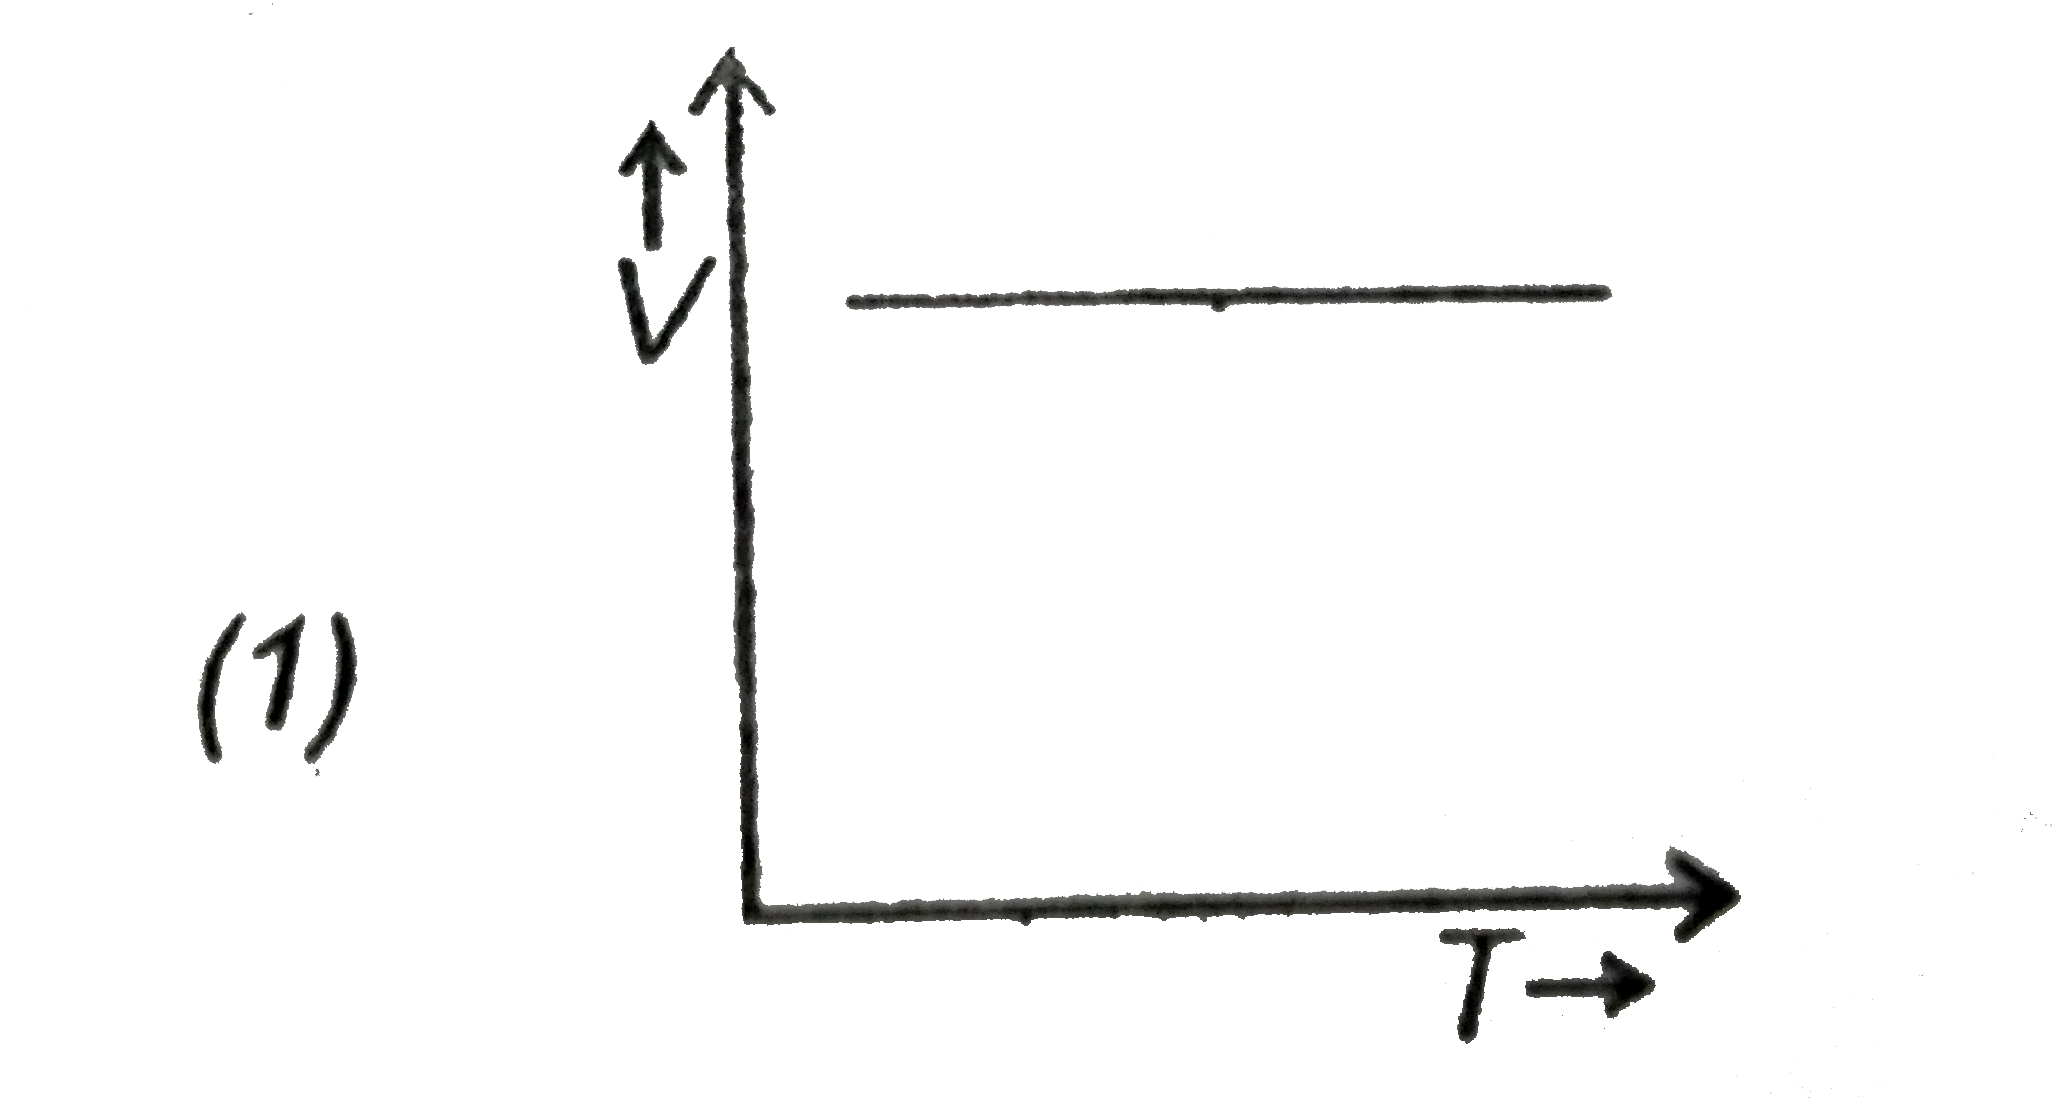
B
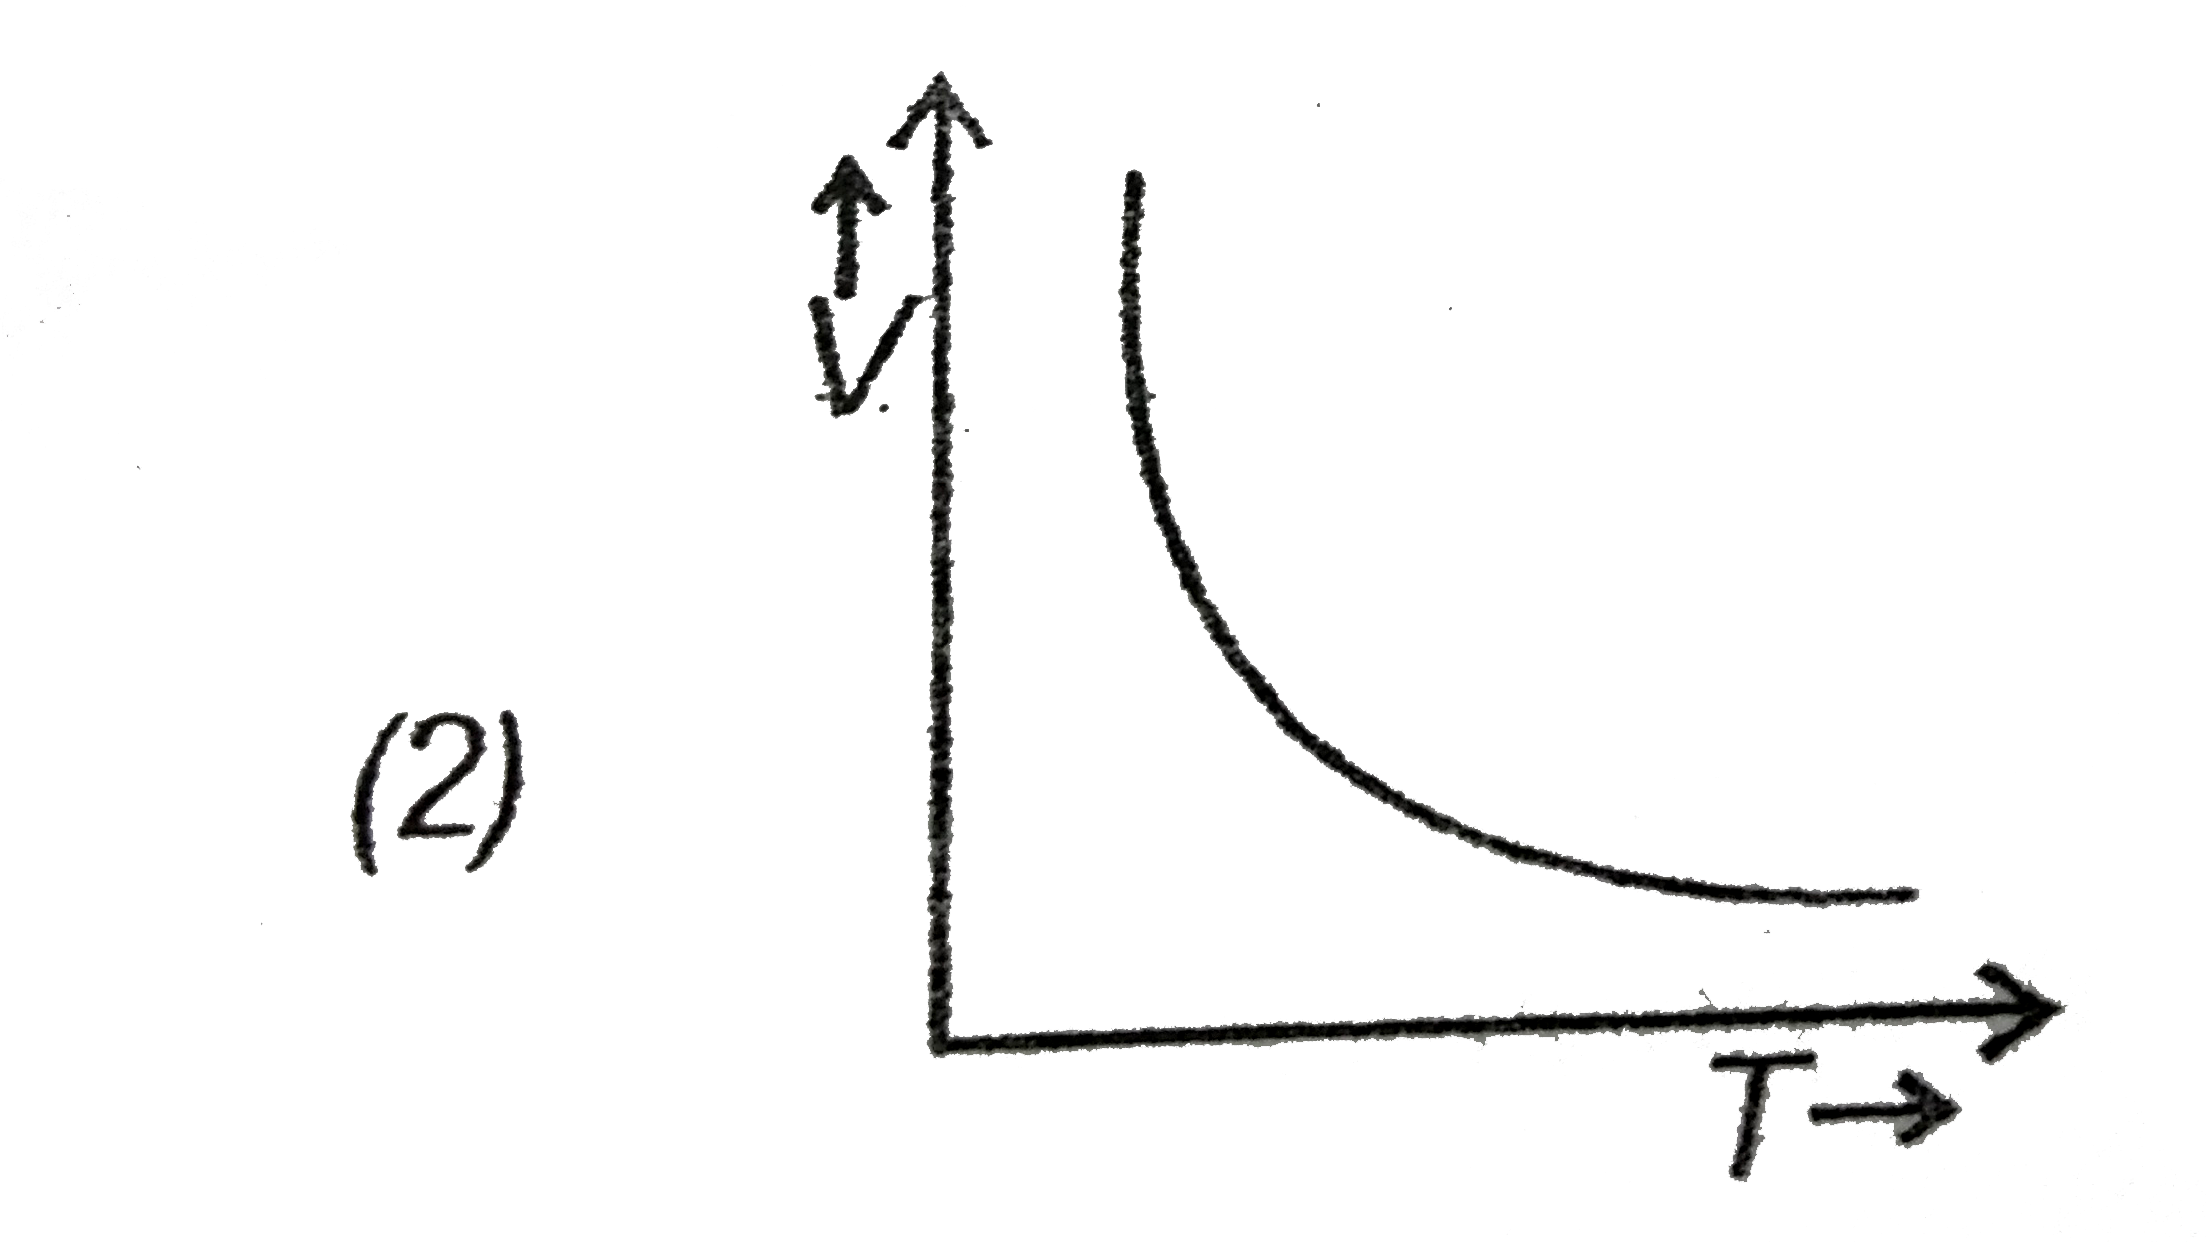
C
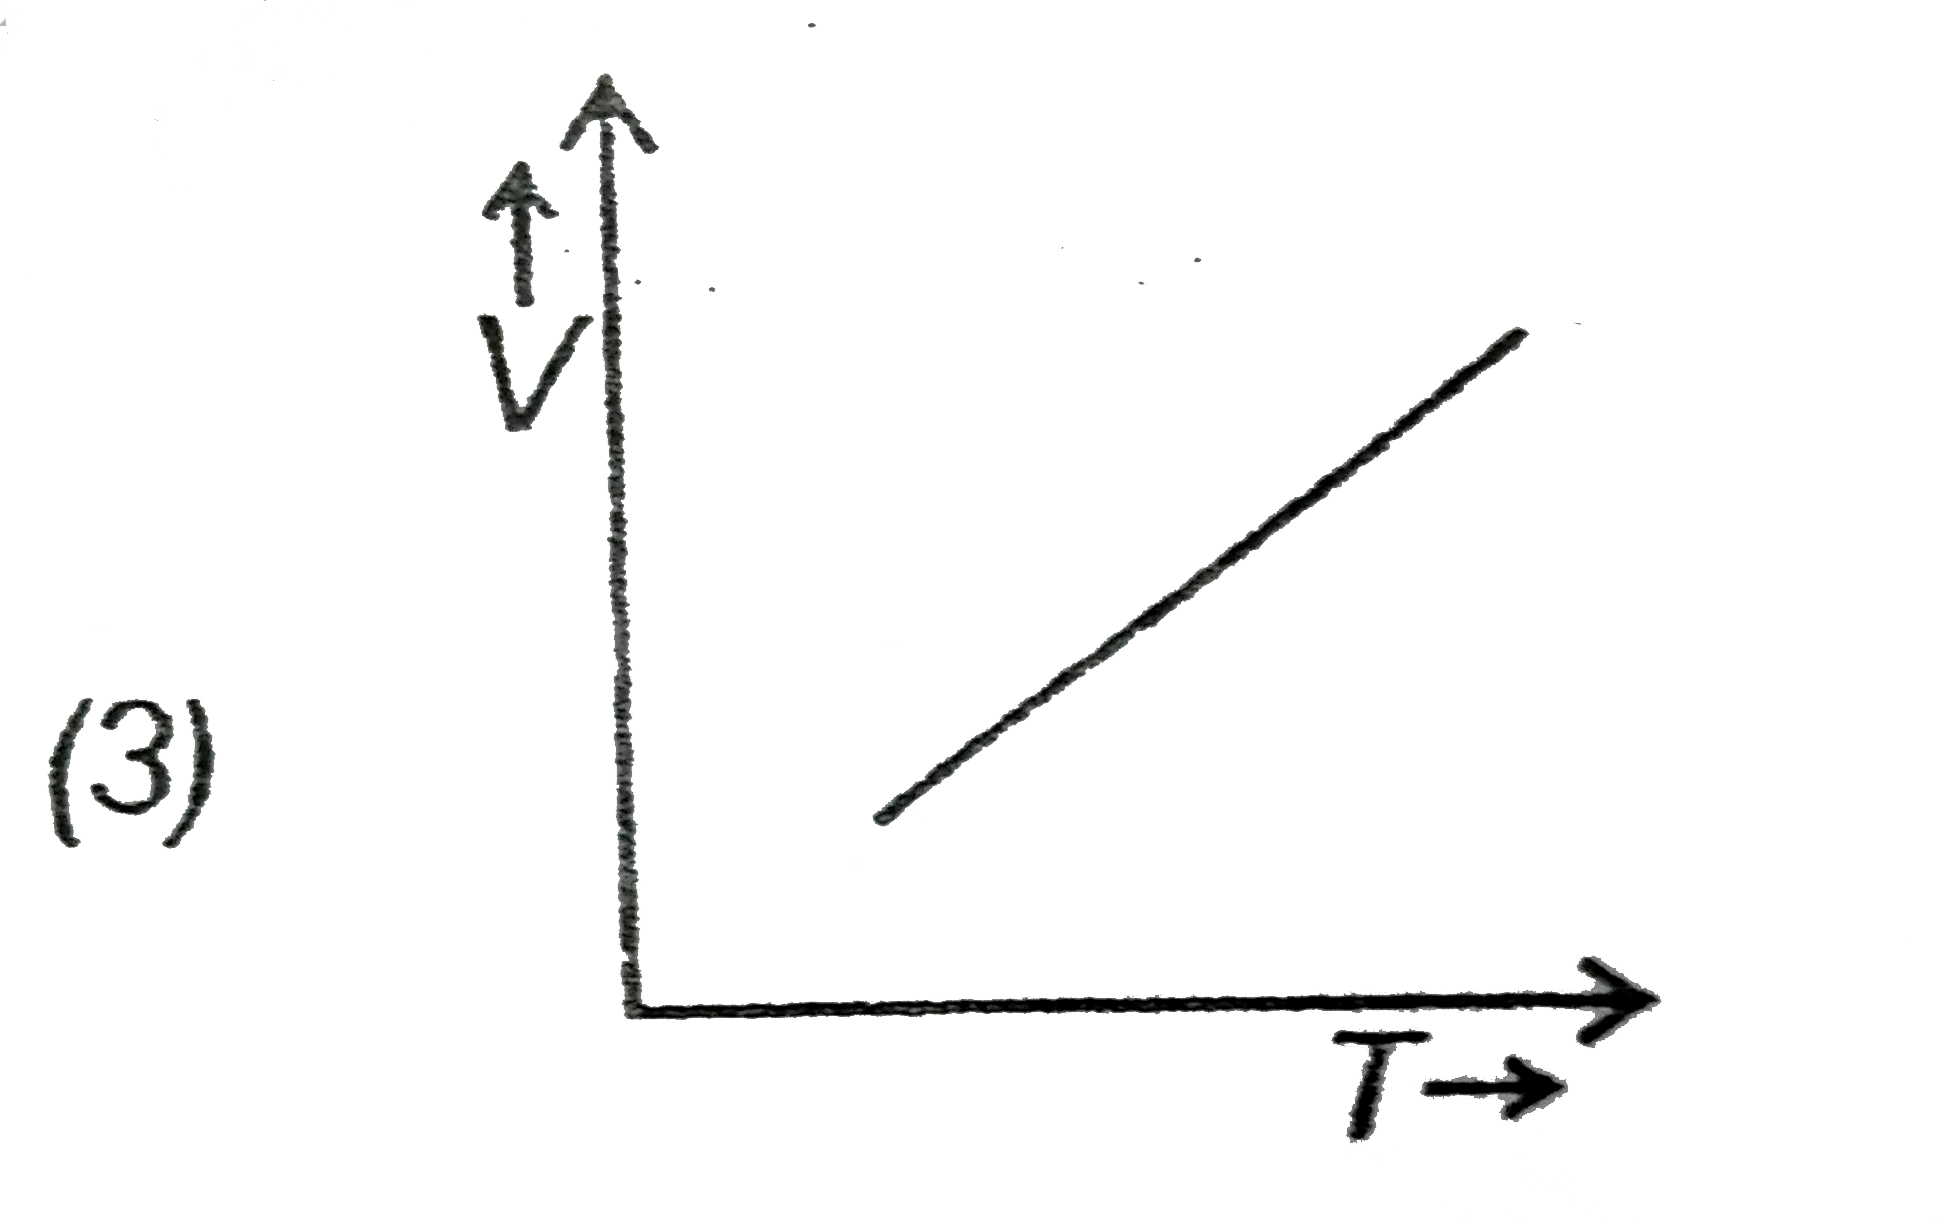
D
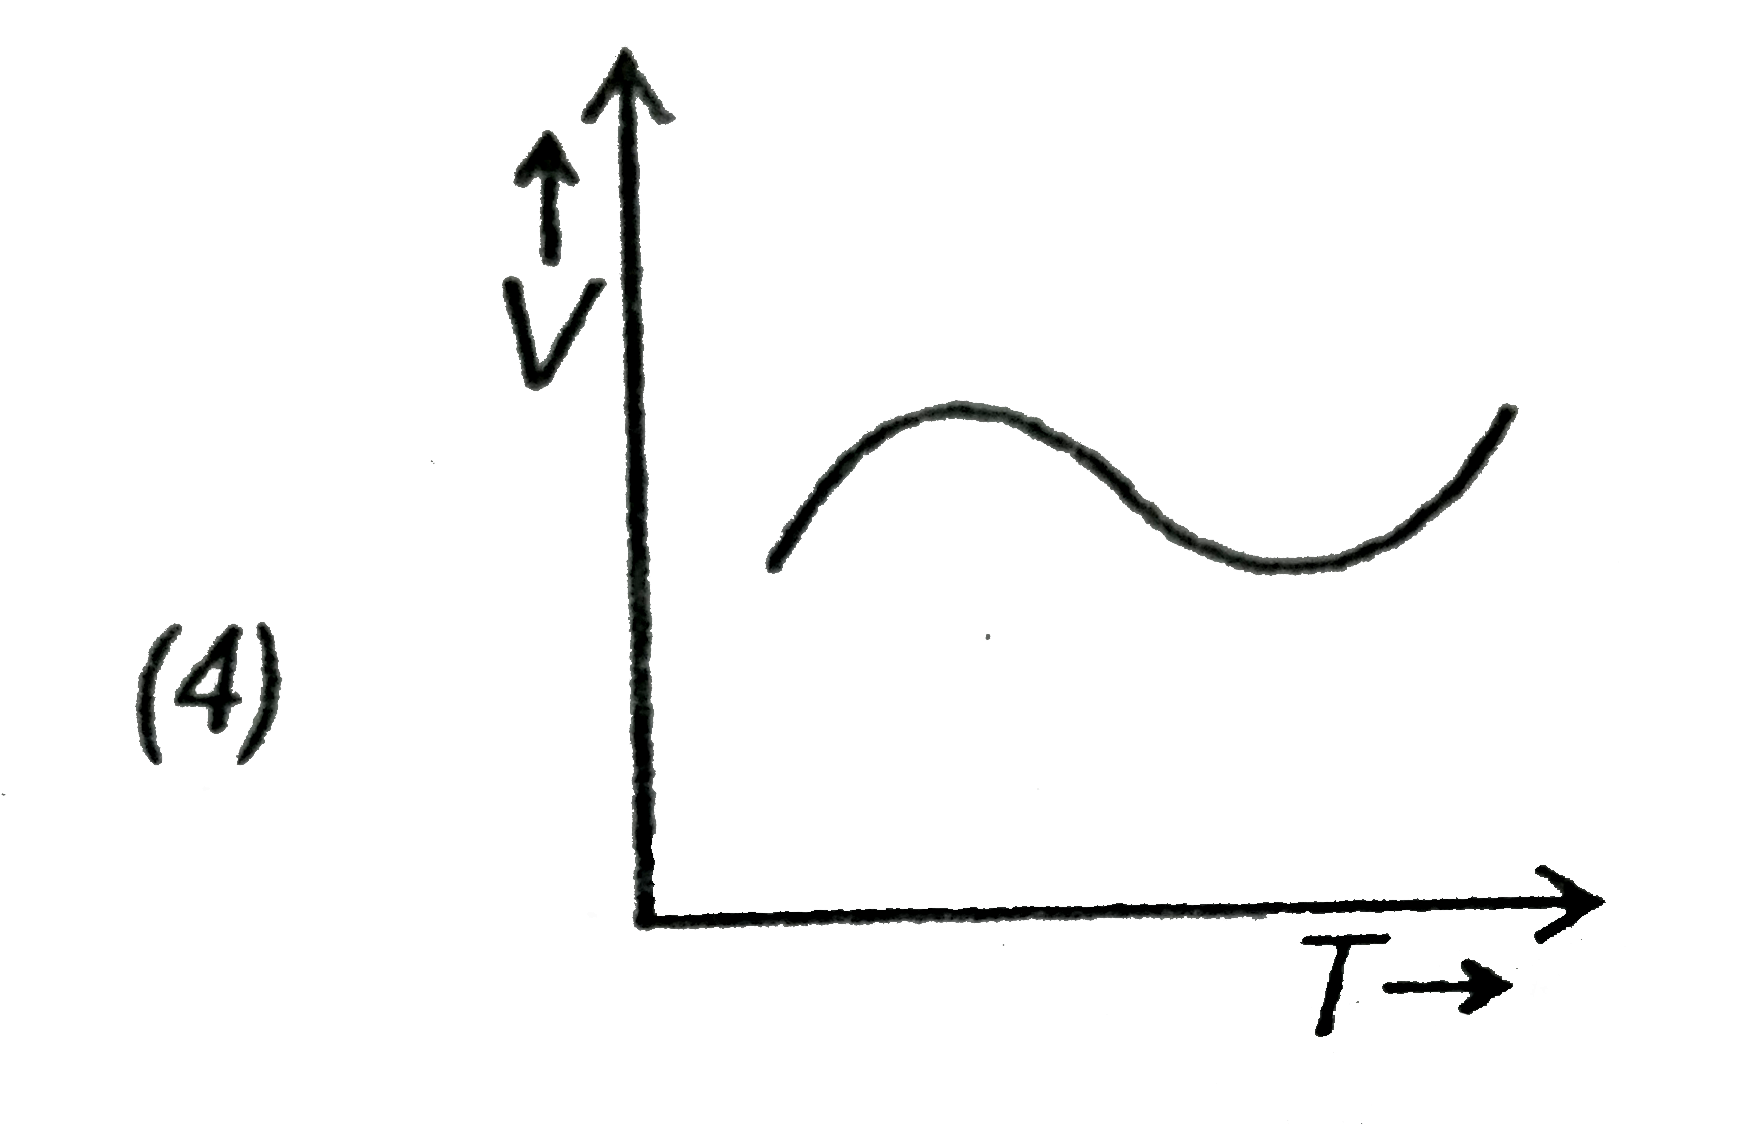
Video Solution
Text Solution
The correct Answer is:C
|
Answer
Step by step video, text & image solution for Which of the following is a V-T curve for isobaric process? by Physics experts to help you in doubts & scoring excellent marks in Class 12 exams.
Updated on:21/07/2023Similar Questions
Knowledge Check
In isobaric process
Asize of the bar remains sameBsize of barometer remains sameCpressure of the system remains sameDvolume remains sameIn an isobaric process, __________ .
Asize of the bar remains sameBsize of barometer remains sameCpressure of the system remains sameDvolume remains sameIn an isobaric process
APressure increasesBPressure decreasesCPressure neither increases or decreases (P fixed),DNone of these.
Draw at P-T curve for isochoric process.
View SolutionDraw at P-T curve for isochoric process.
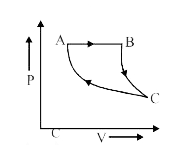
View SolutionFor a given thermodynamic process, the P – V diagram is as shown below:
Which of the following is the V – T diagram for the process?
A→C: isobaric
B→C: adiabatic
C→A : isothermal
View SolutionWhich of the following nuclides are isobars?
View SolutionWhich of the following pairs represents isobars?
View Solution
