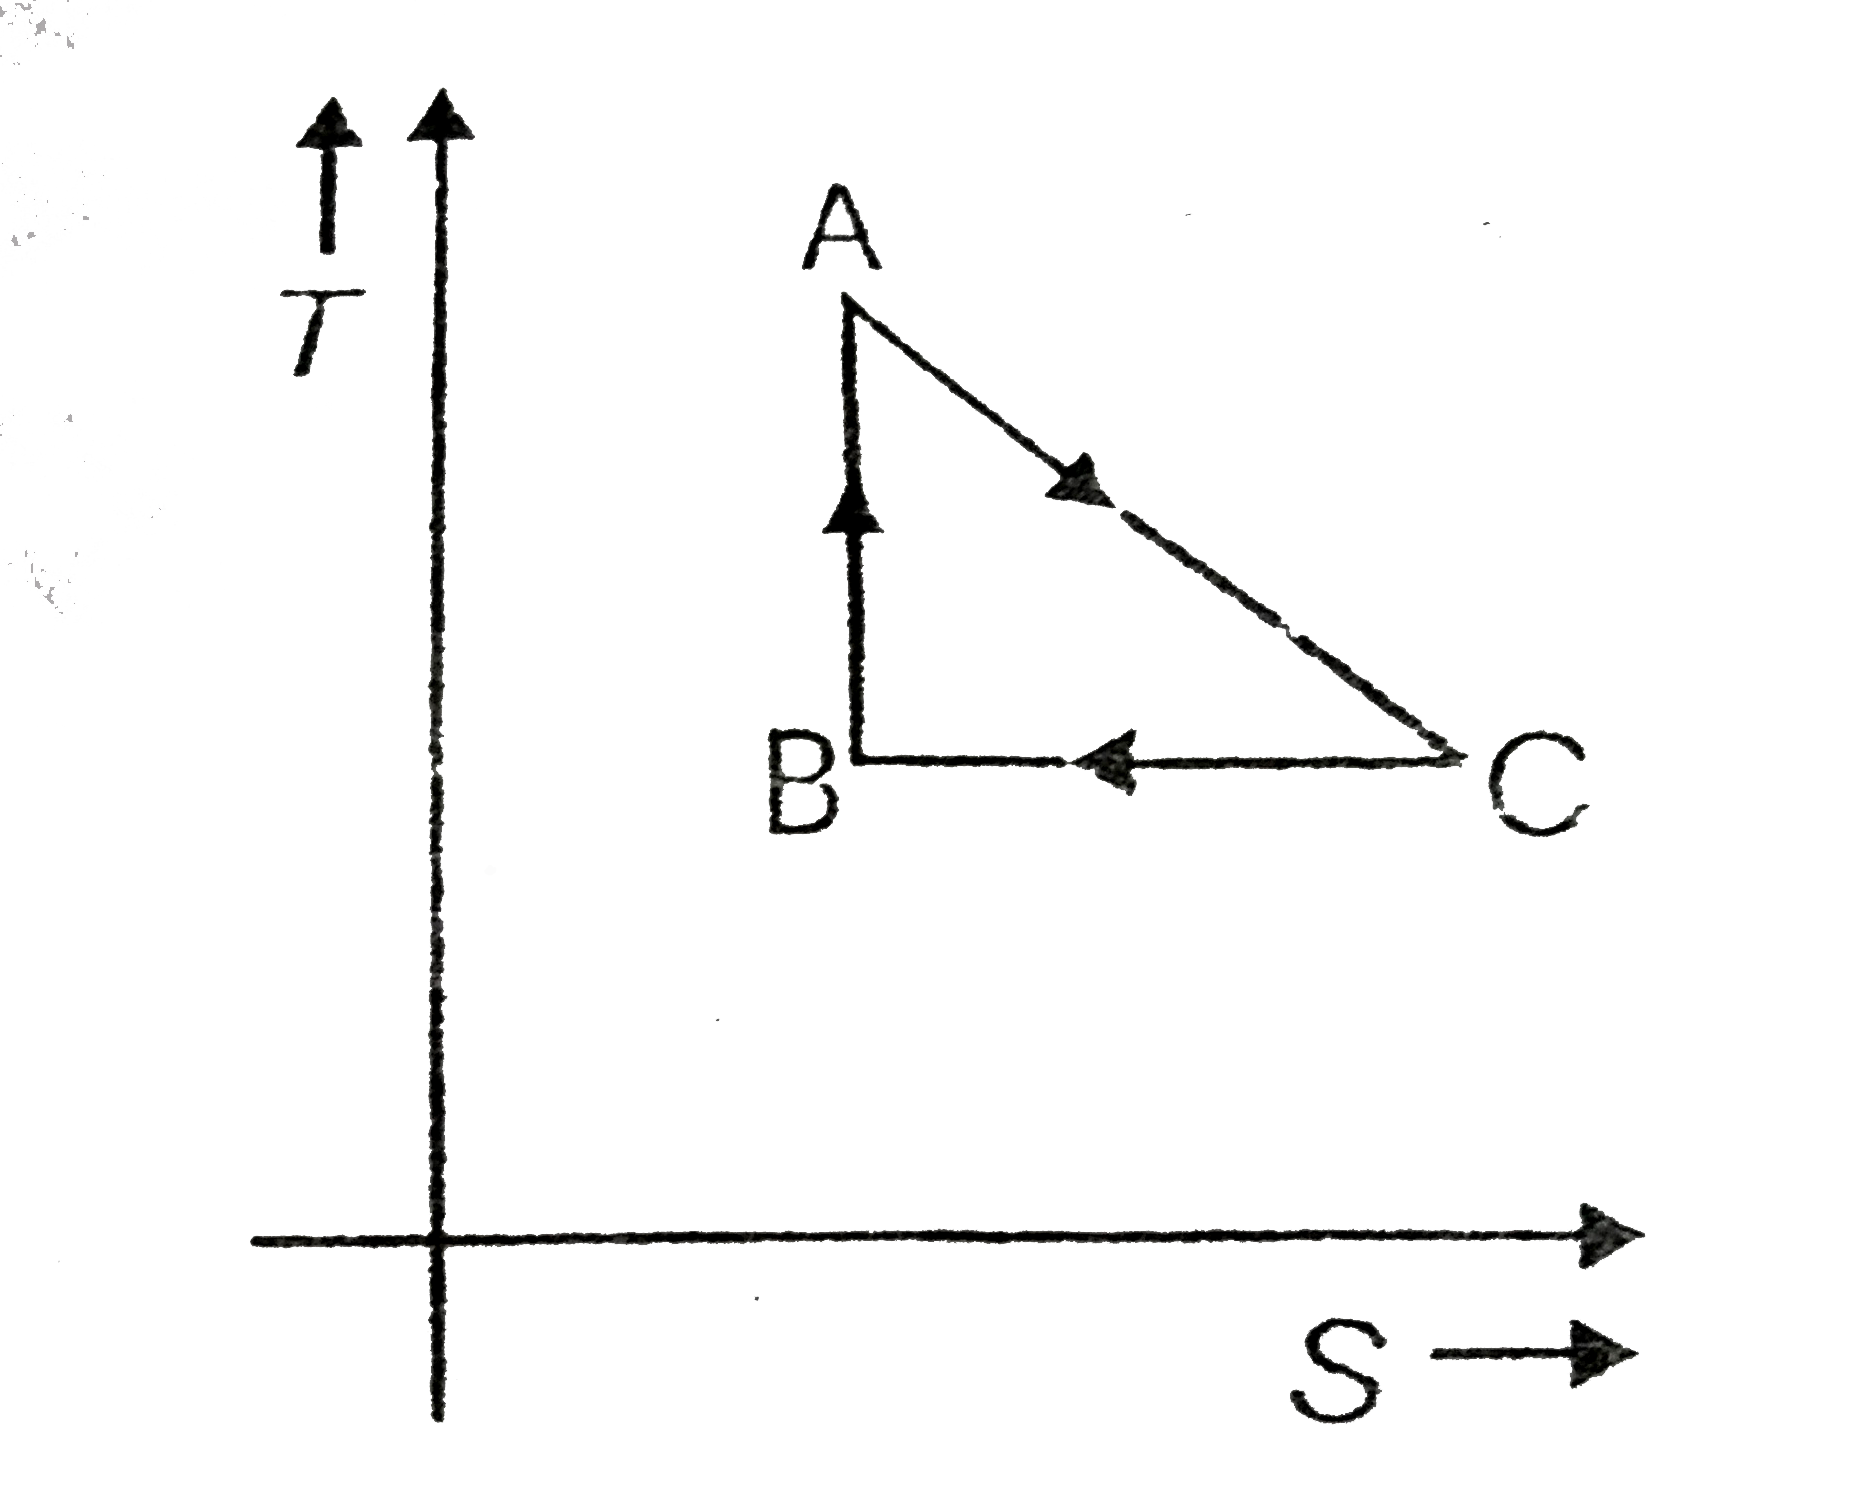
As area under P-V diagram represent work done by gas in a thermodynamic process, area under temperature (T) entropy (S) graph represents heat supplied to the thermodynamic system. Consider the following graph

Process AB is isochoric
Process BC is isothermal
Process AB is adiabatic
heat is absorbed by the gas during the process ACBA
The correct Answer is:B, C, D
Step by step video & image solution for As area under P-V diagram represent work done by gas in a thermodynamic process, area under temperature (T) entropy (S) graph represents heat supplied to the thermodynamic system. Consider the following graph by Physics experts to help you in doubts & scoring excellent marks in Class 12 exams.
Updated on:21/07/2023Topper's Solved these Questions
- THERMODYNAMICSBOOK - AAKASH INSTITUTECHAPTER - THERMODYNAMICSEXERCISE - Assignment (Section-D) Linked comprehension Type questions
3 Videos
- THERMODYNAMICSBOOK - AAKASH INSTITUTECHAPTER - THERMODYNAMICSEXERCISE - Assignment (Section-E) Assertion-Reason Type Questions
8 Videos
- THERMODYNAMICSBOOK - AAKASH INSTITUTECHAPTER - THERMODYNAMICSEXERCISE - Assignment (Section-B) Objective Type Questions (one option is correct)
14 Videos
- THERMAL PROPERTIES OF MATTERBOOK - AAKASH INSTITUTECHAPTER - THERMAL PROPERTIES OF MATTEREXERCISE - Assignment (Section-J) Akash Challengers Questions
7 Videos
- UNITS AND MEASUREMENTSBOOK - AAKASH INSTITUTECHAPTER - UNITS AND MEASUREMENTSEXERCISE - ASSIGNMENT (SECTION - D)
15 Videos
Similar Questions
Knowledge Check
Area under Speed-Time graph represents
ADistanceBAverage acceleration,CAccelerationDNone of these.The area under acceleration - time graph represents the
Ainitial velocityBfinal velocity,Cchange in velocity,Ddistance travelled.The area under a speed -time graph is represented by the unit
AmBm2Cm3Dm−1
The area under the acceleration-time (a-t) graph gives
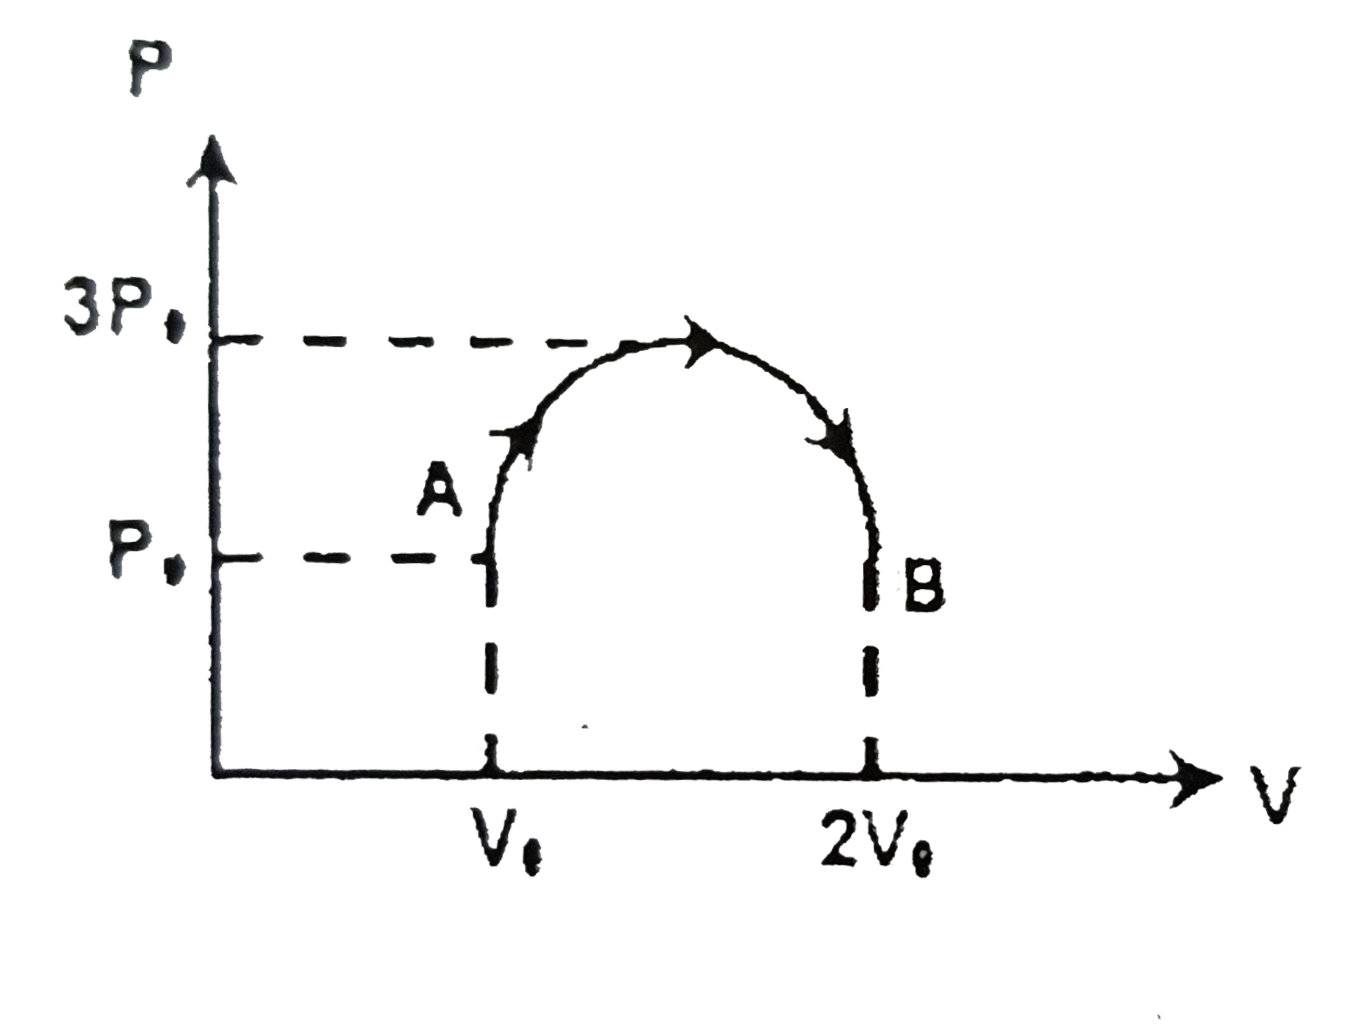
View SolutionOne mole of an ideal monoatomic gas is taken through the thermodynamic process shown in the P−V diagram. The heat supplied to the system is

View SolutionIn the given curve total area under the graph represents:

View SolutionArea under a (v−t) graph represents a physical quantity which has the unit
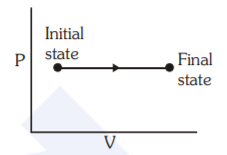
View SolutionPV Diagram for ideal gas in piston cylinder assembly undergoing a thermodynamic process is shown in figure. Process is

View Solution
