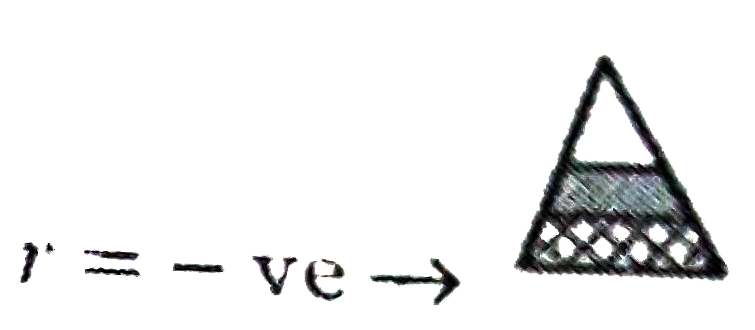
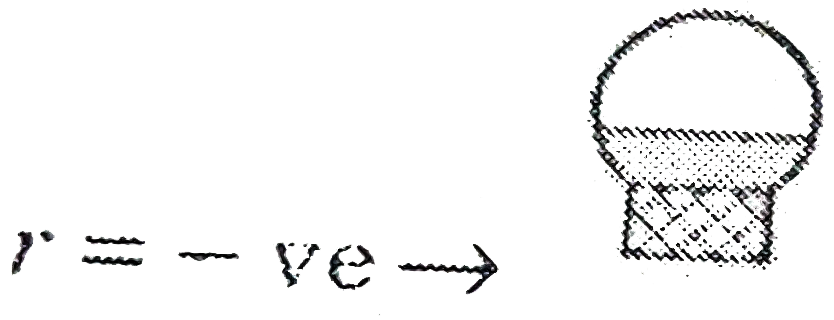
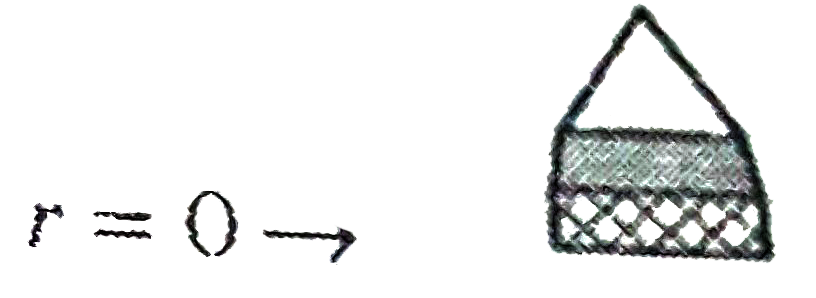
From the given graph of population growth select the correct option having correct value of 'r' and bar graph

A

B
C
D
Text Solution
The correct Answer is:D
A bell-shaped polygon indicates a moderate proportion of young to old. As the rate of growth becomes slow and stable, the pre-reproductive and reproductive age group become more or less equal in size and post-reproductive group remain as the smallest.
|
Topper's Solved these Questions
- ORGANISMS AND POPULATIONS BOOK - ARIHANT NEETCHAPTER - ORGANISMS AND POPULATIONS EXERCISE - Chapter exercises ( Medical entrances special format questions Assertion and reason)
12 Videos
- NEURAL CONTROL AND COORDINATION BOOK - ARIHANT NEETCHAPTER - NEURAL CONTROL AND COORDINATION EXERCISE - CHAPTER EXERCISES MEDICAL ENTRANCES GALLERY
111 Videos
- ORIGIN OF LIFEBOOK - ARIHANT NEETCHAPTER - ORIGIN OF LIFEEXERCISE - Chapter Exercises Medical entrance Gallery (C) (Collection of questions Asked in NEET & Various Medical Entrance Exams)
24 Videos
Similar Questions
Knowledge Check
From the graph of population growth, select the correct option having correct value of rand the graph.
 A
A B
B C
C D
D
Select the correct option for the following graph :
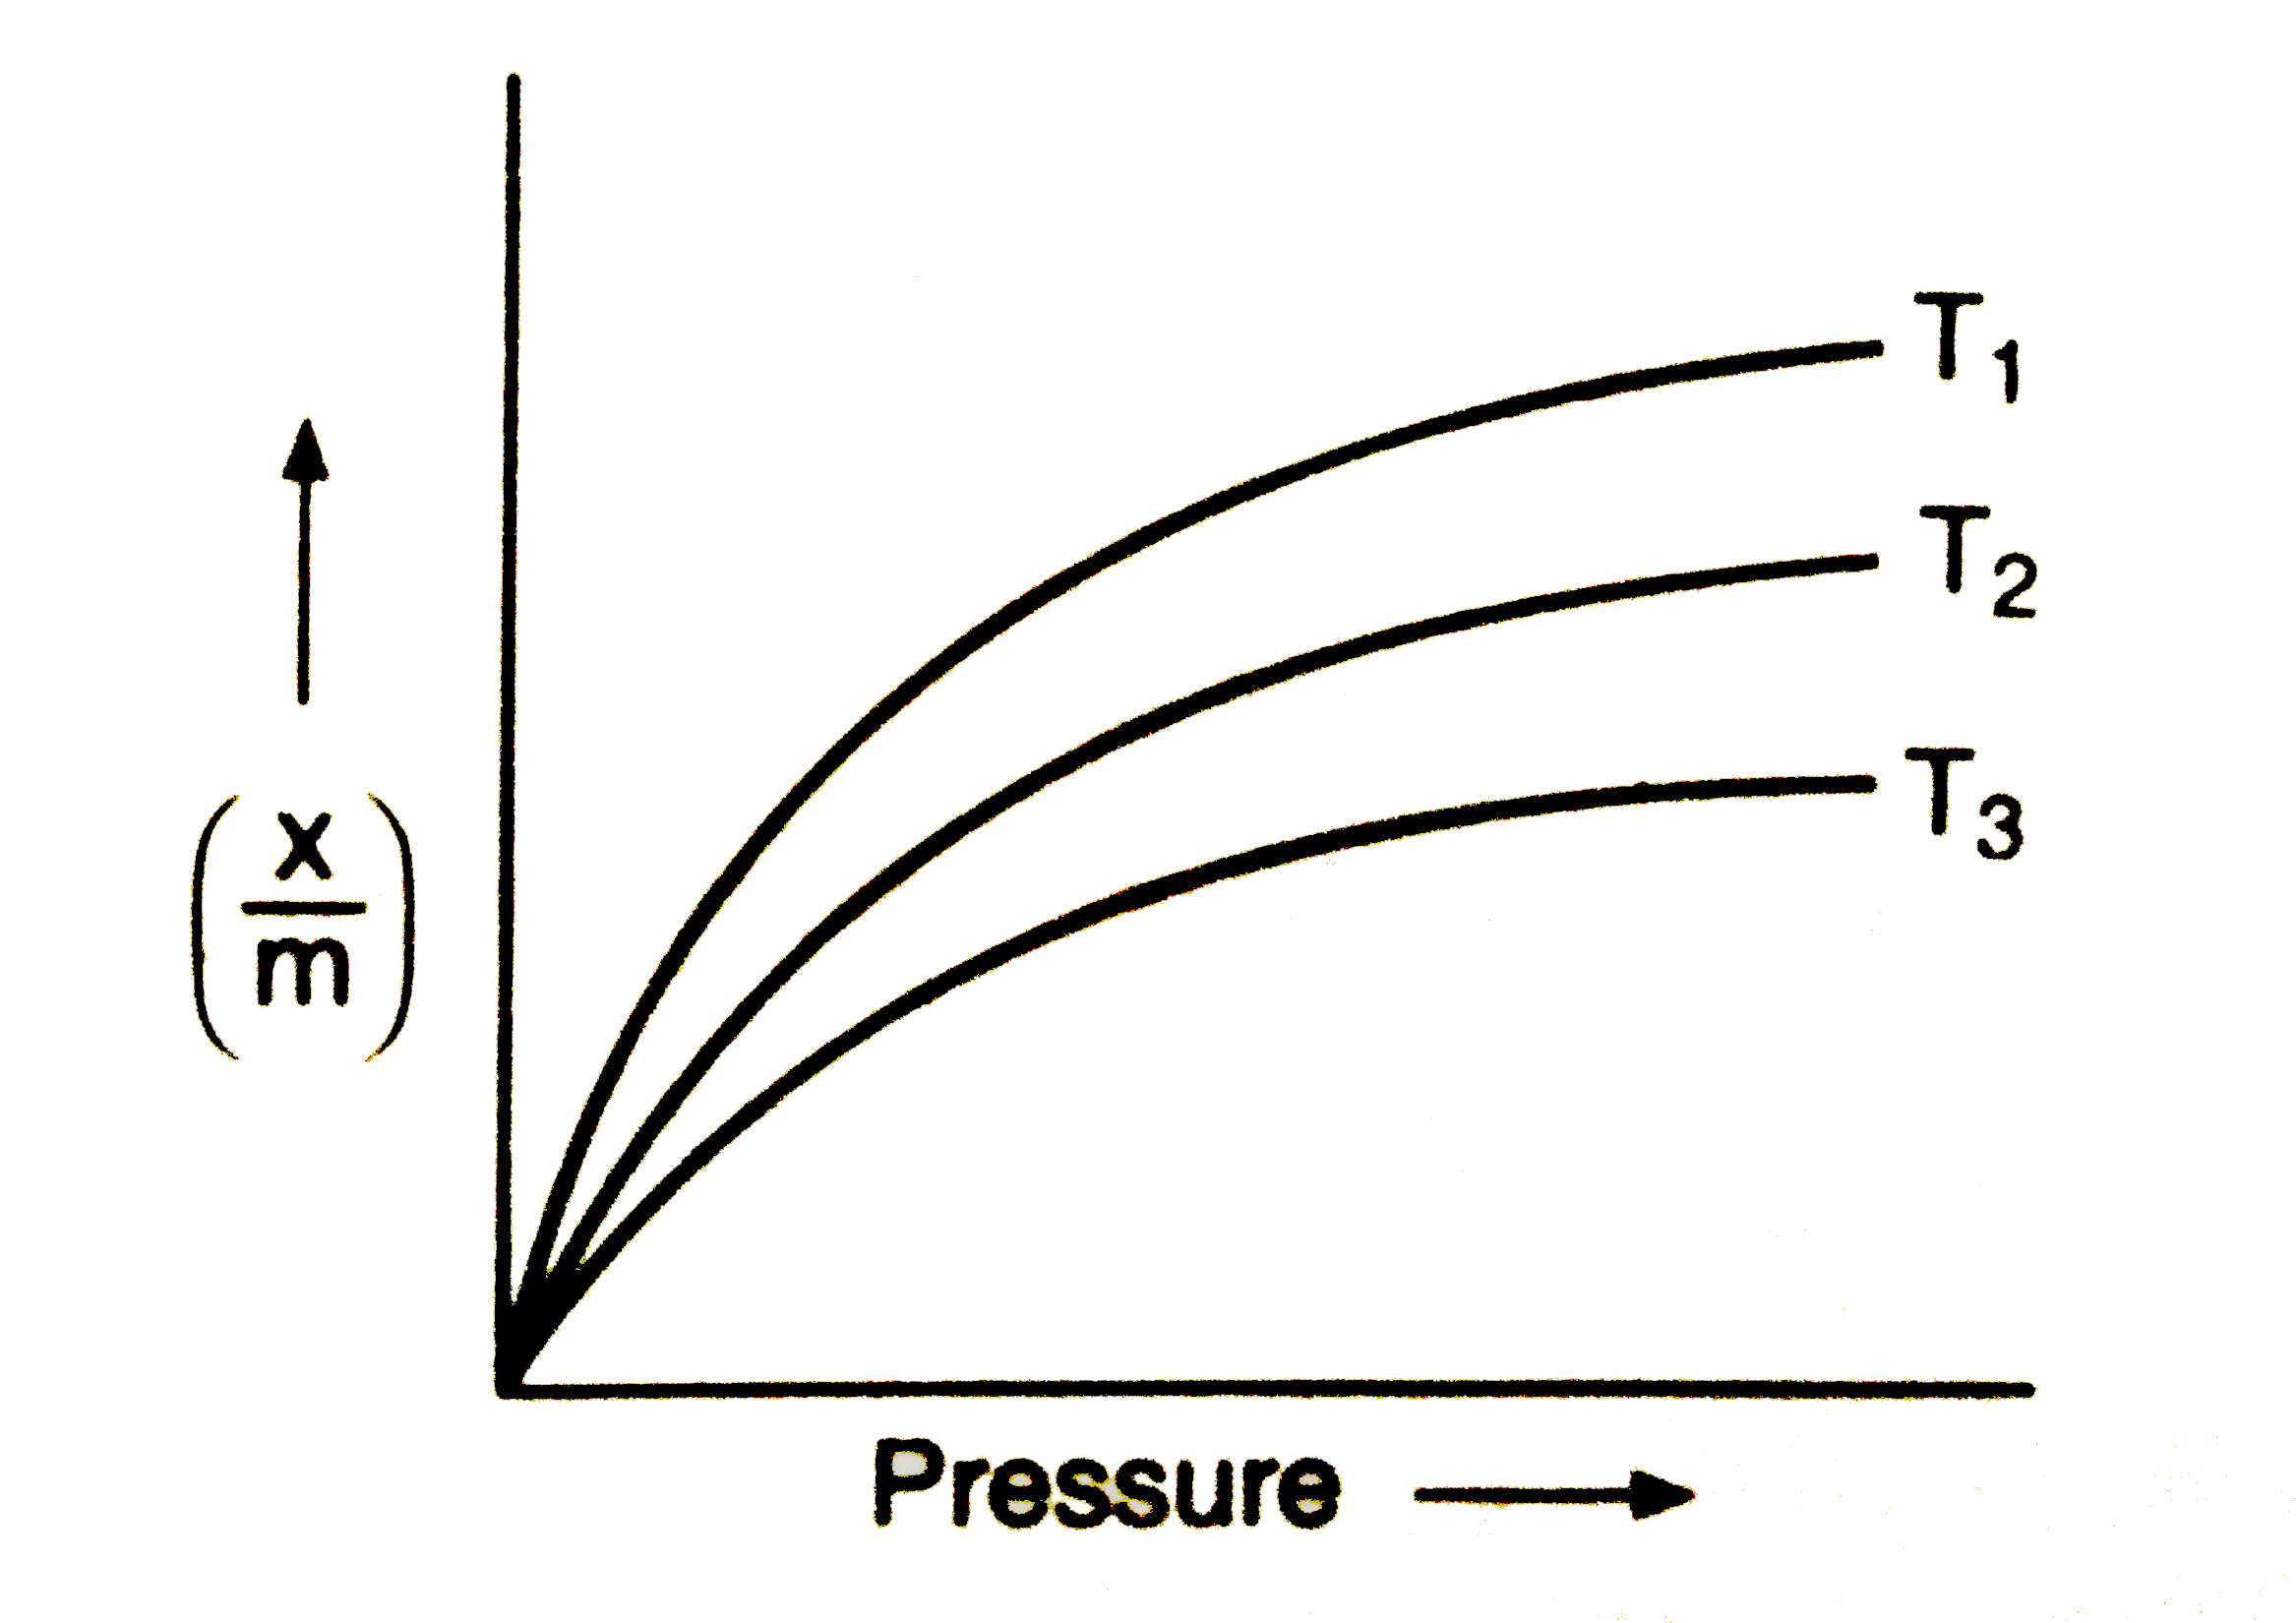 AT1>T2>T3BT1=T2=T3CT1<T2<T3DT1>T2<T3
Study the given graphs and select the correct statement regarding them.
 AGraph (A) represents physisorption isobar.BGraph (B) represents chemisorption isobar.CGraph (C) represents an adsorption isostere.DAll of these
From the given graph
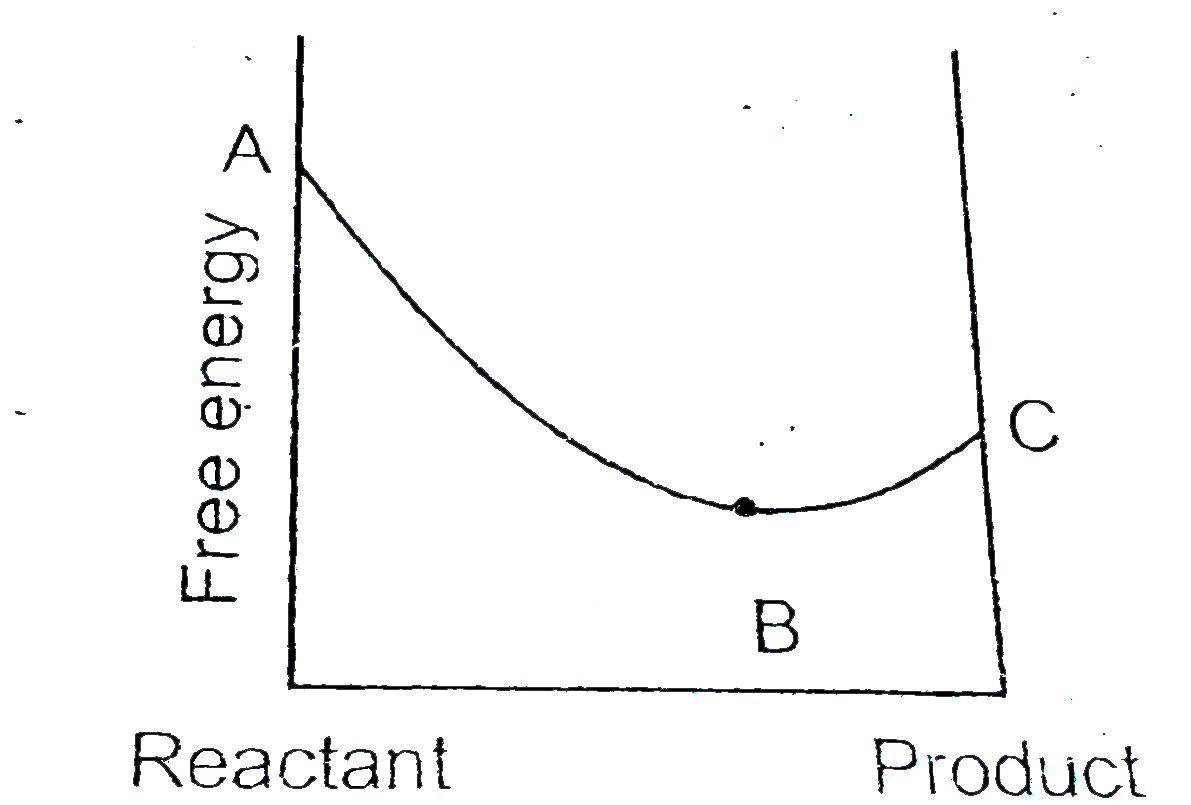
Which of the following statement is correct ?
View SolutionConsidering the graph of 1s , choose the correct option:
View SolutionObserve the given population growth formula
dNdt=rN
Now selecte the correct option.
View SolutionSelect the correct graph for Bohr atom:
View SolutionSelect the correct option from the given statements.
View Solution

