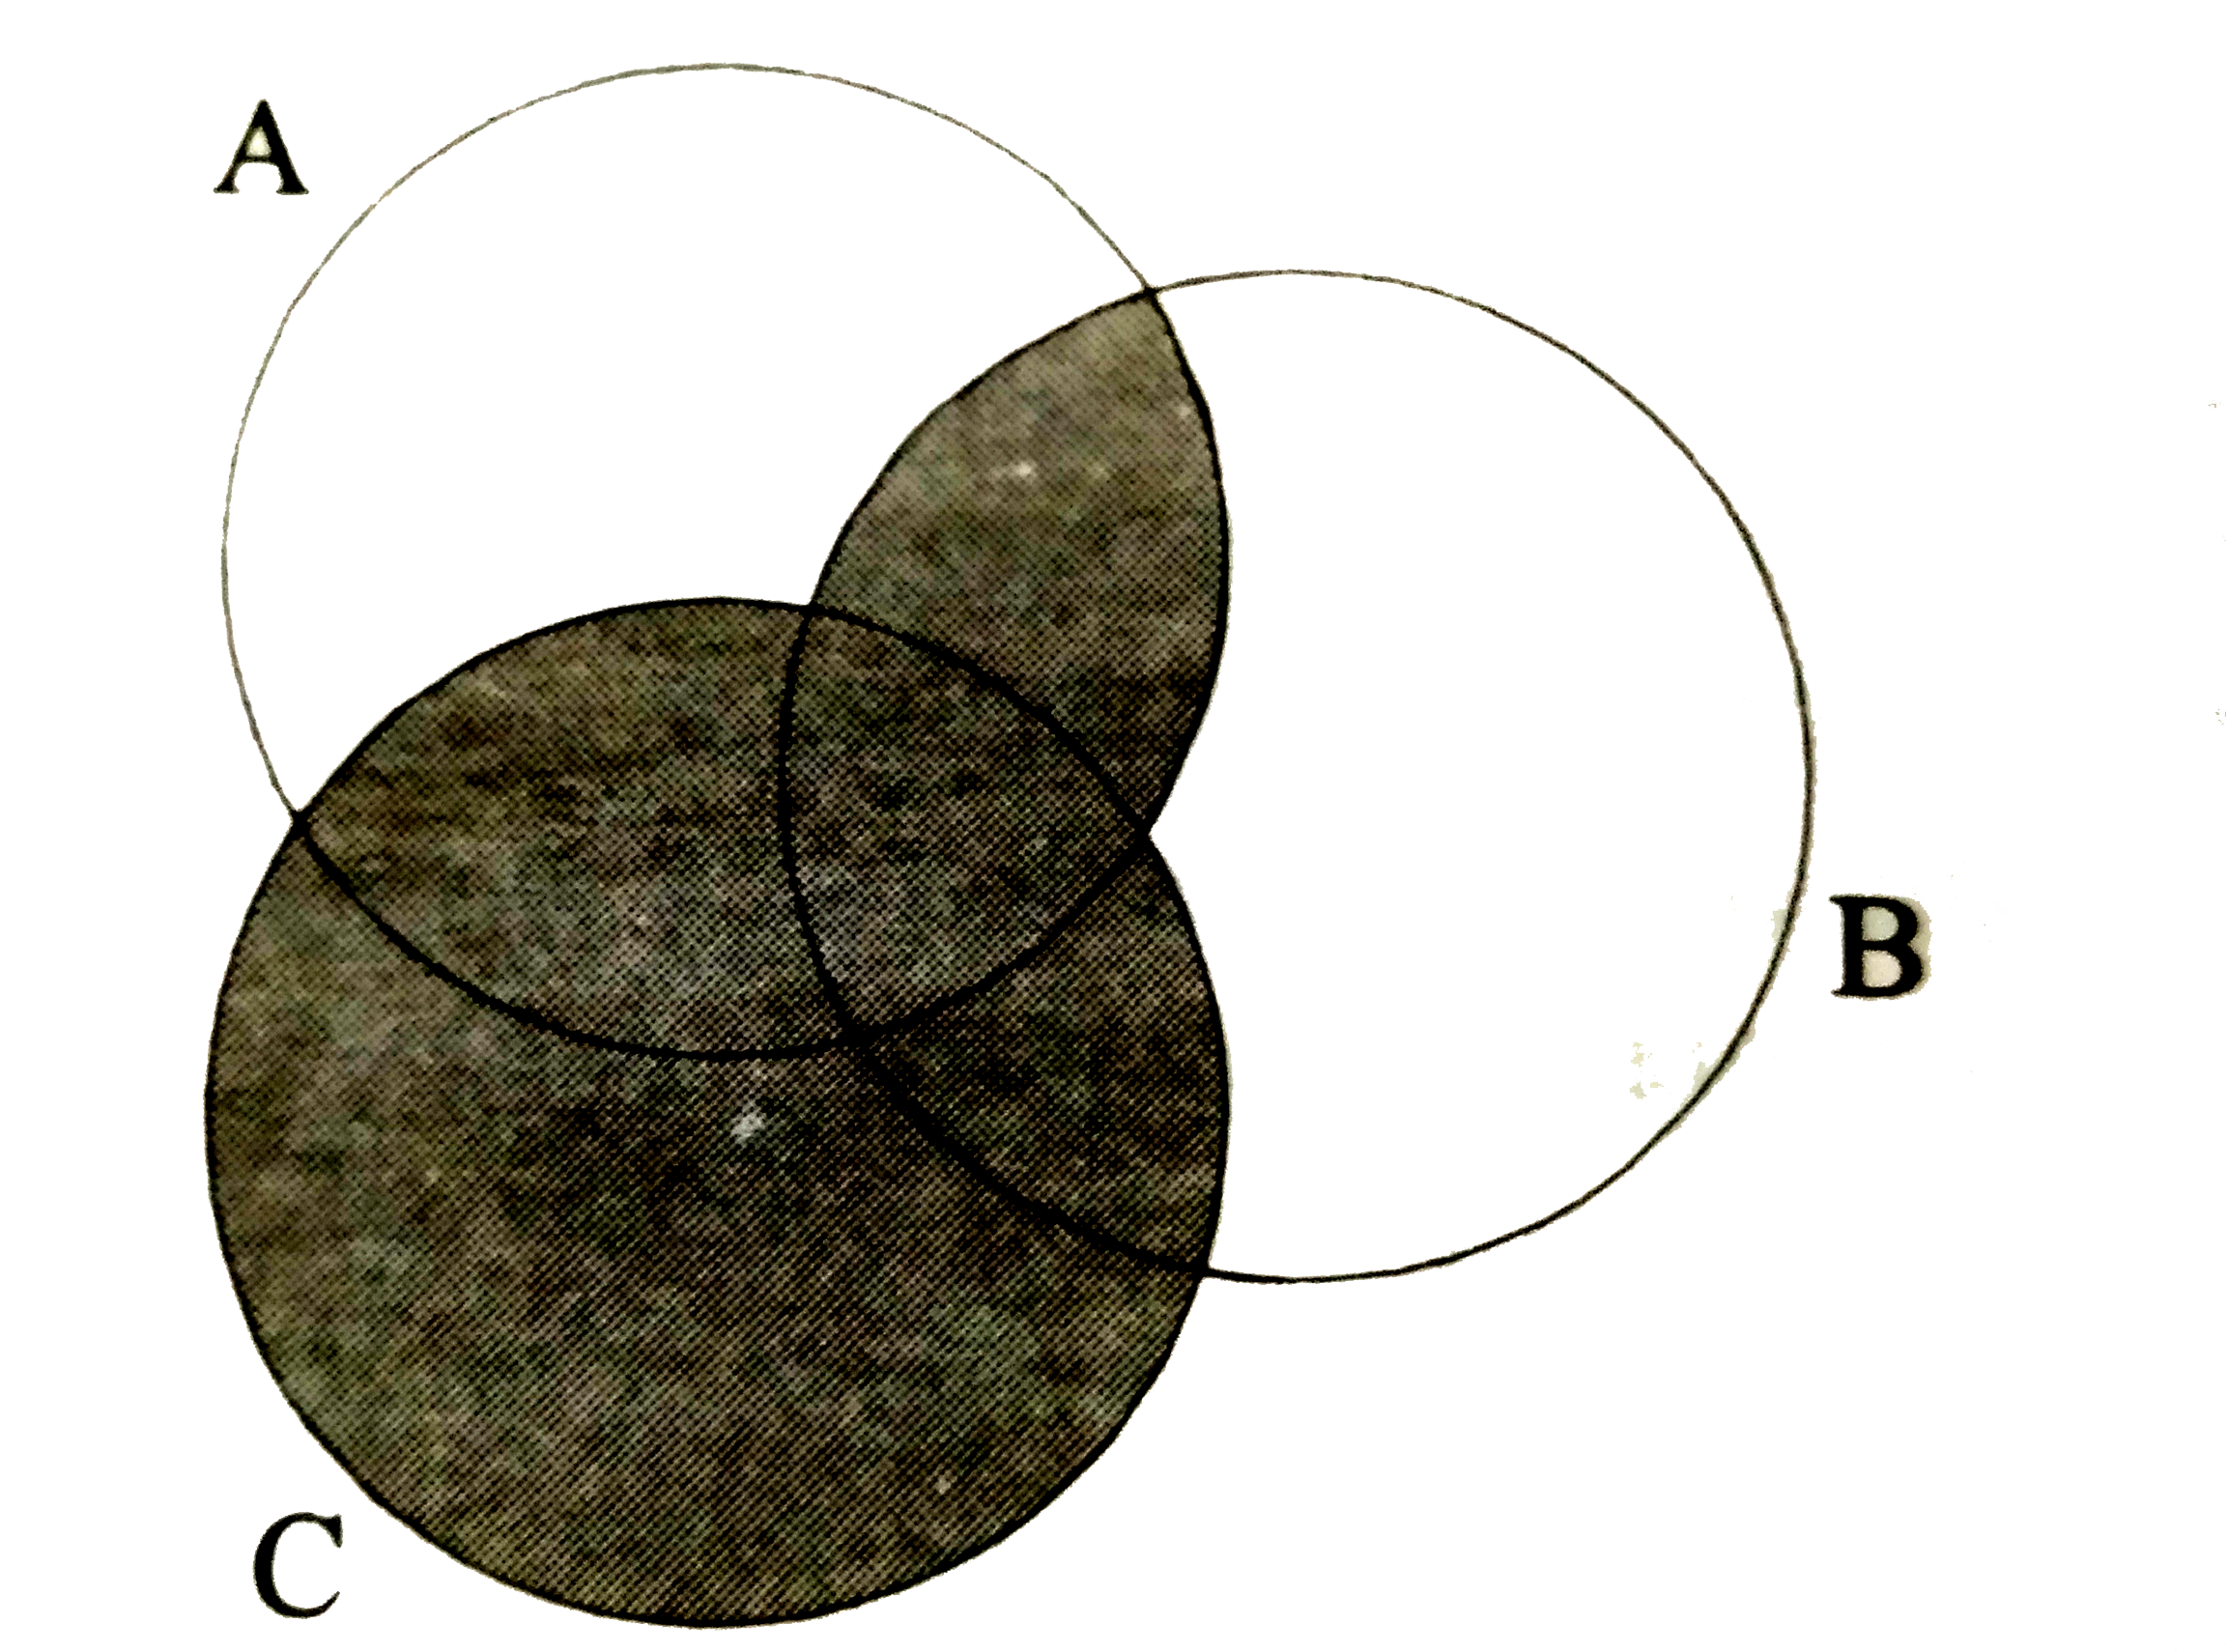
The shaded area in given Venn diagram represent
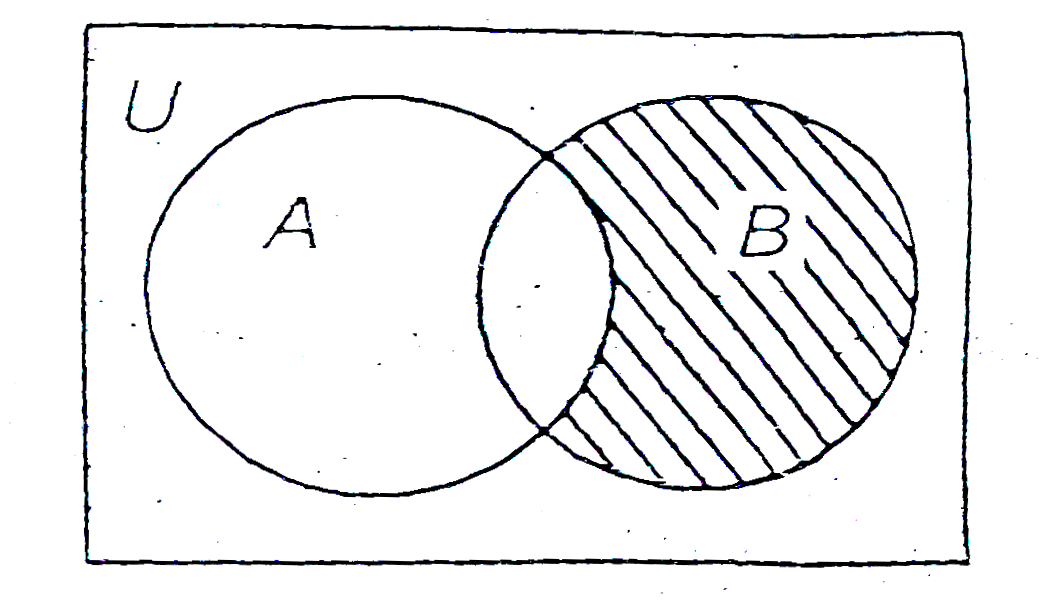
A∩B
A∪B
A-B
B-A
The correct Answer is:D
Step by step video & image solution for The shaded area in given Venn diagram represent by Maths experts to help you in doubts & scoring excellent marks in Class 12 exams.
Updated on:21/07/2023Topper's Solved these Questions
- SETS Book:AAKASH INSTITUTEChapter:SETS Exercise:SECTION-B(Objective Type Question(One option is correct))
Explore 13 Videos
- SETS Book:AAKASH INSTITUTEChapter:SETS Exercise:SECTION-C(Objective Type Questions(More than one options are correct))
Explore 6 Videos
- SETS Book:AAKASH INSTITUTEChapter:SETS Exercise:Try yourself
Explore 50 Videos
- SEQUENCES AND SERIES Book:AAKASH INSTITUTEChapter:SEQUENCES AND SERIES Exercise:Assignment (SECTION - J) Aakash Challengers
Explore 12 Videos
- STATISTICSBook:AAKASH INSTITUTEChapter:STATISTICSExercise:Section-C Assertion-Reason
Explore 15 Videos
Similar Questions
The given Venn diagram represents four sets of students who have opted for Mathematics (M) physics (P) , Chemistry (C) and Electronics (E)
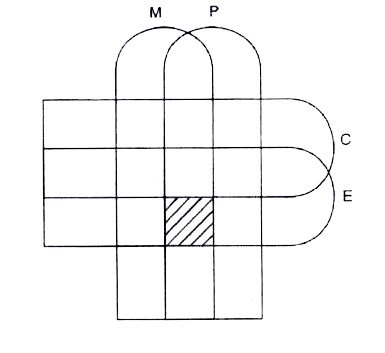
What does the shaded region represent ?
View SolutionIn the given Venn diagram, the circle represents businessmen', the triangle represents 'landlords and the rectangle represents 'income tax payers. The numbers given in the diagram represent the number of persons in that particular category.
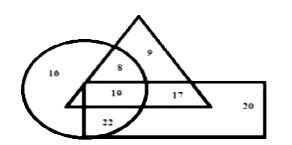
How many businessmen are tax payers but NOT landlords?
View Solution
Knowledge Check
Which of the shaded area in the diagrams below represent total utility ?
A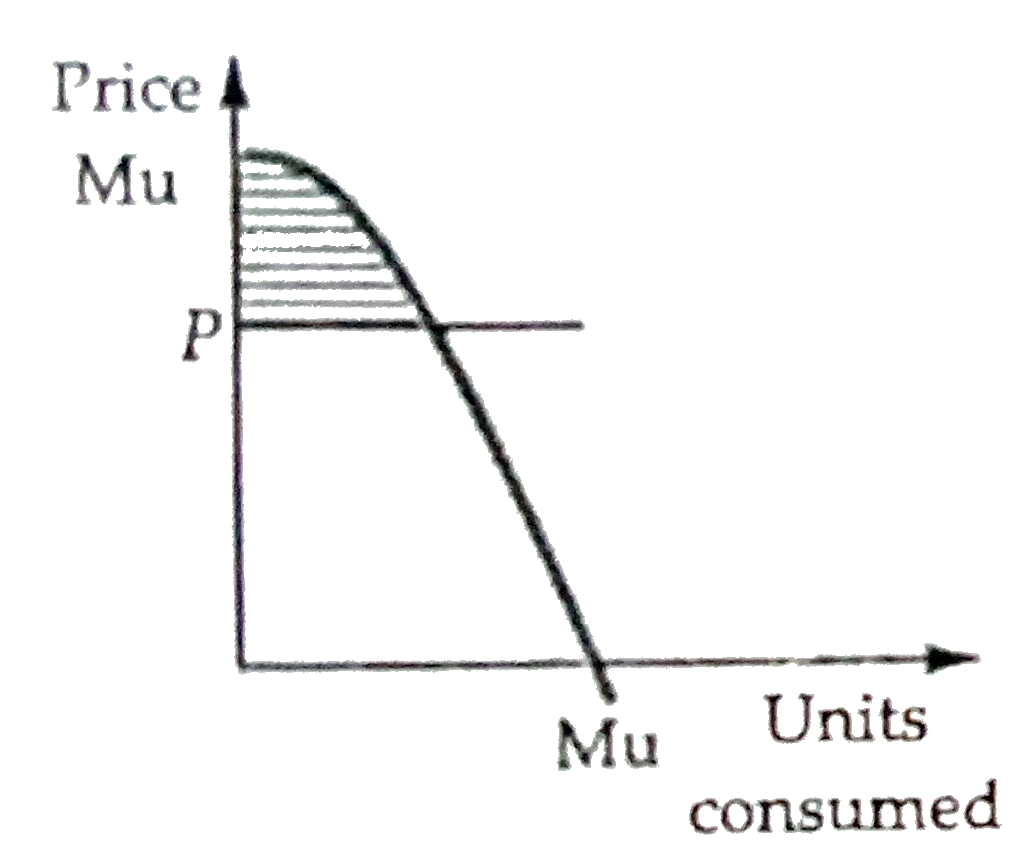 B
B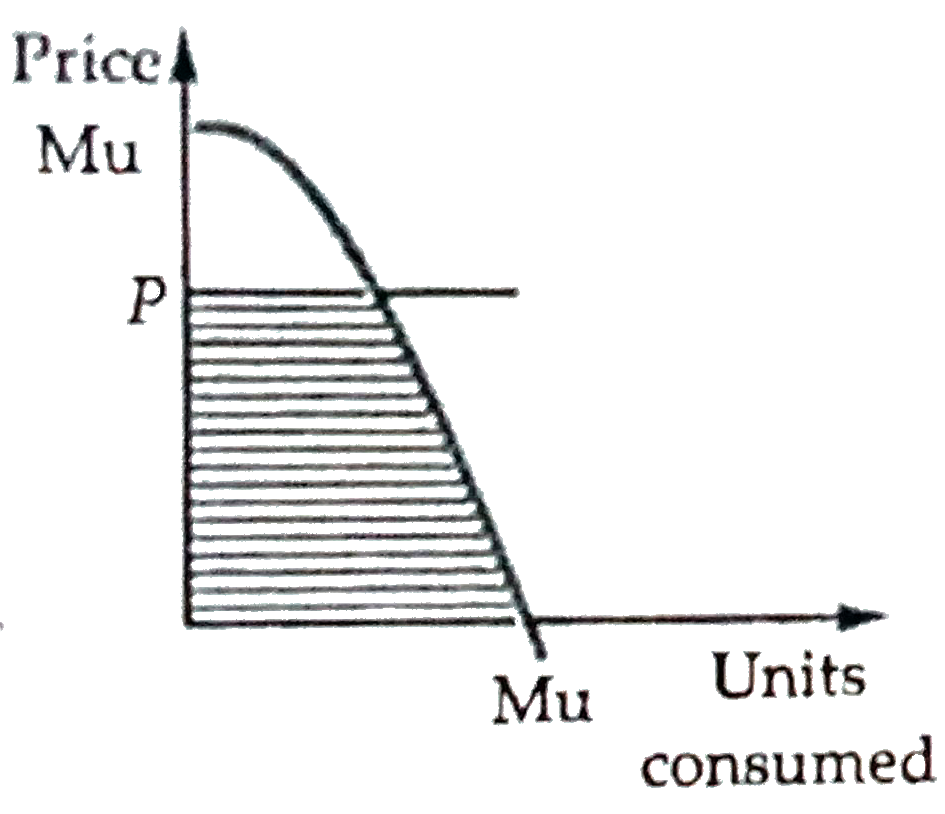 C
C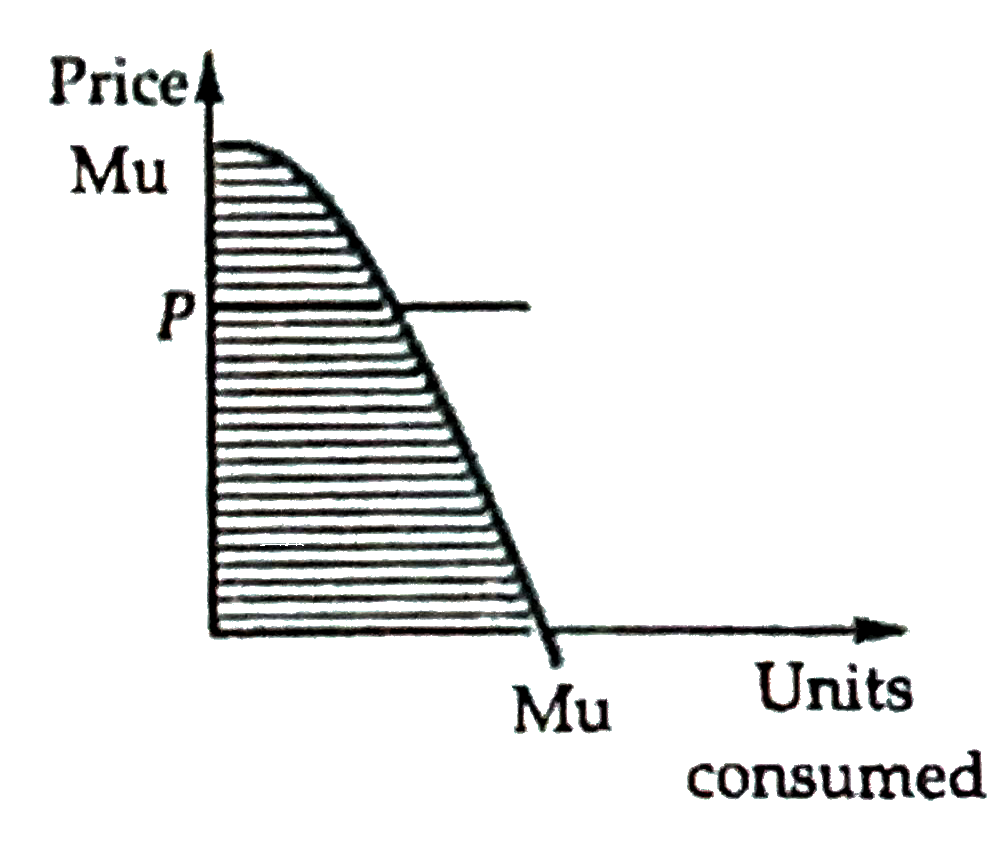 D
D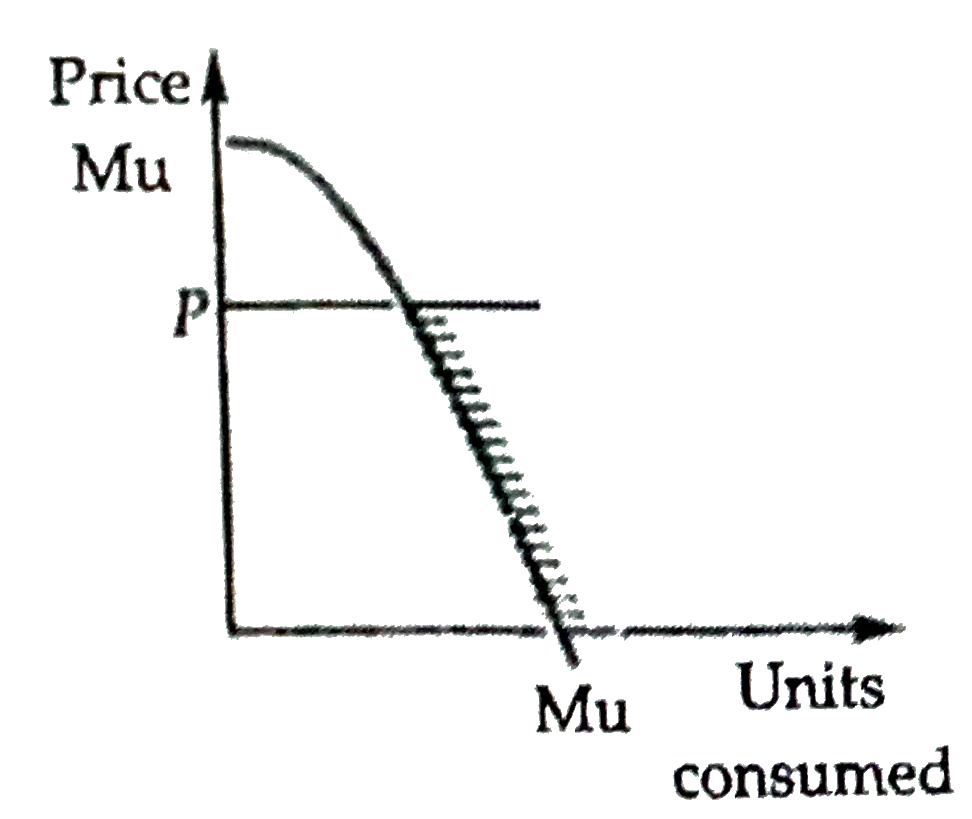
Which of the shaded area in the diagrams below represent total utility ?
A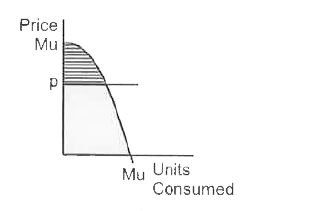 B
B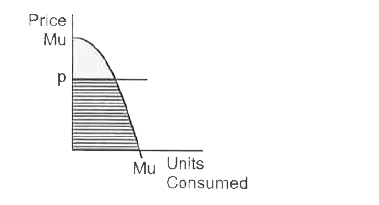 C
C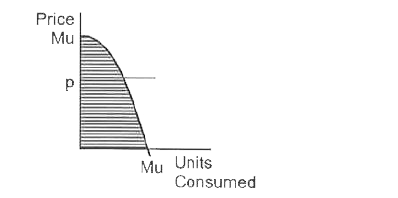 D
D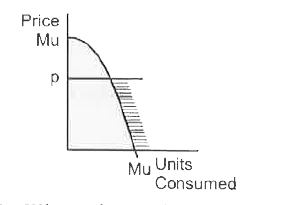
Which of the shaded area in the diagrams below represent total utility ?
A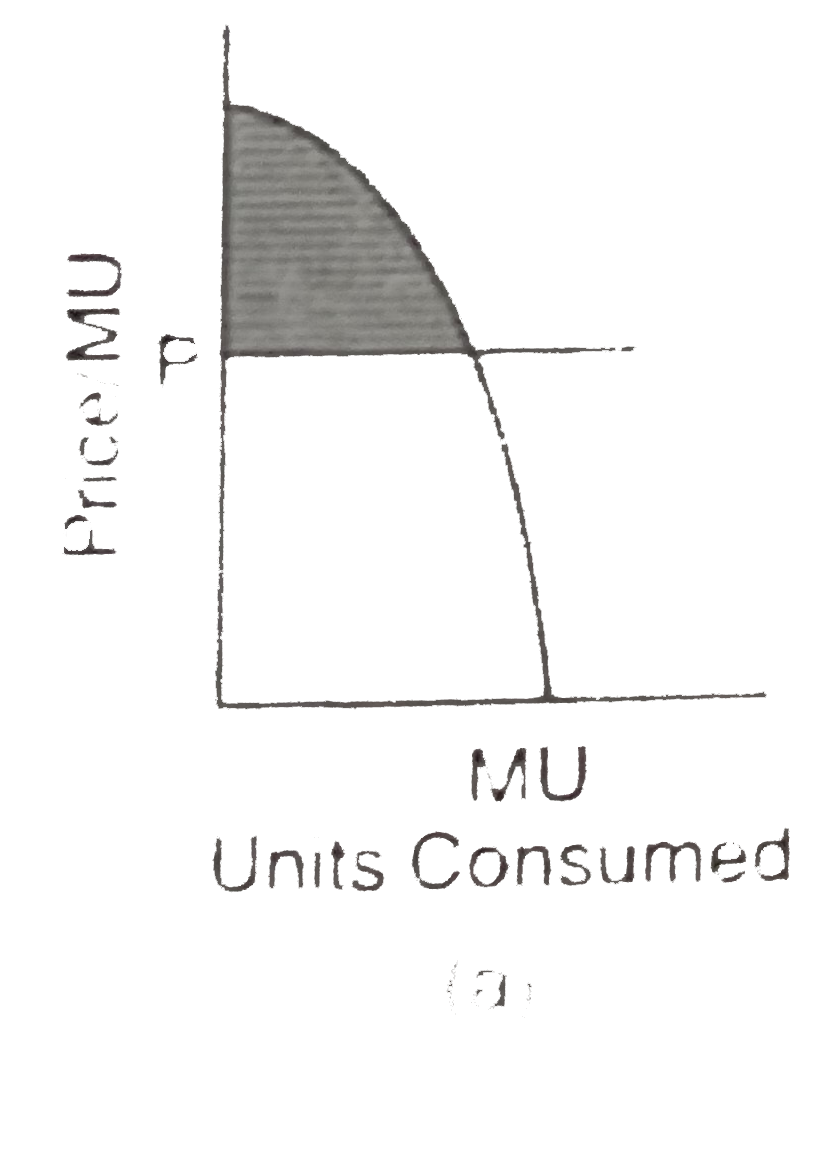 B
B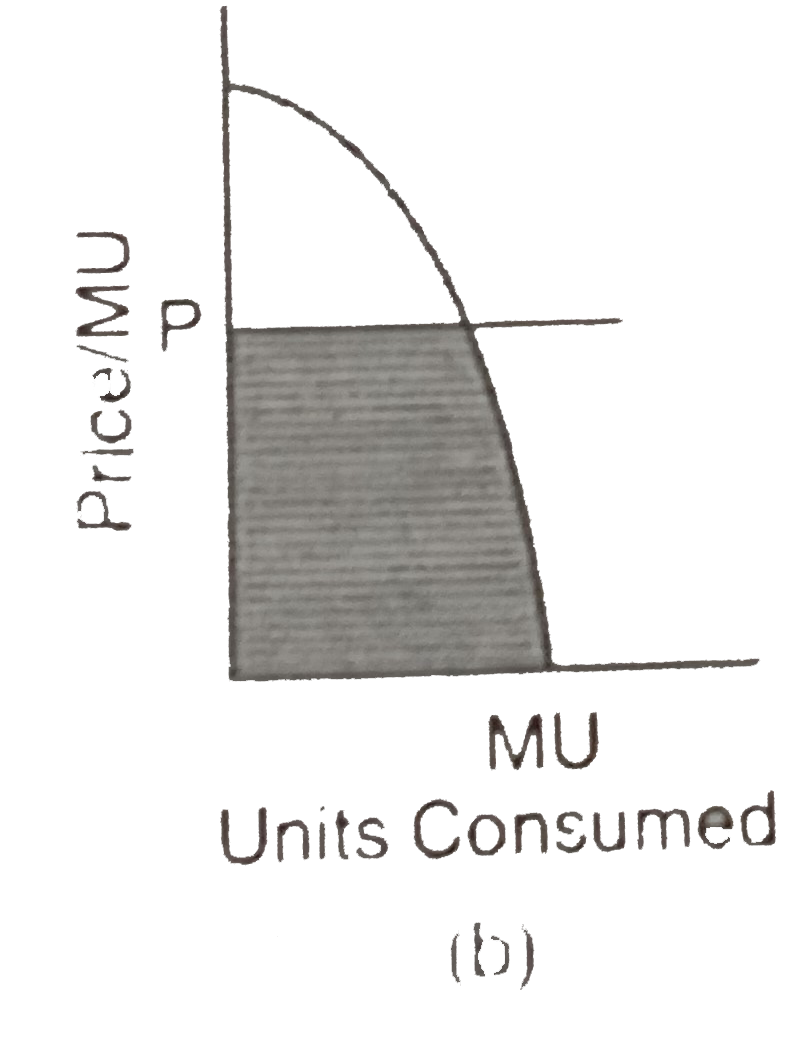 C
C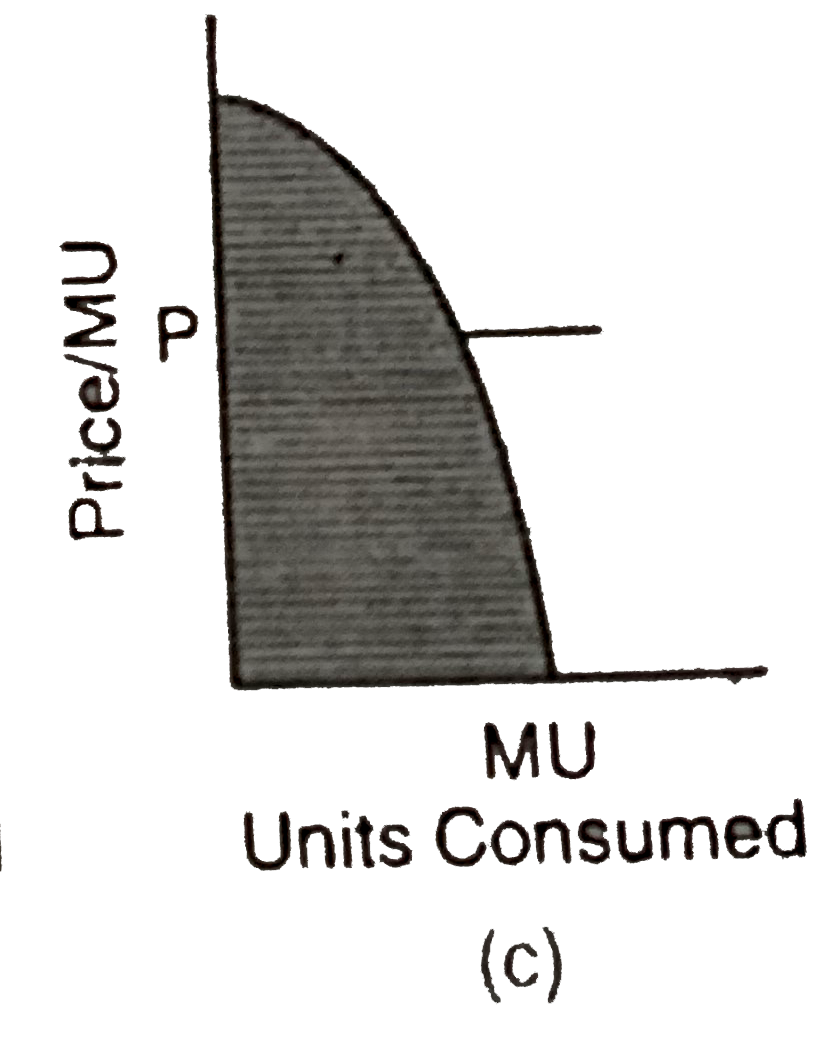 D
D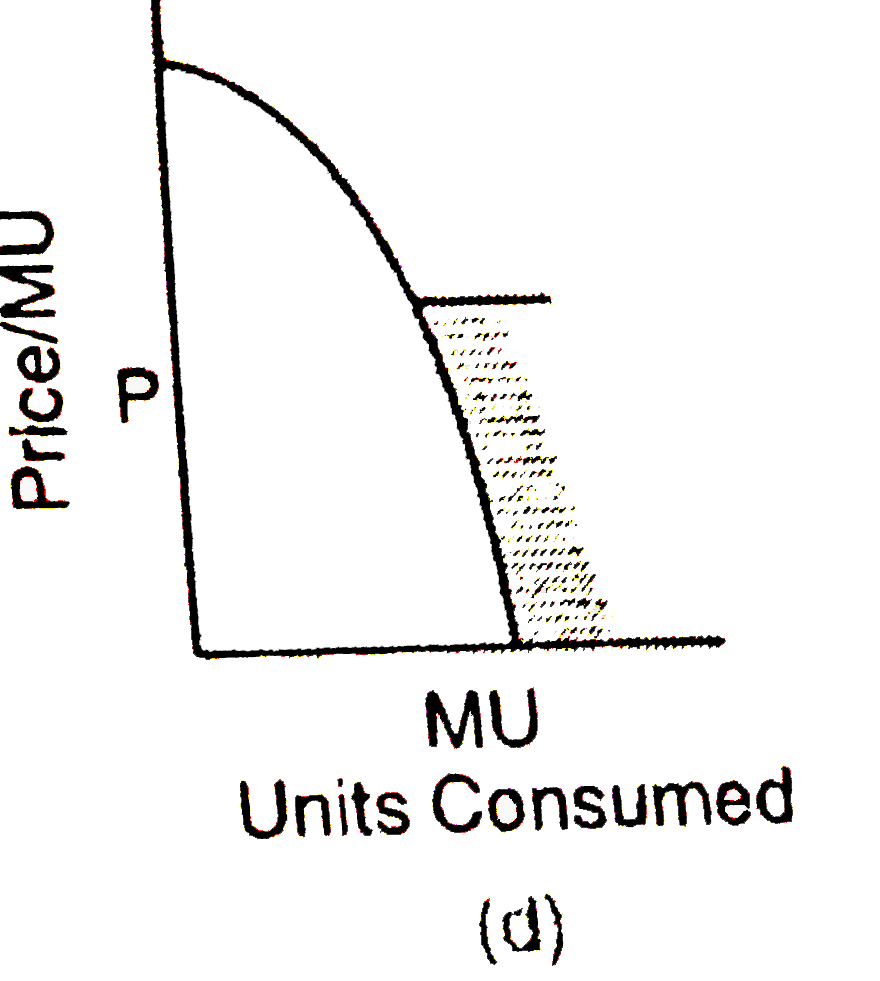
Which of the shaded area in the diagrams below represent total utility?
View Solution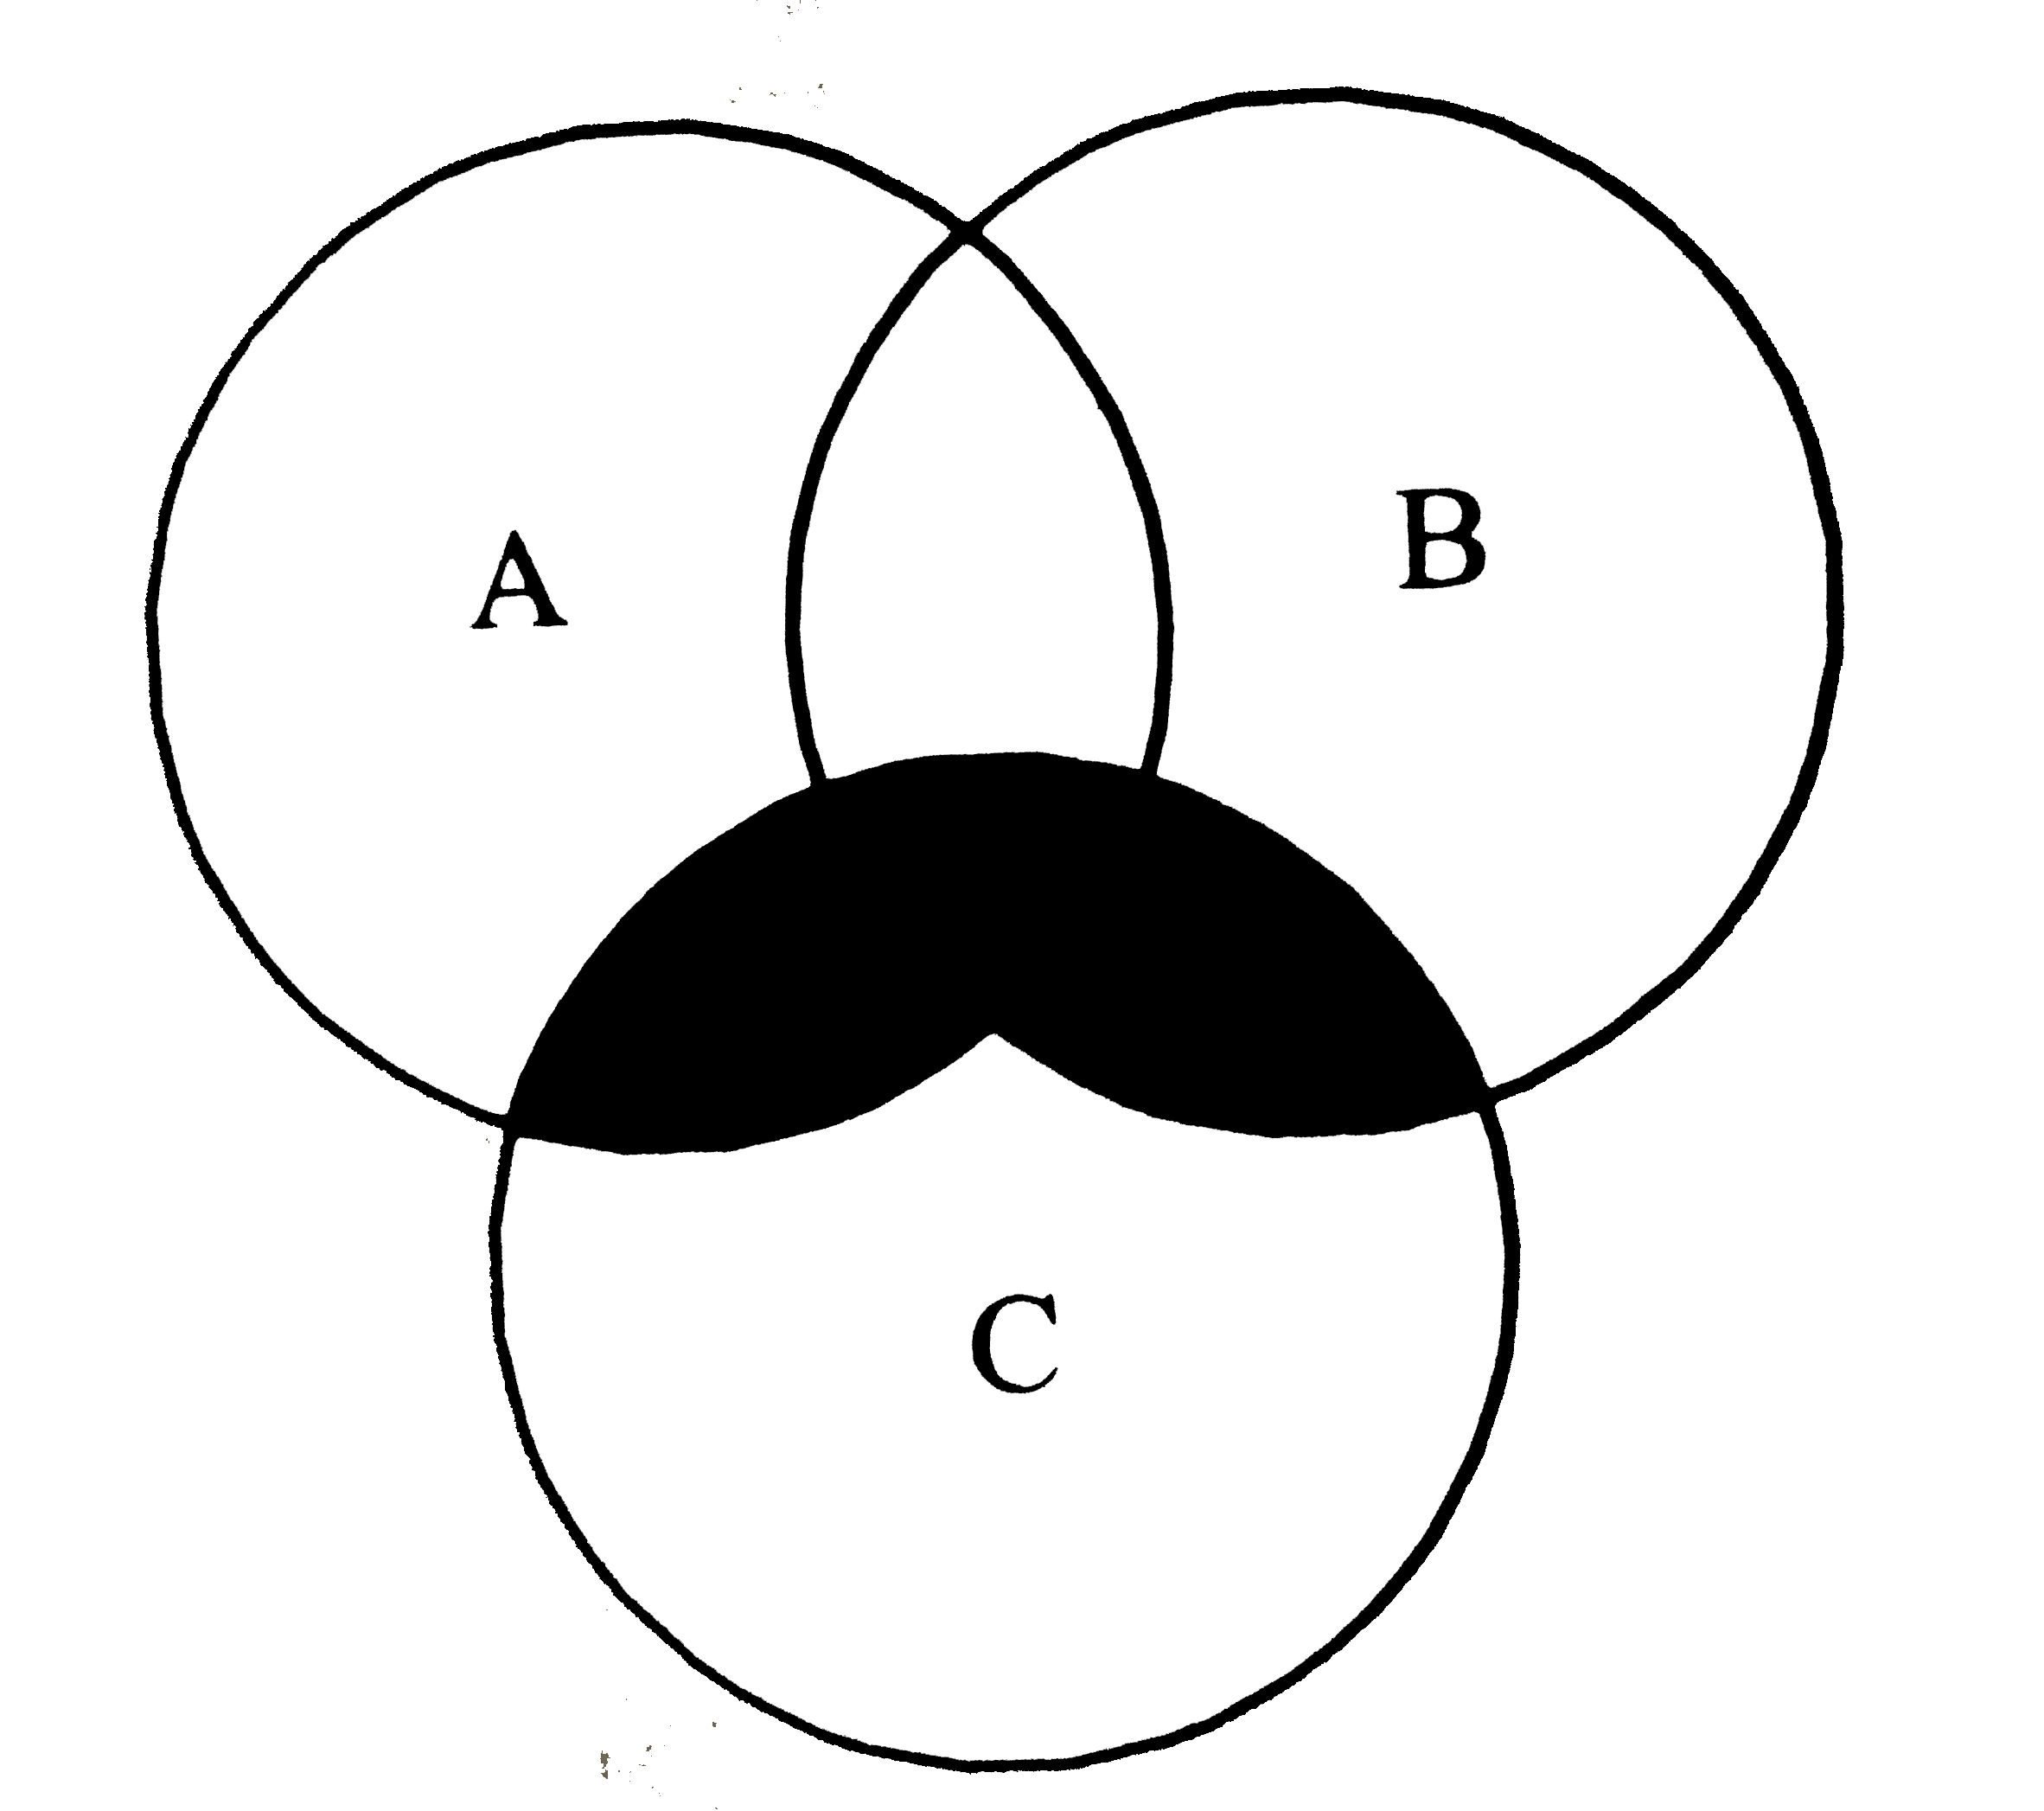
What does the shaded region in the above diagram represent?
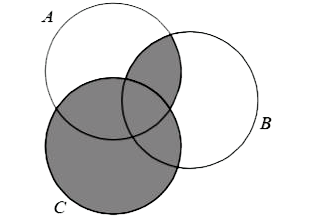
View SolutionWhat does the shaded region in the Venn diagram given below represent ?
View SolutionWhat does the shaded region in the Venn diagram given below represent ?
View SolutionIn the given Venn diagram, the ‘rectangle’ represents ‘engineers’, the ‘circle’ represents ‘managers’, and the ‘triangle’ represents ‘married’, The numbers given in the diagram represent the number of persons in that particular category.
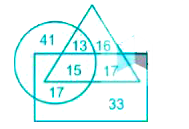
How many people are married but NOT engineers?
View Solution
