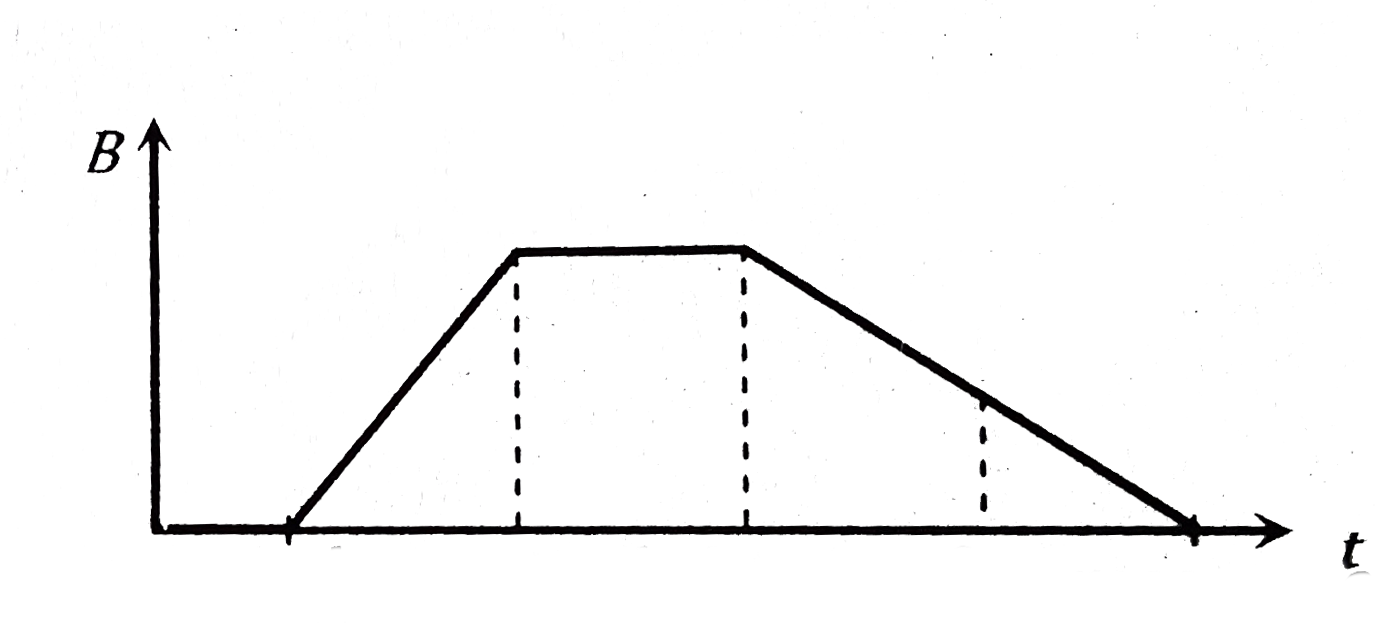
Figure shows a graph between the magnitude of magnetic field passing normally through a closed loop and tme t. Rank the five regions of the graph according to the emf in magnitude in the loop, greatest first .

AB gt CD = DE gt BC = OA
Topper's Solved these Questions
- ELECTROMAGNETIC INDUCTIONBOOK - AAKASH INSTITUTECHAPTER - ELECTROMAGNETIC INDUCTIONEXERCISE - Assignment (SECTION - A)
46 Videos
- ELECTROMAGNETIC INDUCTIONBOOK - AAKASH INSTITUTECHAPTER - ELECTROMAGNETIC INDUCTIONEXERCISE - Assignment (SECTION - B)
8 Videos
- ELECTROMAGNETIC INDUCTIONBOOK - AAKASH INSTITUTECHAPTER - ELECTROMAGNETIC INDUCTIONEXERCISE - ASSIGNMENT(SECTION -D) Assertion-Reason type Question)
15 Videos
- ELECTRIC CHARGES AND FIELDS BOOK - AAKASH INSTITUTECHAPTER - ELECTRIC CHARGES AND FIELDS EXERCISE - SECTION -J(Aakash Challengers Questions)
5 Videos
- ELECTROMAGNETIC WAVESBOOK - AAKASH INSTITUTECHAPTER - ELECTROMAGNETIC WAVESEXERCISE - ASSIGNMENT SECTION - D Assertion-Reason Type Questions
25 Videos
Similar Questions
Figure shows a graph between the magnitude of magnetic field passing normally through a closed loop and time t. Rank the five region's of the graph according to the emf in magnitude indụced in the loop, greatest first.
View SolutionThe graph gives the magnitude B(t) of a uniform magnetic field that exists throughout a conductig loop, perpendicular to the plane of the loop. Rank the five regions of the graph according to the magnitude fo the emf induced in the loop, greater first

View Solution
Knowledge Check
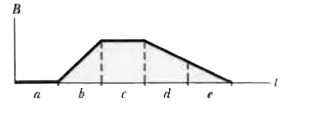
The graph gives the magnitude B (t) of a uniform magnetic field that exists throughout a conducting loop, perpendicular to the plane of the loop. Rank the five regions of the graph according to the magnitude of the emf induced in the loop, greatest first
 Ab>(d=e)<(a=c)Bb<(d=e)>(a=c)Cb<d<e<c<aDb>(a=c)>(d=e)
The graph gives the magnitude B(t) of a uniform magnetic field that exists throughout a conductig loop, perpendicular to the plane of the loop. Rank the five regions of the graph according to the magnitude fo the emf induced in the loop, greater first
 Ab>(d=e)<(a=c)Bb>(d=e)>(a=c)Cb<d<e<c<aDb>(a=c)>(d=e)
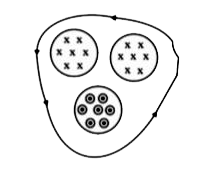
As shown in the above figure, a loop surrounds three regions of the magnetic field where the magnitude of the magnetic field is decreasing at a constant rate a. Take the area of each region as A. Now find the
∮→E.→dl along the given loop, where →E is the induced electric field.AαAB−αAC3αAD−3αA
The graph gives the magnitude B(t) of a uniform magnetic field that exists throughout a conducting loop, with the direction of the field perpendicular to the plane of the loop. Rank the five regions of the graph according to the magnitude of the emf induced in the loop, greatest first.
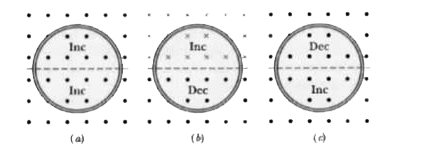
View SolutionThe figure shows three situations in which identical circular conducting loops are in uniform magnetic fields that are either increasing (Inc) or decreasing (Dec) in magnitude at identical rates. In each, the dashed line coincides with a diameter. Rank the situations according to the magnitude of the current induced in the loops, greatest first.
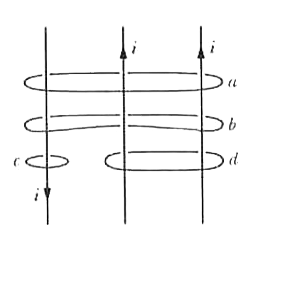
View SolutionThe figure here shows three equal currents i (two parallel and one antiparallel) and four Amperian loops. Rank the loops according to the magnitude of ∮ along each, greatest first.
View SolutionFigure shows a conducting loop placed in a magnetic field. The flux through the loop changes due to change in magnetic field according to the equation ϕ=5t−10t2. What is the direction and magnitude of induced current at t=0.25s?

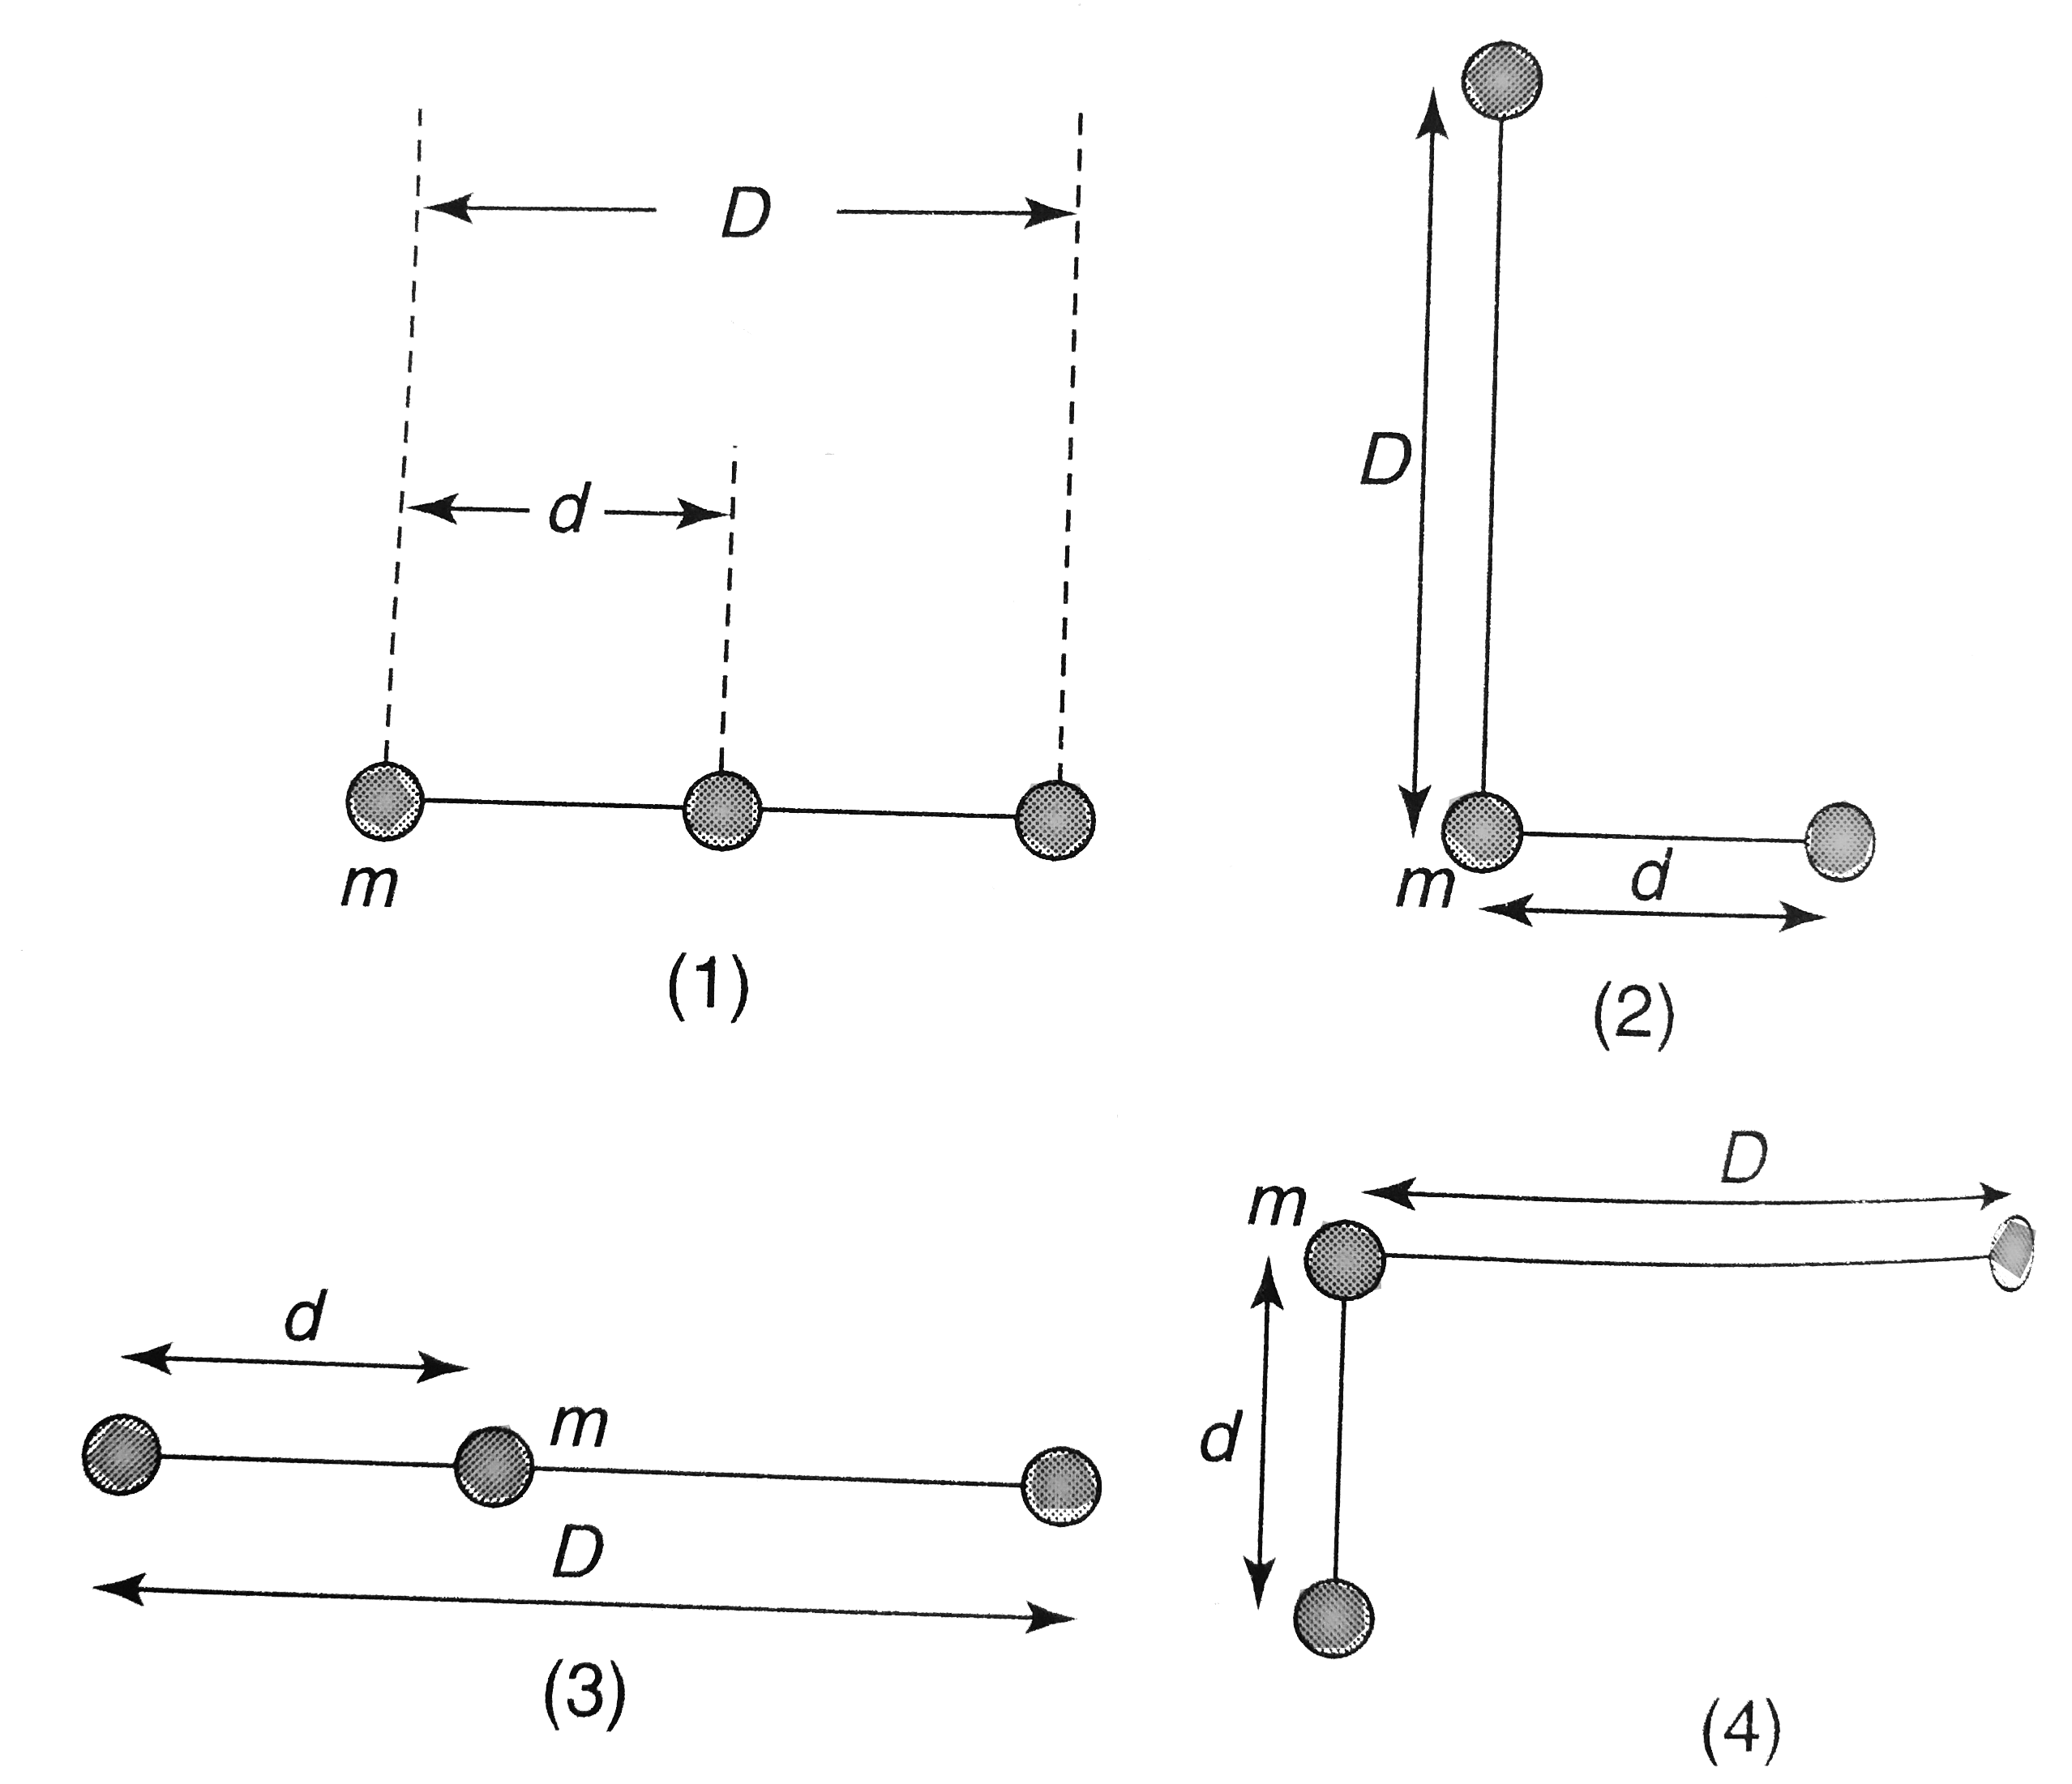
View SolutionThe figure shows four arrangement of three particles of equal masses. Rank the arrangement according to the magnitude of the net gravitational force on the particle m, greatest first.
View Solution
