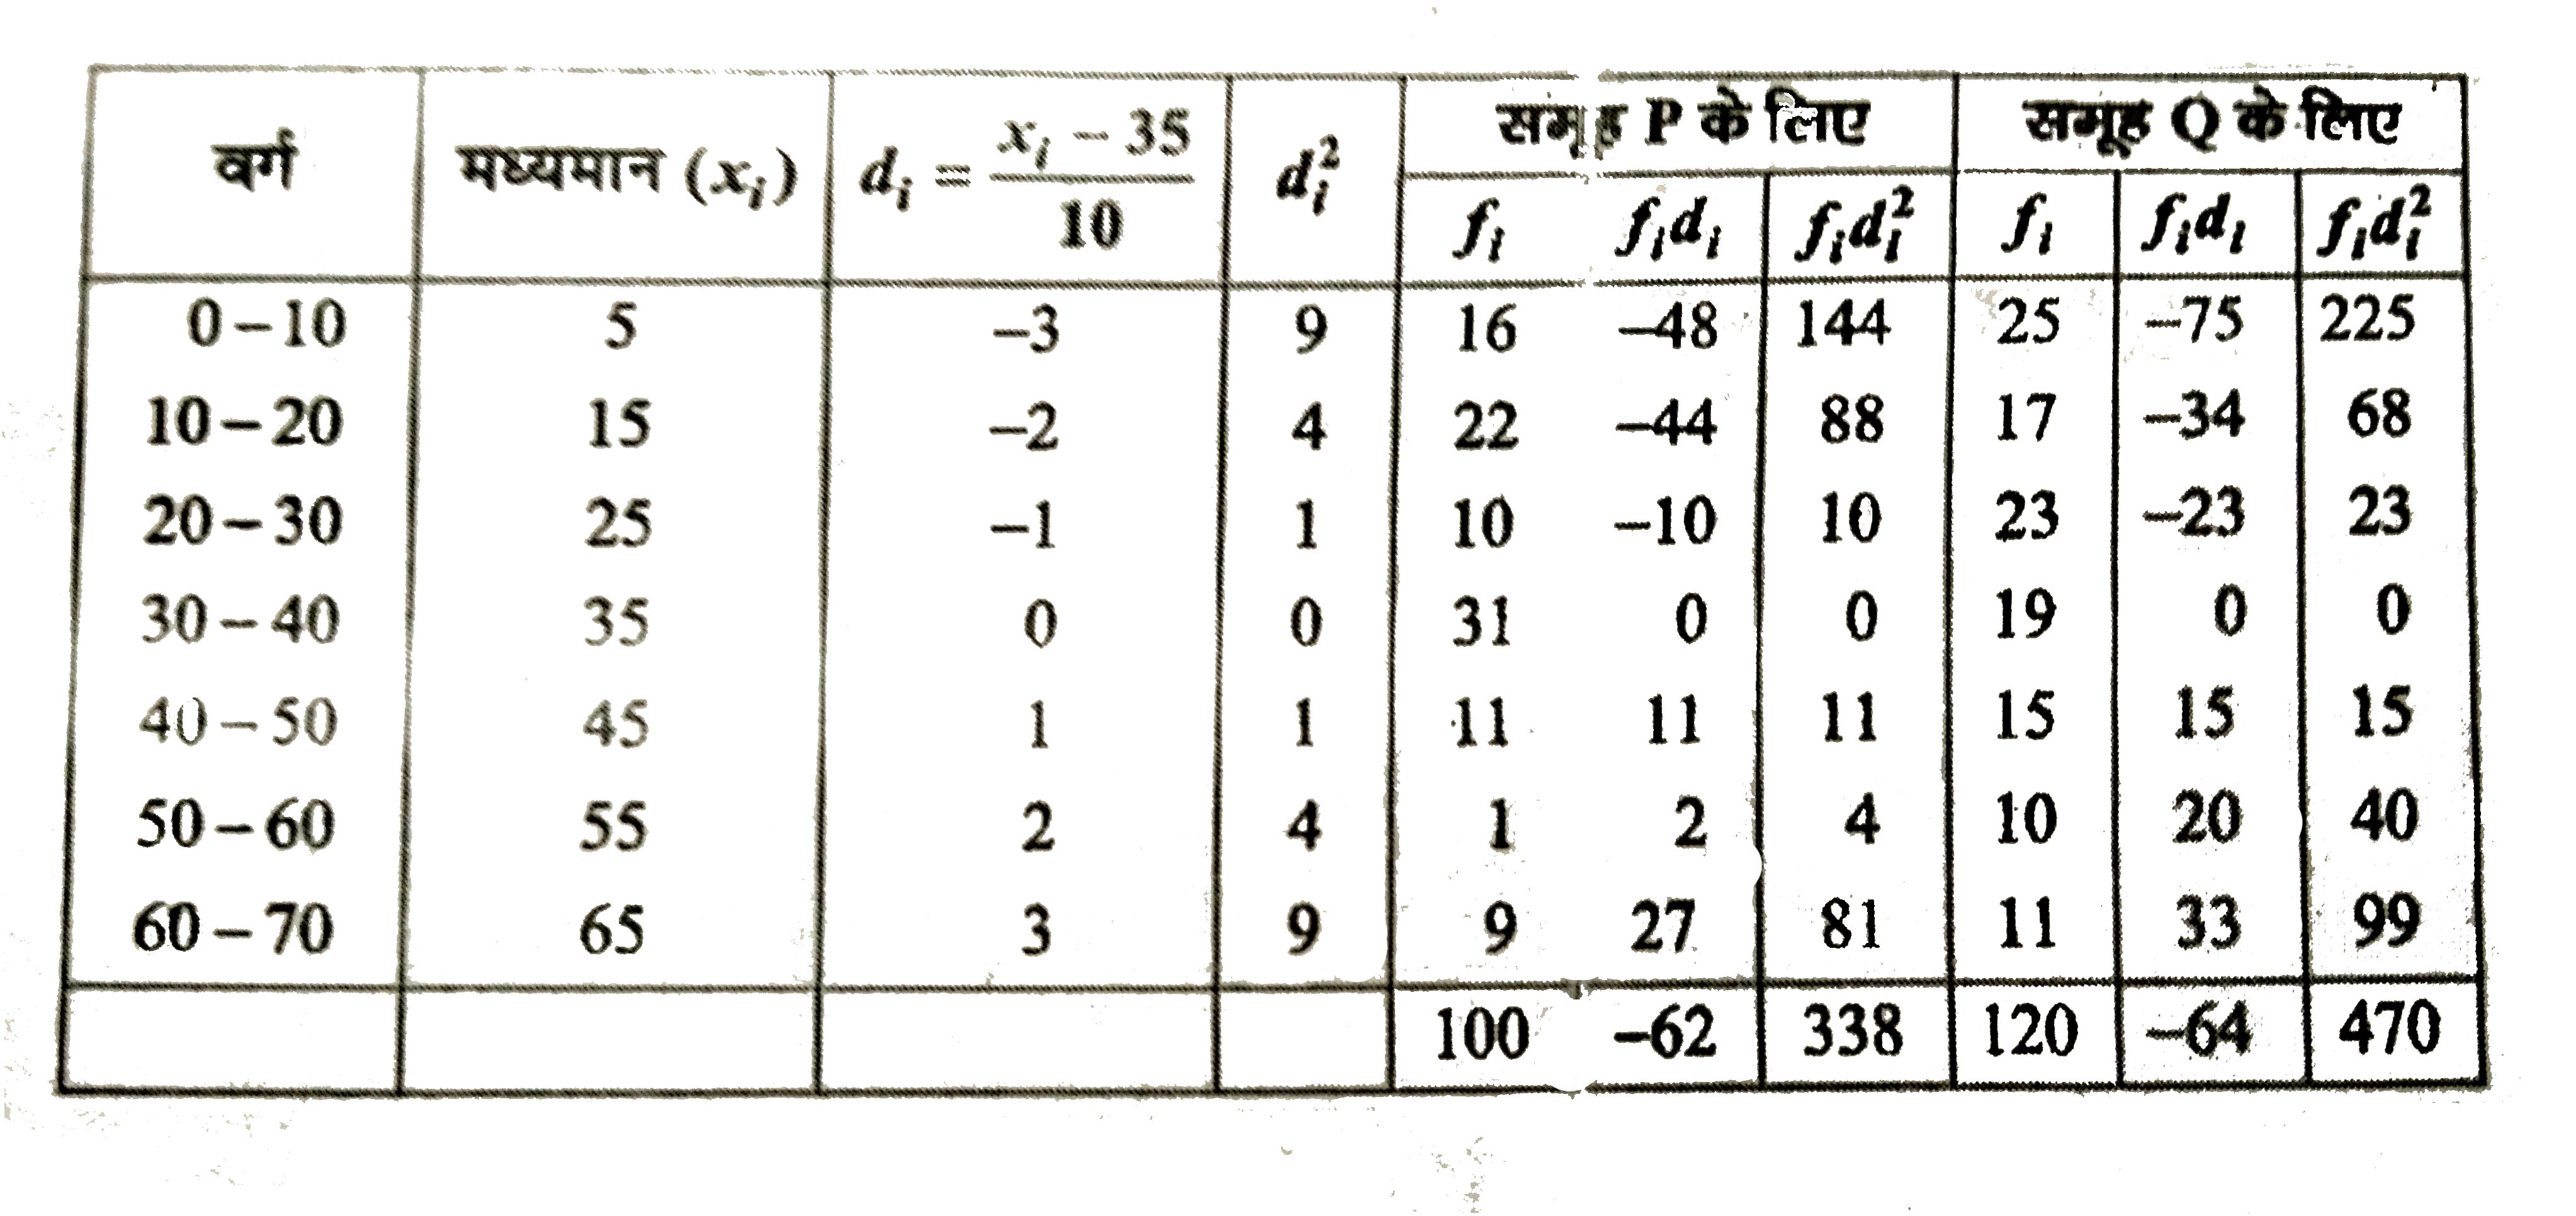
निम्नलिखित सारणी में आँकड़े दिए गए है । बताइए कि कौन - सा समूह विचरणशील है :

मान लीजिए कल्पित माध्य , A = 35 .

समूह p के लिए :
¯x=A+∑fidi∑fi×h=35+=62100×20
=35−6.2=28.8
σ2=h2N2[N∑fid2i−(∑fidi)2]
=10010000[100×338−(−62)2]
=1100[33800−3844]=299.56
σ=√299.56=17.31
विचलन गुणांक =σx×100=17.3128.8×100=60.10.
समूह Q के लिए :
¯x=A+∑fidi∑fi×h
=35−64120×10=35−5.3=29.7
σ2=h2N2[N∑fid2i−(∑fidi)2]
=10014400[120×470−(−64)2]
=1144[56400−4096]
=52304144=363.22=√363.22=19.06
विचलन गुणांक =σ¯x×100=19.0629.7×100=61.18.
अतः समूह Q का विचलन गुणांक समूह P से अधिक है । इसलिए समूह Q , समूह P से अधिक है । इसलिए समूह Q , समूह P की अपेक्षा अधिक विचरणशील है ।
Topper's Solved these Questions
- सांख्यिकीBOOK - MANOHAR RAYCHAPTER - सांख्यिकीEXERCISE - प्रश्नावली 15(A)
22 Videos
- सांख्यिकीBOOK - MANOHAR RAYCHAPTER - सांख्यिकीEXERCISE - प्रश्नावली 15 (A)
3 Videos
- सरल रेखाएँBOOK - MANOHAR RAYCHAPTER - सरल रेखाएँEXERCISE - प्रश्नावली 10(D)
28 Videos
- सीमा और अवकलन BOOK - MANOHAR RAYCHAPTER - सीमा और अवकलन EXERCISE - प्रश्नावली 13(C)
13 Videos
Similar Questions
निम्नलिखित आँकड़ों के लिए माध्य के सापेक्ष माध्य विचलन ज्ञात कीजिए :
11, 5, 8, 10, 13, 15, 12, 1, 3, 7, 4, 0, 17, 9, 5
View Solutionआँकड़ों के लिए माध्य के सापेक्ष माध्य विचलन ज्ञात कीजिए :

View Solution(1 ,2 ) तथा (3 ,7 ) बिन्दुओ से जाने वाली रेखा की ढाल है -
View Solutionनिम्न फलनों के x साक्षेप अवकल - गुणांक प्रथम सिद्धांत से ज्ञात कीजिए :
(i) x3 (ii) −x
(iii) (−x)−1 (iv) √3
(v) 1x2 (vi) x3−27 (vii) (x−1)(x−2) (viii) x+1x−1
View SolutionHow many lines of symmetry does the above figure have ?
View SolutionWhich of the following are correct chain isomers of butane ? (i)
View SolutionDetermine the point of symmetry of a regular hexagon.
View SolutionDtermine the images of the following figure about the given line :
View SolutionMatch the following Column A to Column B

View SolutionMatch the following Column A to Column B

View SolutionMatch the following Column A to Column B

View SolutionFind the area of the figure given below.

View SolutionThe area of the shaded part in the figure given below is ______.

View SolutionThe inequation represented by the graph given below is :
View SolutionThe inequation that best describes the graph given below is _________
View SolutionThe inequation that best describes the following graph is _________
View Solution
