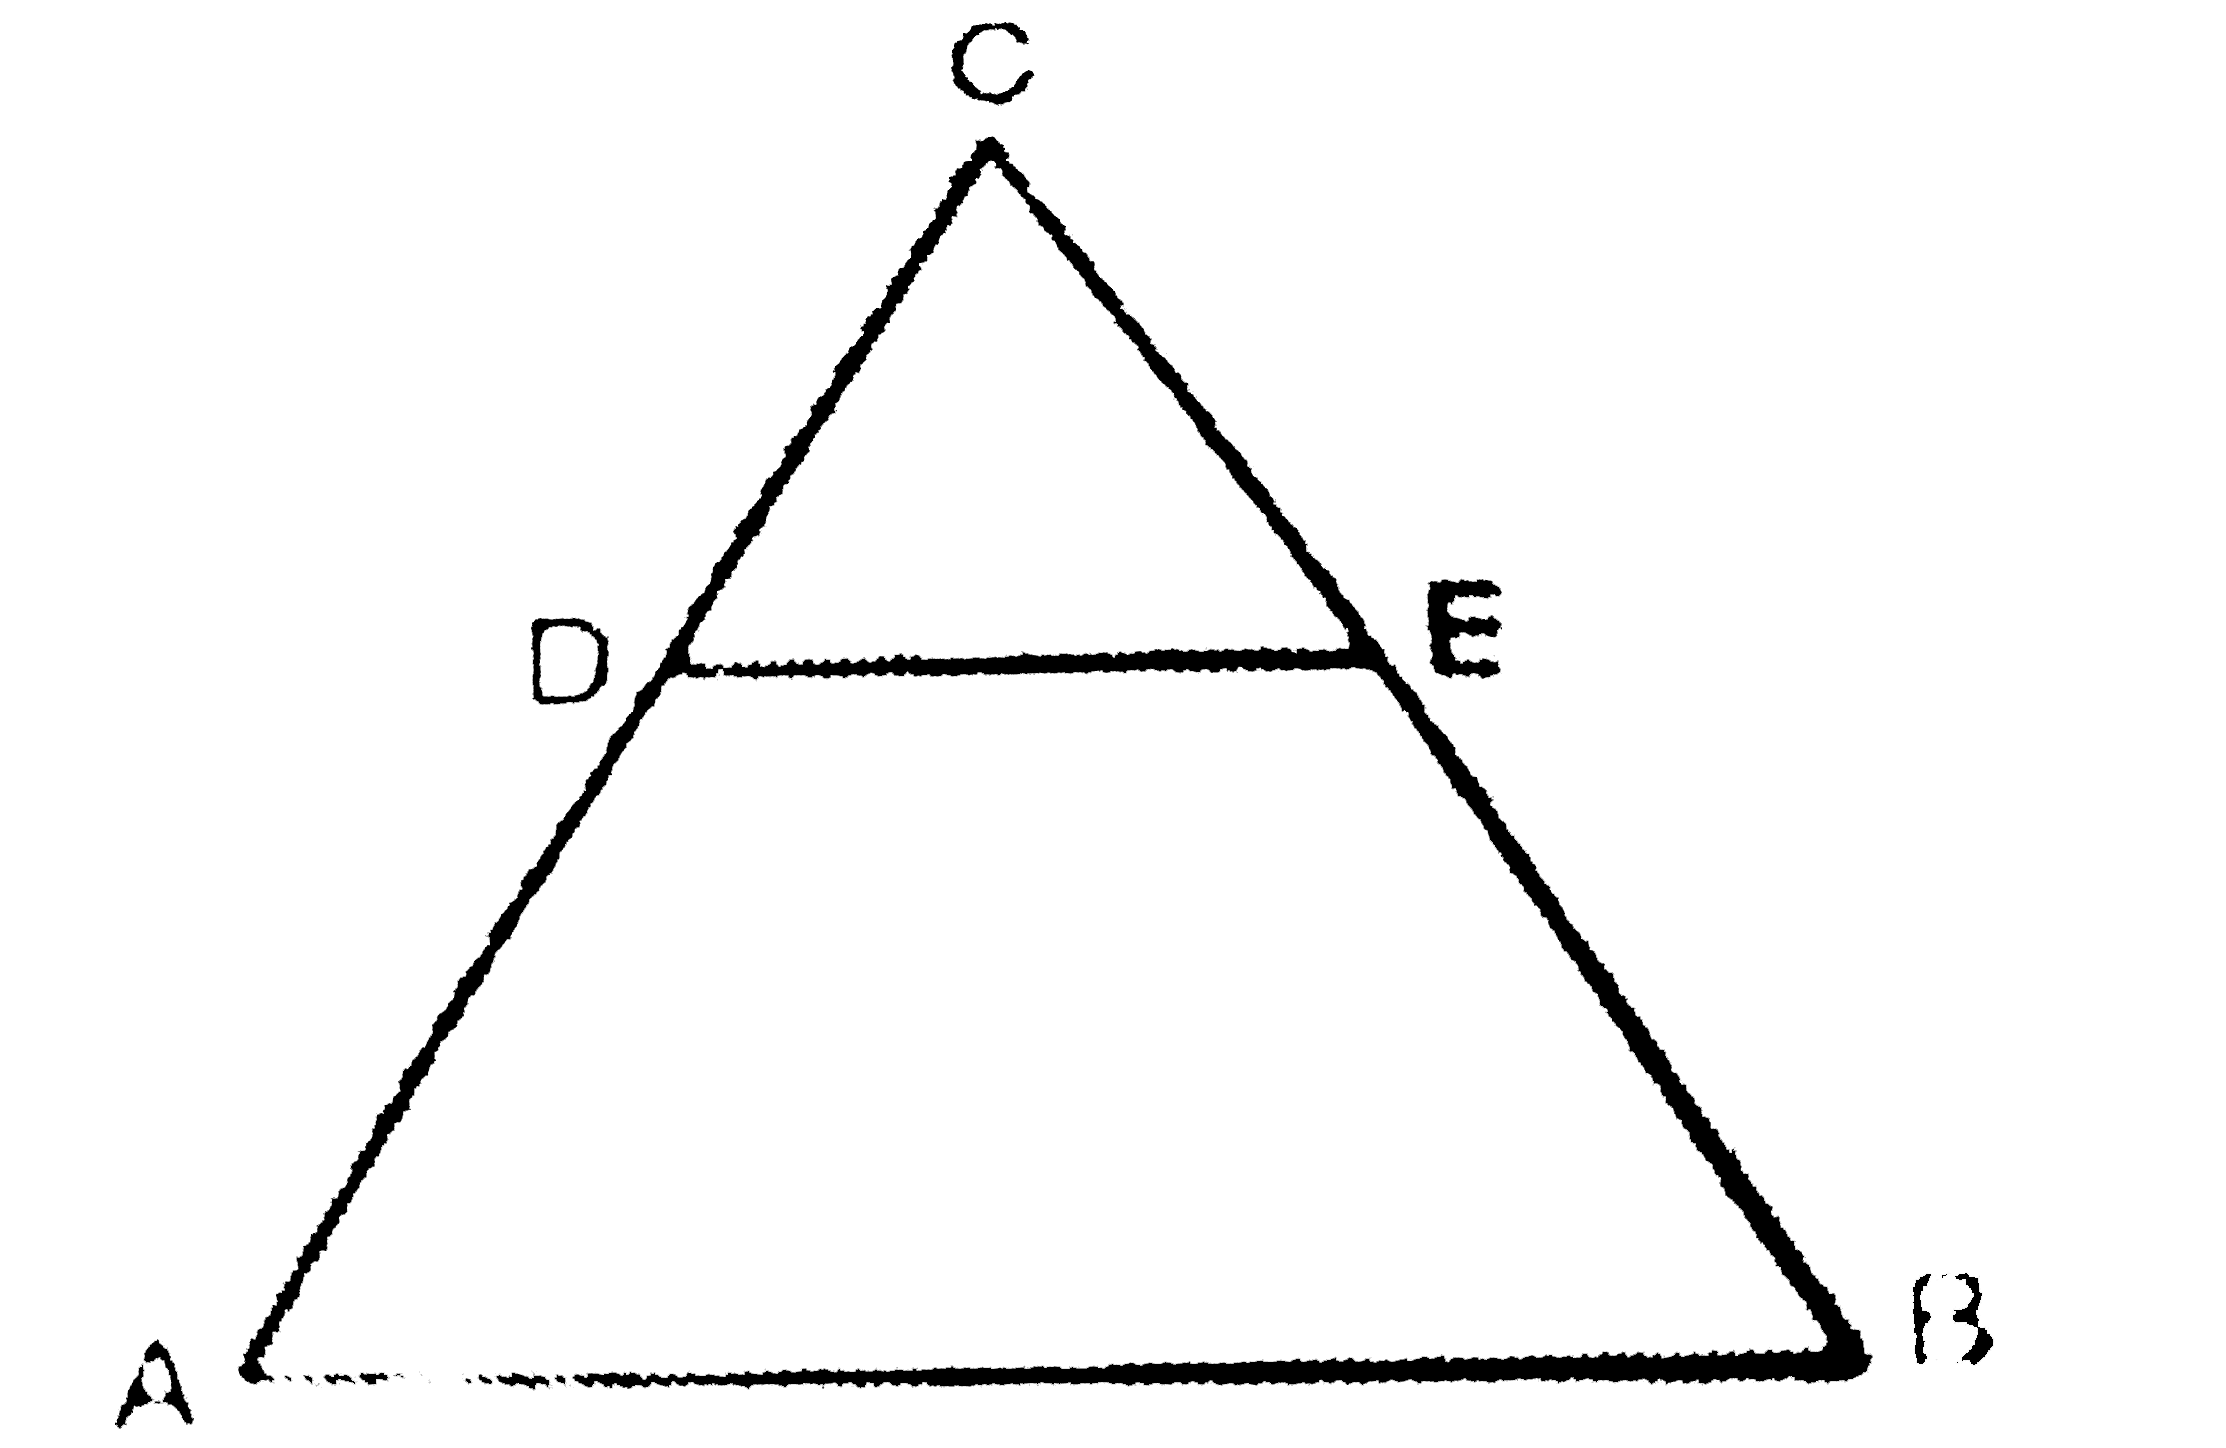
ΔABC में CA और CB के मध्य बिन्दुओं को मिलाने वाली रेखा DE है । यदि DE = 3 सेमी हो , तो AB की माप होगी :

4 सेमी
5 सेमी
6 सेमी
9 सेमी |
The correct Answer is:C
Step by step video & image solution for DeltaABC में CA और CB के मध्य बिन्दुओं को मिलाने वाली रेखा DE है । यदि DE = 3 सेमी हो , तो AB की माप होगी : by Maths experts to help you in doubts & scoring excellent marks in Class 10 exams.
Updated on:21/07/2023Topper's Solved these Questions
- त्रिभुज BOOK - MANOHAR RAYCHAPTER - त्रिभुज EXERCISE - प्रश्नावली 6(E)
24 Videos
- त्रिकोणमिति के कुछ अनुप्रयोगBOOK - MANOHAR RAYCHAPTER - त्रिकोणमिति के कुछ अनुप्रयोगEXERCISE - लघु उत्तरीय
2 Videos
- दो चार वाले रैखिक समीकरण युग्मBOOK - MANOHAR RAYCHAPTER - दो चार वाले रैखिक समीकरण युग्मEXERCISE - प्रश्नावली 3(I)
20 Videos
Similar Questions
कुछ त्रिभुजों की भुजाएँ दी गई हैं । निर्धारित कीजिए कि इनमें से कौन - कौन से त्रिभुज समकोण त्रिभुज हैं । इस स्तिथि में कर्ण कि लम्बाई भी लिखिए :
(i) 7 सेमी , 24 सेमी , 25 सेमी
(ii) 3 सेमी ,8 सेमी , 6 सेमी
(iii) 50 सेमी , 80 सेमी , 100 सेमी
(iv) 13 सेमी , 12 सेमी , 5 सेमी
View Solutionएक नहर के एक तट पर एक टीवी टॉवर ऊर्ध्वाधर : खड़ा हैं । टॉवर के ठीक सामने दूसरे के एक अन्य बिंदु से टॉवर शिखर का उन्नयन कोण 60∘ है। इसी तट पर इस बिन्दु से 20 m दूर और इस बिंदु को मीनार के पाद से मिलाने वाली रेखा पर स्थित एक अन्य बिन्दु से टॉवर के शिखर का उन्नयन कोण 30∘ है (देखिए आकृति) । टॉवर की ऊँचाई और नहर की चौड़ाई ज्ञात कीजिए ।

View Solutionसमीकरण 8x+5y=11 को संतुष्ट करने वाले बिन्दु के निर्देशांक है :
View SolutionIdentify the cell organelle 'A' :-
ltimg src="https://d10lpgp6xz60nq.cloudfront.net/physics_images/ALN_BIO_C10_E08_018_Q01.png" width="80%"gt
View SolutionHow many lines of symmetry does the above figure have ?
View SolutionWhich of the following are correct chain isomers of butane ? (i)
View SolutionDetermine the point of symmetry of a regular hexagon.
View SolutionDtermine the images of the following figure about the given line :
View SolutionIn the figure above (not to scale), ¯¯¯¯¯¯AB⊥¯¯¯¯¯¯CDandAD is the bisector of ∠BAE.AB=3cm and AC=5cm. Find CD.
View SolutionMatch the following Column A to Column B

View SolutionMatch the following Column A to Column B

View SolutionMatch the following Column A to Column B

View SolutionThe inequation represented by the graph given below is :
View SolutionThe inequation that best describes the graph given below is _________
View SolutionThe inequation that best describes the following graph is _________
View SolutionWhich inequations represent the shaded region in the given figure
View Solution
