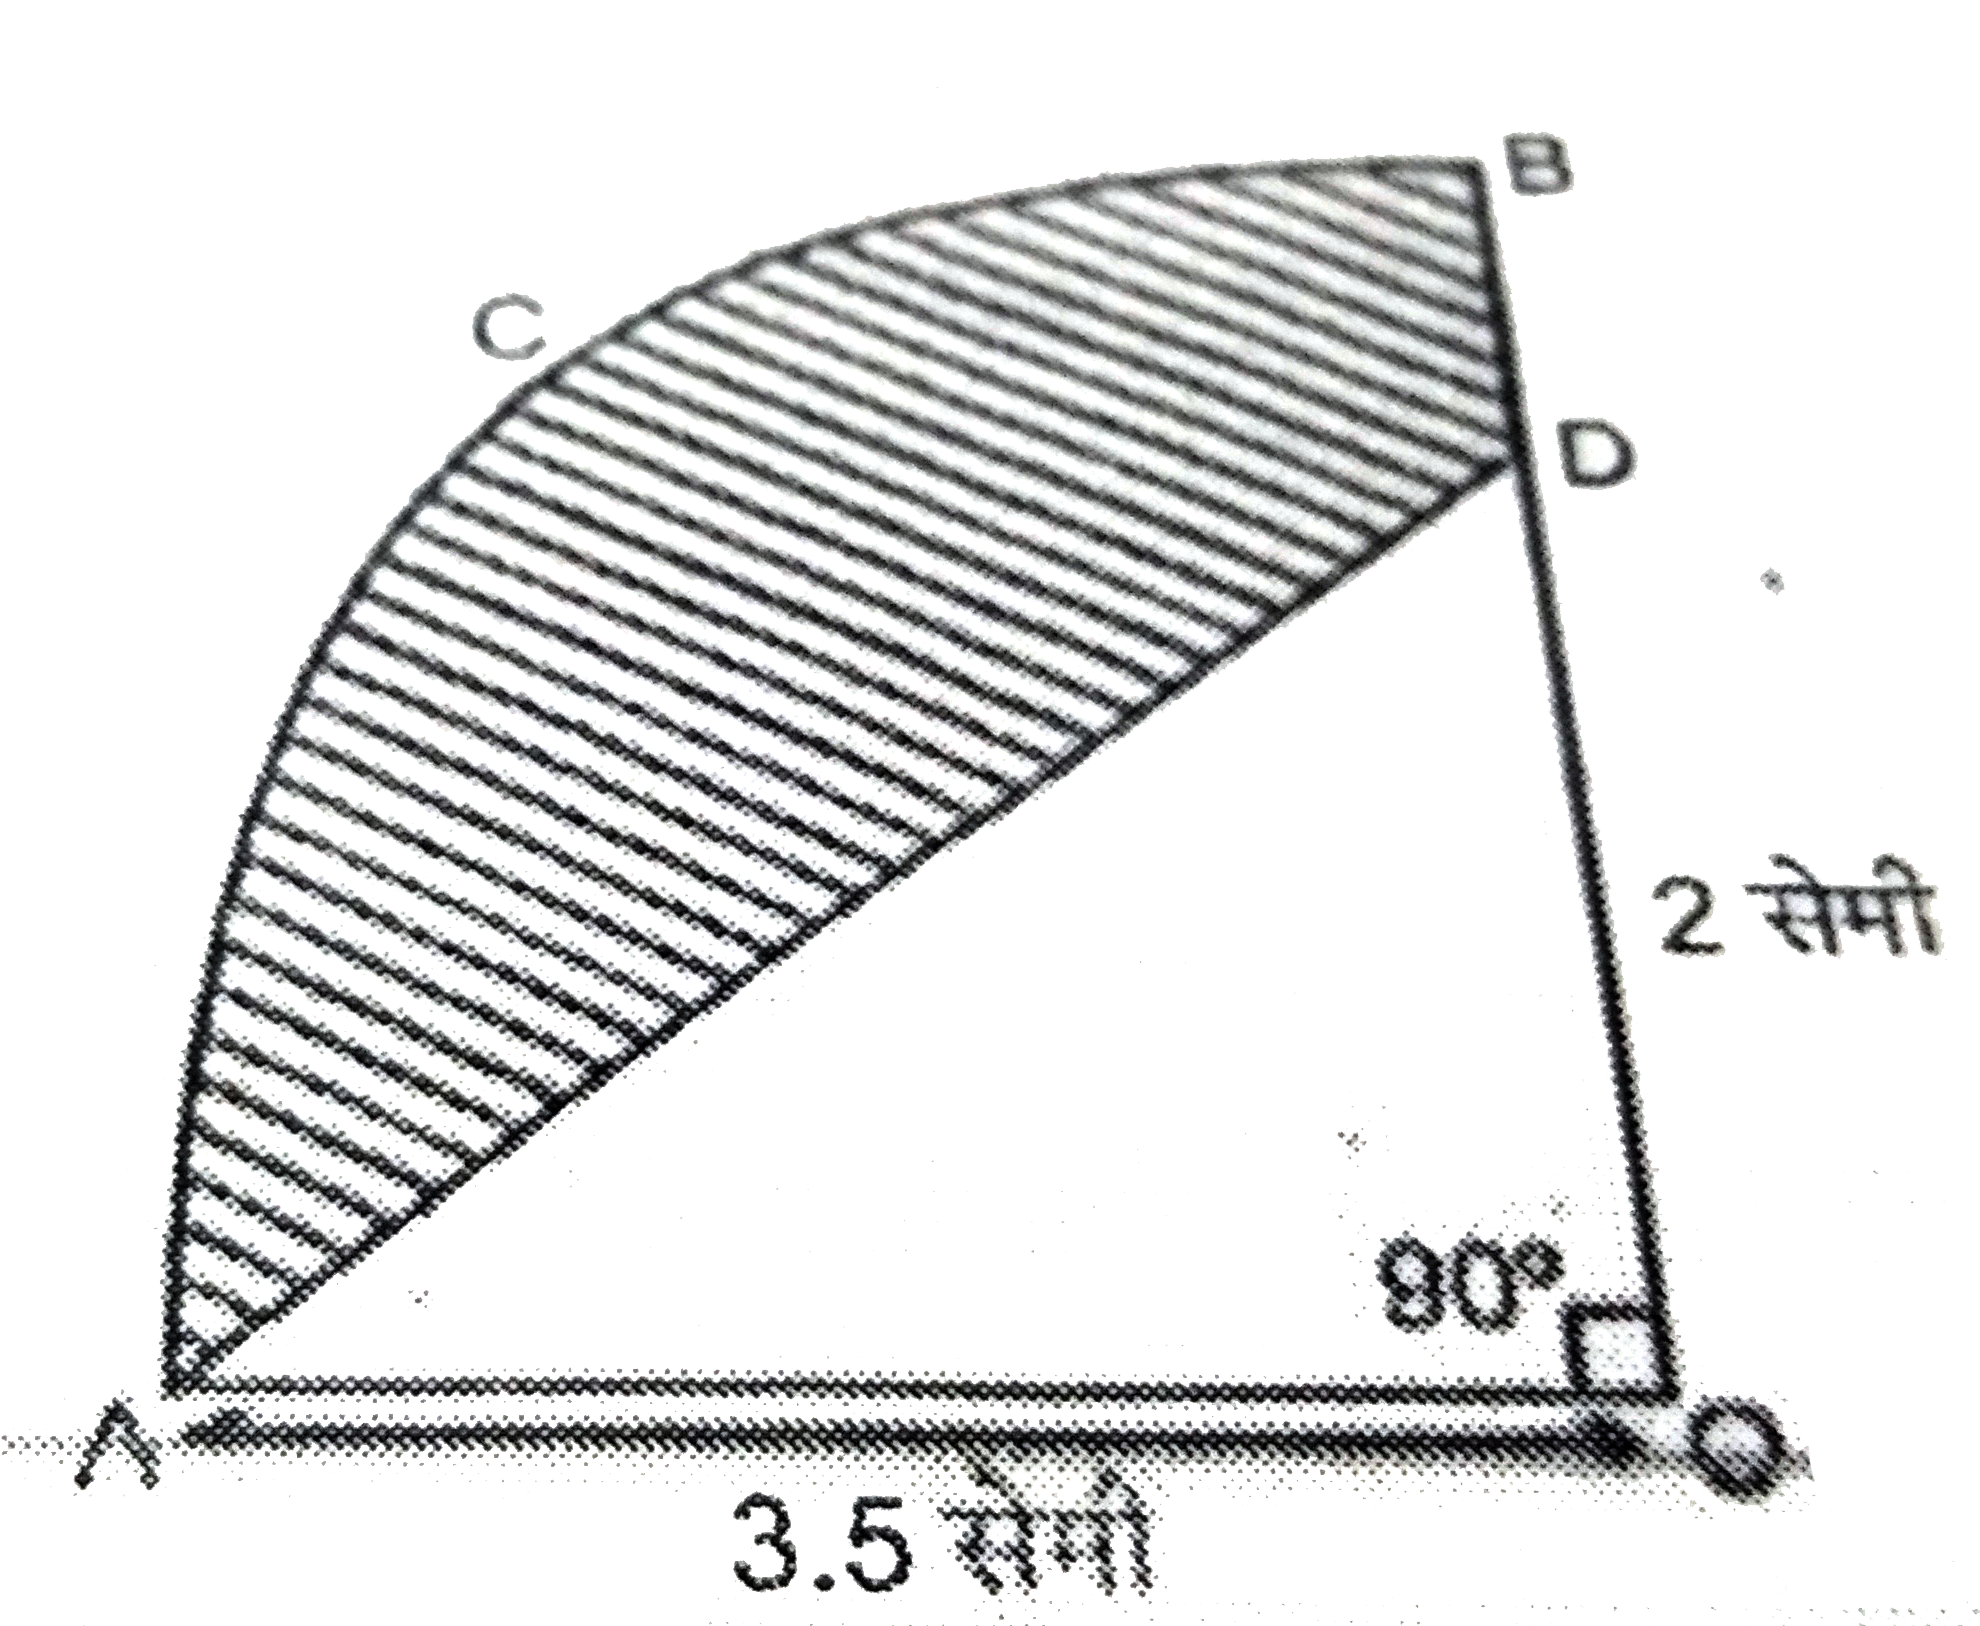
चित्र AOBCA, 3.5 सेमी त्रिज्या का O केन्द्र का वृत्त चतुथार्श निरूपित करता है, छायांकित भाग का क्षेत्रफल ज्ञात कीजिए।

वृत्त चतुर्थाश AOBCA=90360×πr2
=14×227×(3.5)2=1114×3.5×3.5
=778=9.625 वर्ग सेमी
समकोण △AOD का क्षेत्रफल =12×3.5×2=3.5 वर्ग सेमी
∴ छायित भाग का क्षेत्रफल = वृत्त चतुर्थाश AODBCA का क्षेत्रफल −△AOD का क्षेत्रफल
=(9.625-3.5) सेमी2=6.125 सेमी2

Topper's Solved these Questions
- वृत्तों से संबंधित क्षेत्रफल BOOK - MANOHAR RAYCHAPTER - वृत्तों से संबंधित क्षेत्रफल EXERCISE - प्रश्नावली 12(A)
12 Videos
- वृत्तों से संबंधित क्षेत्रफल BOOK - MANOHAR RAYCHAPTER - वृत्तों से संबंधित क्षेत्रफल EXERCISE - प्रश्नावली 12(B)
20 Videos
- वृत्तBOOK - MANOHAR RAYCHAPTER - वृत्तEXERCISE - प्रश्नावली 10(C)
12 Videos
- समांतर श्रेणी BOOK - MANOHAR RAYCHAPTER - समांतर श्रेणी EXERCISE - प्रश्नावली 5(E)
18 Videos
Similar Questions
दो वृत्तों की त्रिज्याएँ क्रमश : 8 सेमी और 6 सेमी है। उस वृत्त की त्रिज्या ज्ञात कीजिए जिसका क्षेत्रफल इन दोनों वृत्तों के क्षेत्रफलों के योग के बराबर है।
View Solutionएक घड़ी की मिनट की सुई 7 सेमी लम्बी है। 3 बजकर 10 मिनट से 3 बजकर 20 मिनट के बीच इस सुई द्वारा घड़ी पर बनाये गये त्रिज्यखण्ड का क्षेत्रफल ज्ञात कीजिए।
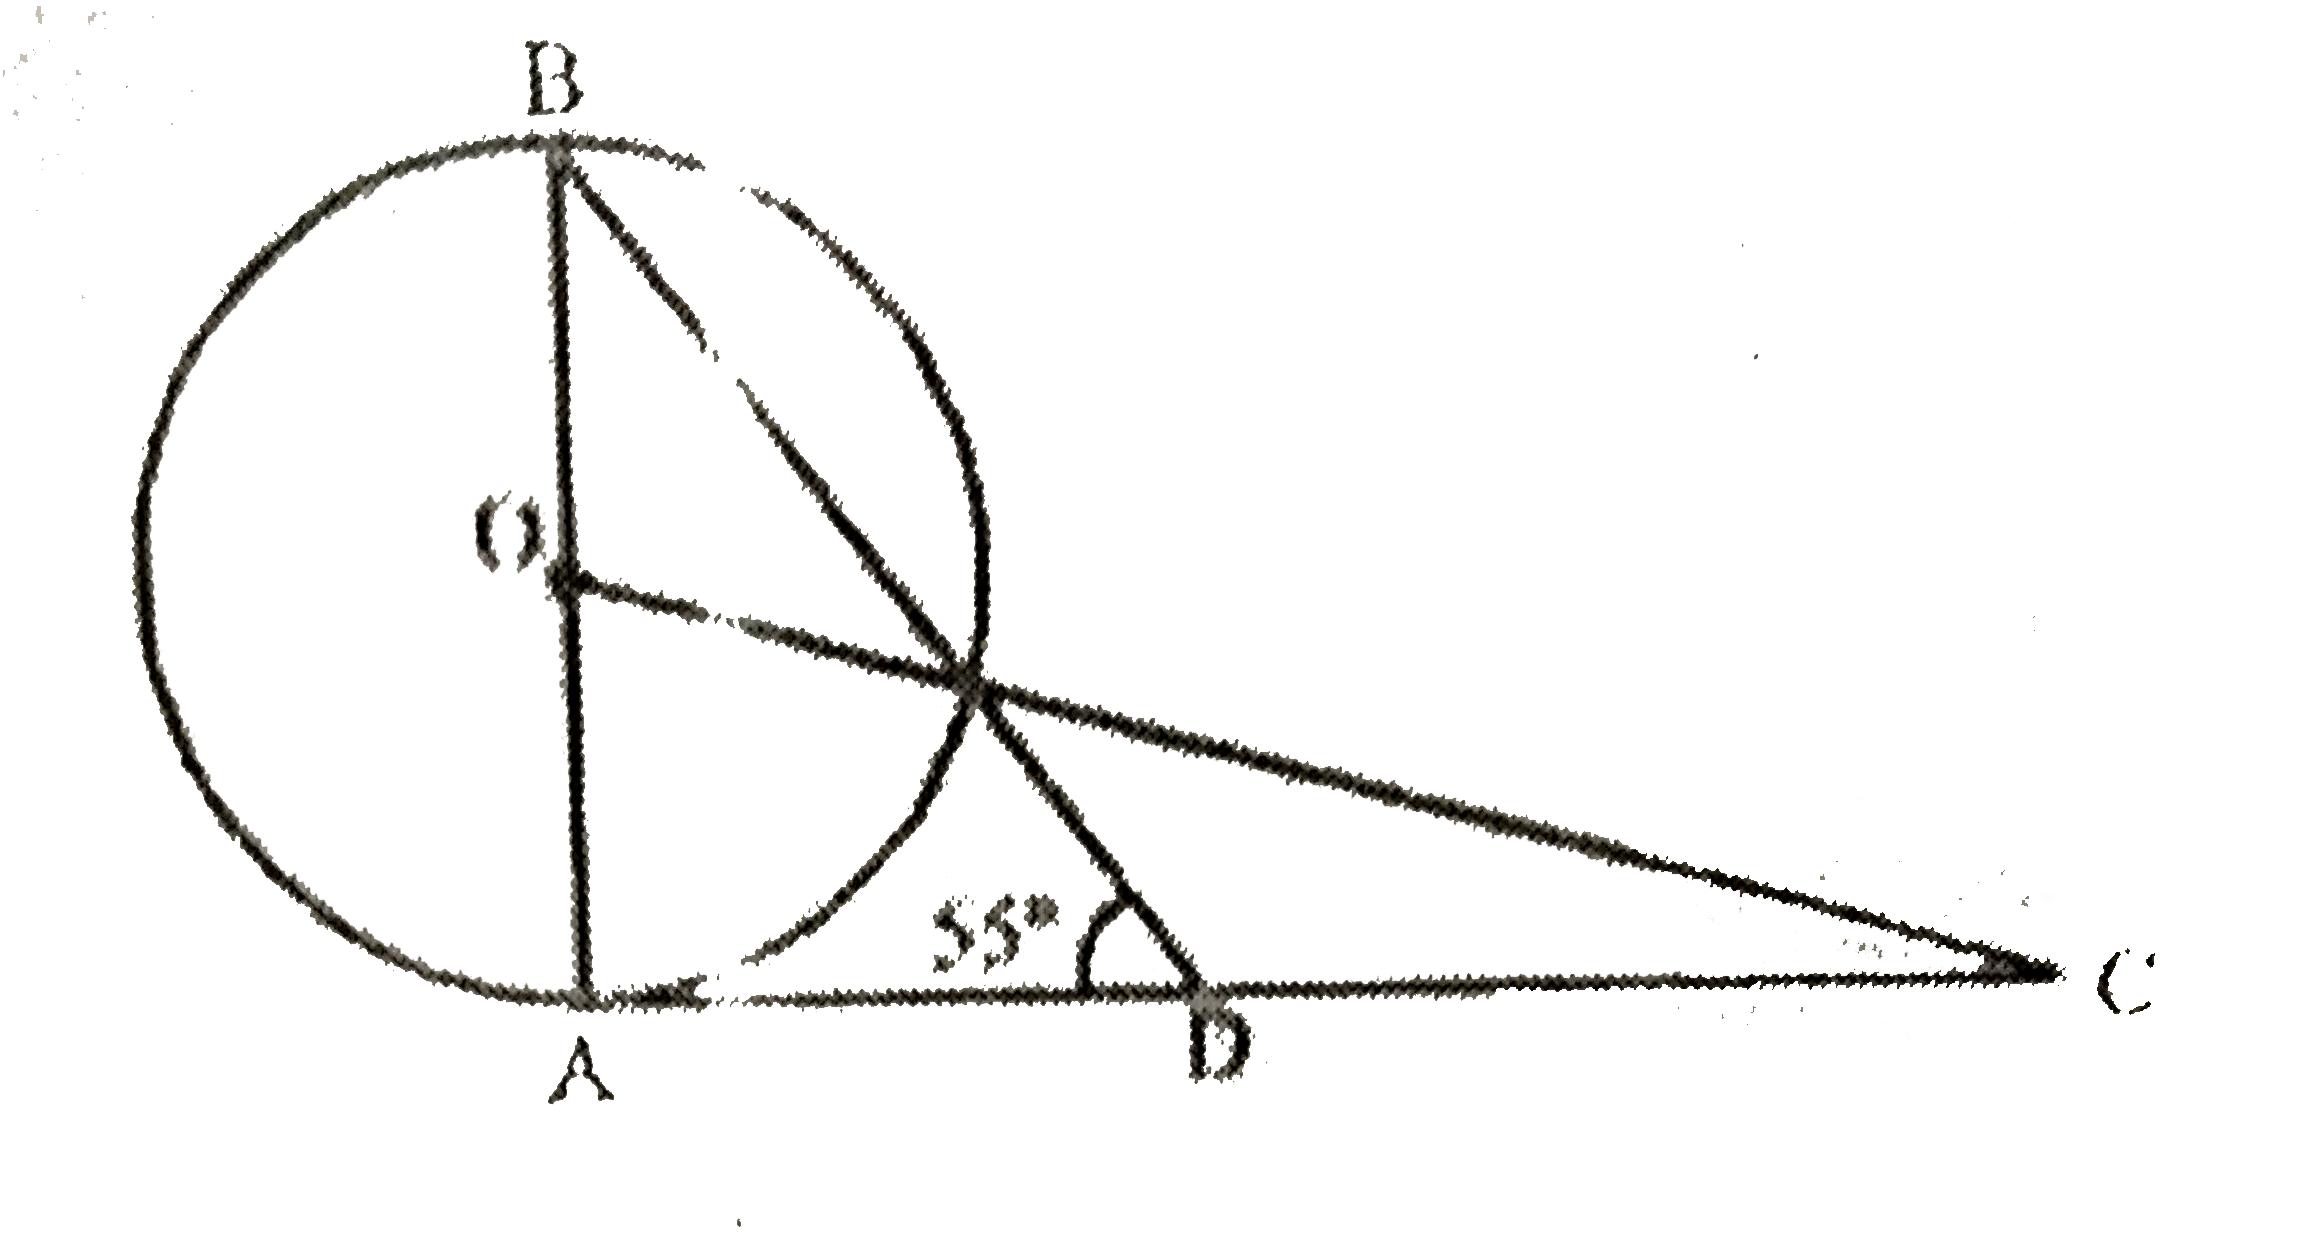
View Solutionचित्र में, वृत्त का केन्द्र O है और AC वृत्त की स्पर्श रेखा है। यदि ∠ADB=55∘,तो ∠ACO की माप होगी :

View Solutionकिसी स. श्रे. में, यदि d--4, n=7 और an=4 है, तो a का मान है :
View SolutionHow many lines of symmetry does the above figure have ?
View SolutionWhich of the following are correct chain isomers of butane ? (i)
View SolutionDetermine the point of symmetry of a regular hexagon.
View SolutionDtermine the images of the following figure about the given line :
View SolutionMatch the following Column A to Column B

View SolutionMatch the following Column A to Column B

View SolutionMatch the following Column A to Column B

View SolutionFind the area of the figure given below.

View SolutionThe area of the shaded part in the figure given below is ______.

View SolutionThe inequation represented by the graph given below is :
View SolutionThe inequation that best describes the graph given below is _________
View SolutionThe inequation that best describes the following graph is _________
View Solution
