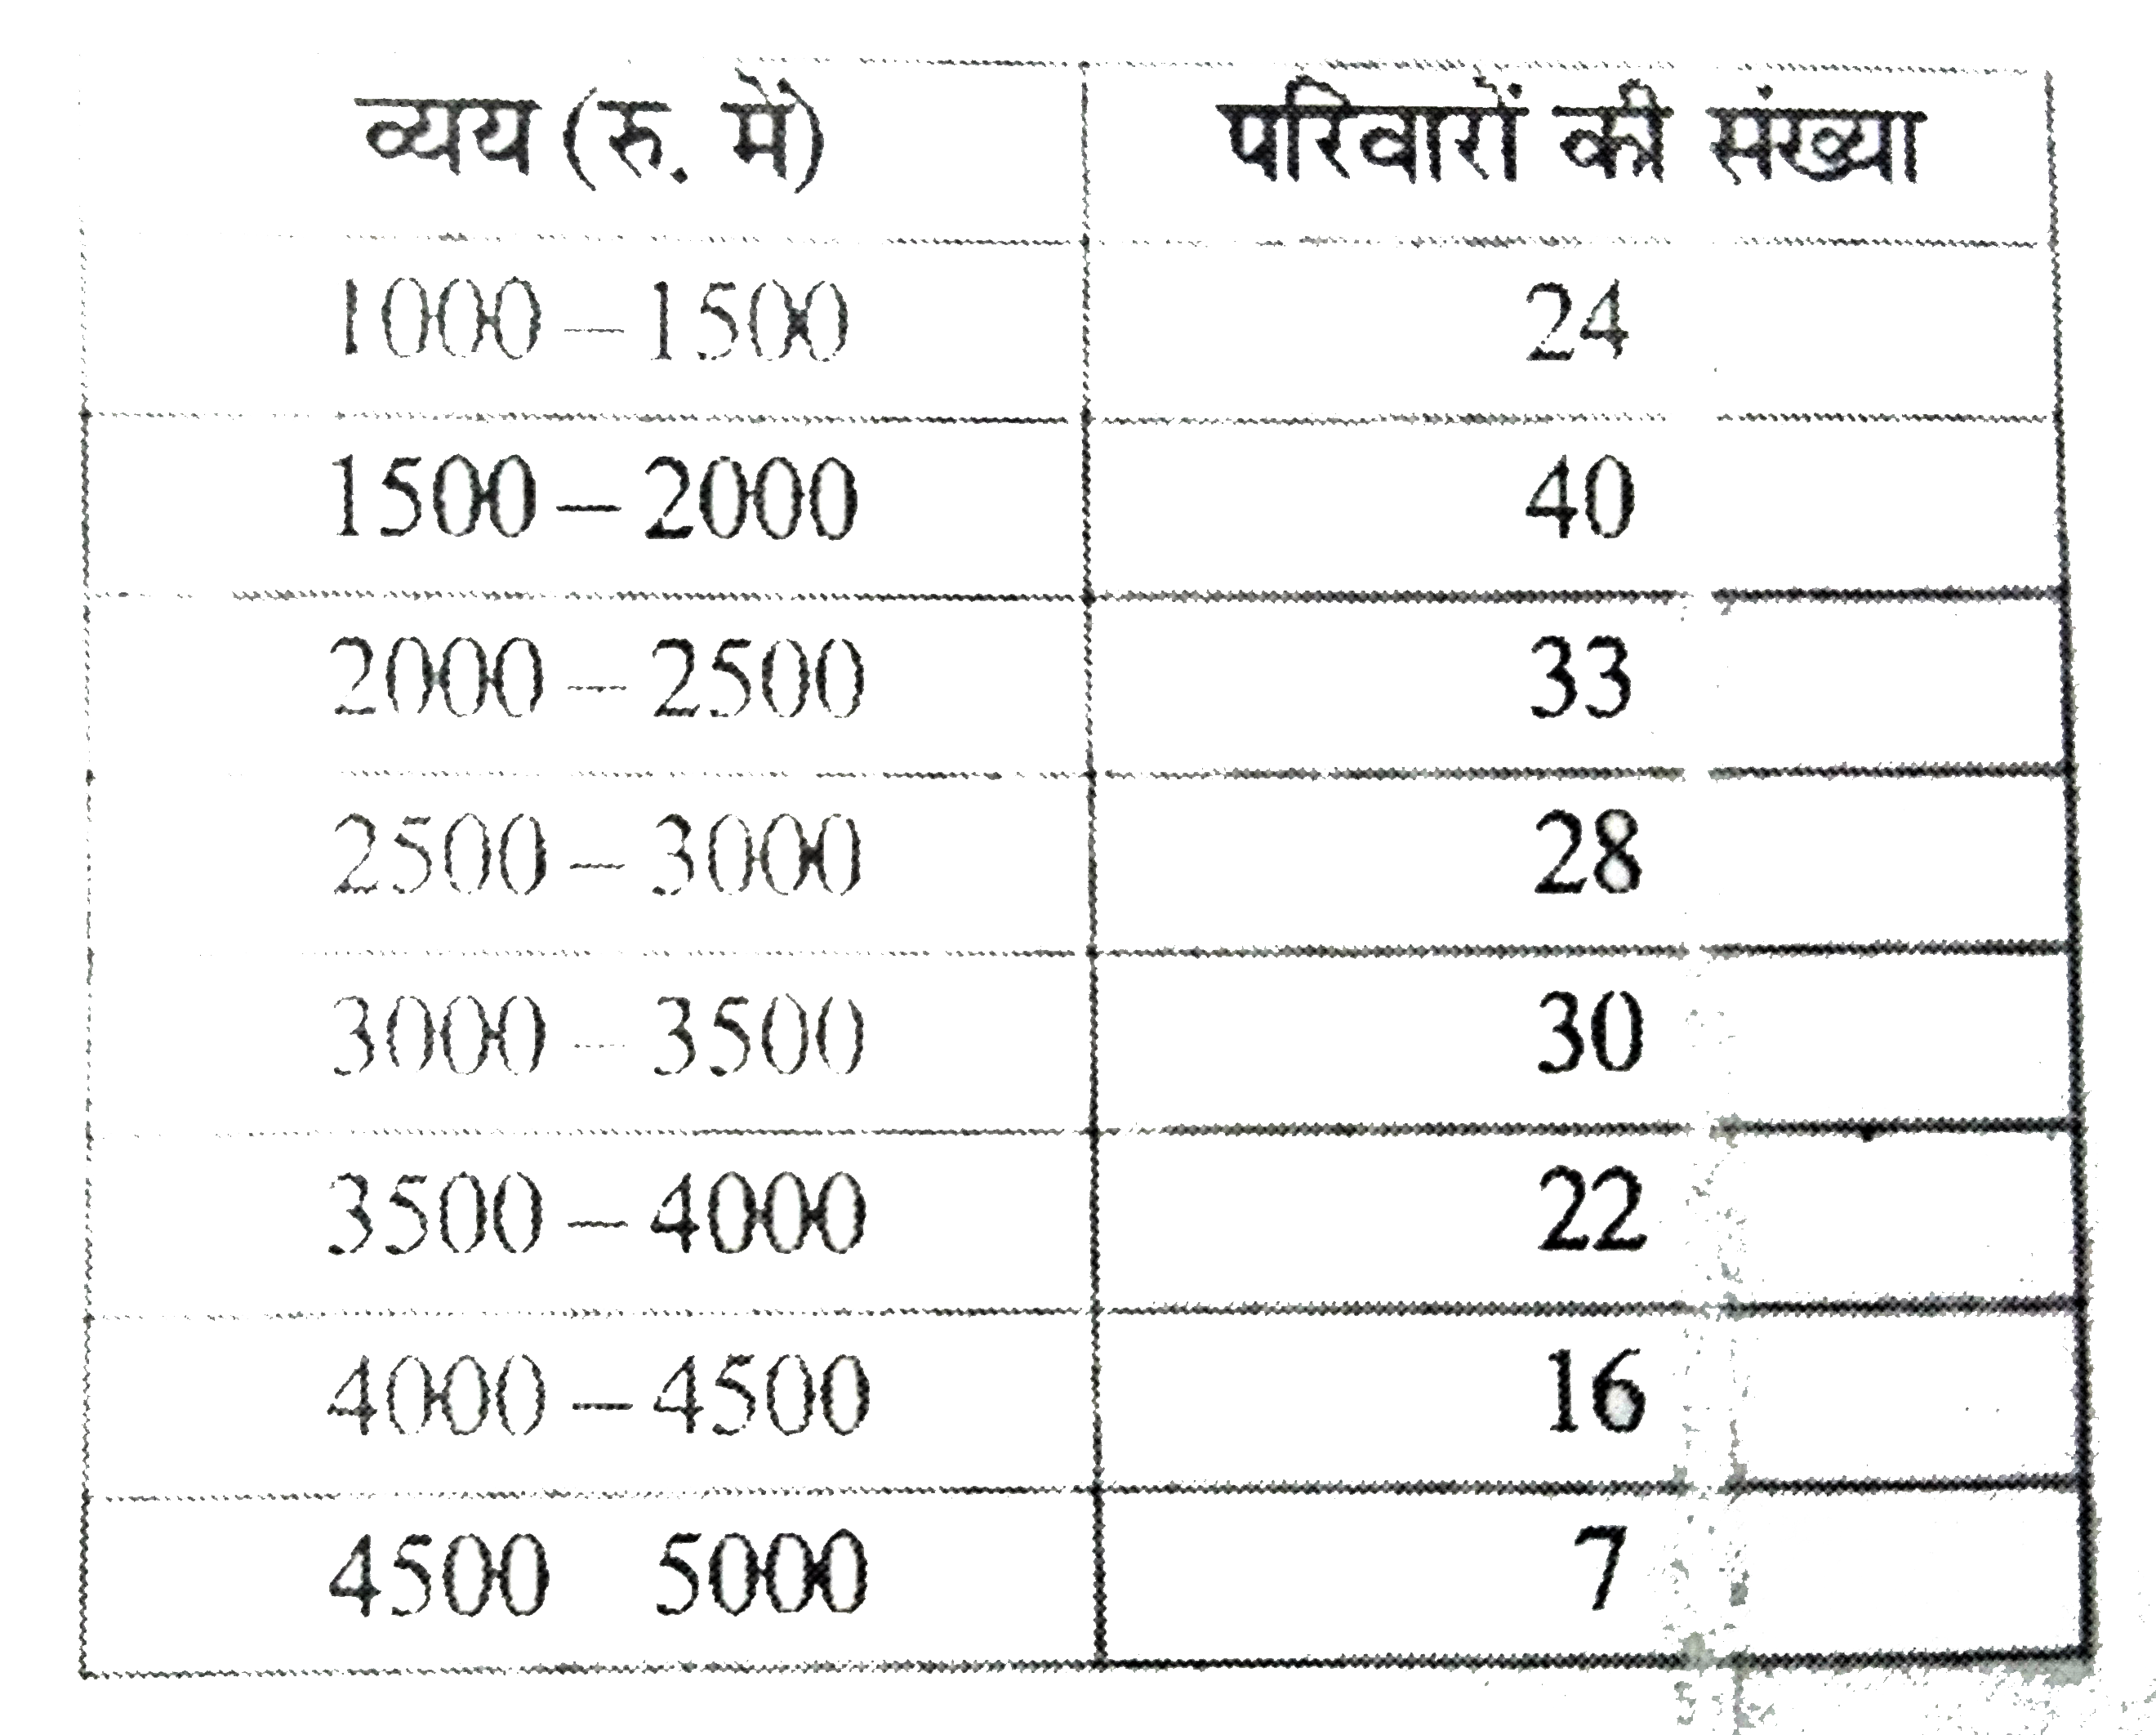
निम्नलिखित आँकड़ें किसी गाँव के 200 परिवारों के कुल मासिक घरेलू व्यय के बंटन को दर्शाती हैं। इन परिवारों का बहुलक मासिक व्यय ज्ञात कीजिए :

The correct Answer is:बहुलकिय मासिक खर्च = 1847.83 रु
Step by step video & image solution for निम्नलिखित आँकड़ें किसी गाँव के 200 परिवारों के कुल मासिक घरेलू व्यय के बंटन को दर्शाती हैं। इन परिवारों का बहुलक मासिक व्यय ज्ञात कीजिए : by Maths experts to help you in doubts & scoring excellent marks in Class 10 exams.
Updated on:21/07/2023Topper's Solved these Questions
- सांखियकीBOOK - MANOHAR RAYCHAPTER - सांखियकीEXERCISE - प्रश्नावली 14(E)
9 Videos
- सांखियकीBOOK - MANOHAR RAYCHAPTER - सांखियकीEXERCISE - प्रश्नावली 14(F)
8 Videos
- सांखियकीBOOK - MANOHAR RAYCHAPTER - सांखियकीEXERCISE - प्रश्नावली 14(C)
14 Videos
- समांतर श्रेणी BOOK - MANOHAR RAYCHAPTER - समांतर श्रेणी EXERCISE - प्रश्नावली 5(E)
18 Videos
Similar Questions
निम्नलिखित बंटन किसी फैक्ट्री के 50 श्रमिकों की दैनिक आय दर्शाता है :
 उपरोक्त बंटन को एक 'कम प्रकार ' के संचयी बारम्बारता बंटन में बदलिए और उसका तोरण खिचिएं।
View Solutionवर्गीकृत आँकड़ों का माध्य ज्ञात करने के लिए सूत्र ¯x=a+h(ΣfiuiΣfi) में ui=
View Solutionनिम्नलिखित बारम्बारता बंटन किसी मोहल्ले के 68 उपभोक्ताओं की बिजली की मासिक खपत दर्शाता है ।

इन आँकड़ों के माधयक तथा माध्य ज्ञात कीजिए ।
View Solutionकिसी स. श्रे. में, यदि d--4, n=7 और an=4 है, तो a का मान है :
View SolutionHow many lines of symmetry does the above figure have ?
View SolutionWhich of the following are correct chain isomers of butane ? (i)
View SolutionDetermine the point of symmetry of a regular hexagon.
View SolutionDtermine the images of the following figure about the given line :
View SolutionMatch the following Column A to Column B

View SolutionMatch the following Column A to Column B

View SolutionMatch the following Column A to Column B

View SolutionFind the area of the figure given below.

View SolutionThe area of the shaded part in the figure given below is ______.

View SolutionThe inequation represented by the graph given below is :
View SolutionThe inequation that best describes the graph given below is _________
View SolutionThe inequation that best describes the following graph is _________
View Solution
