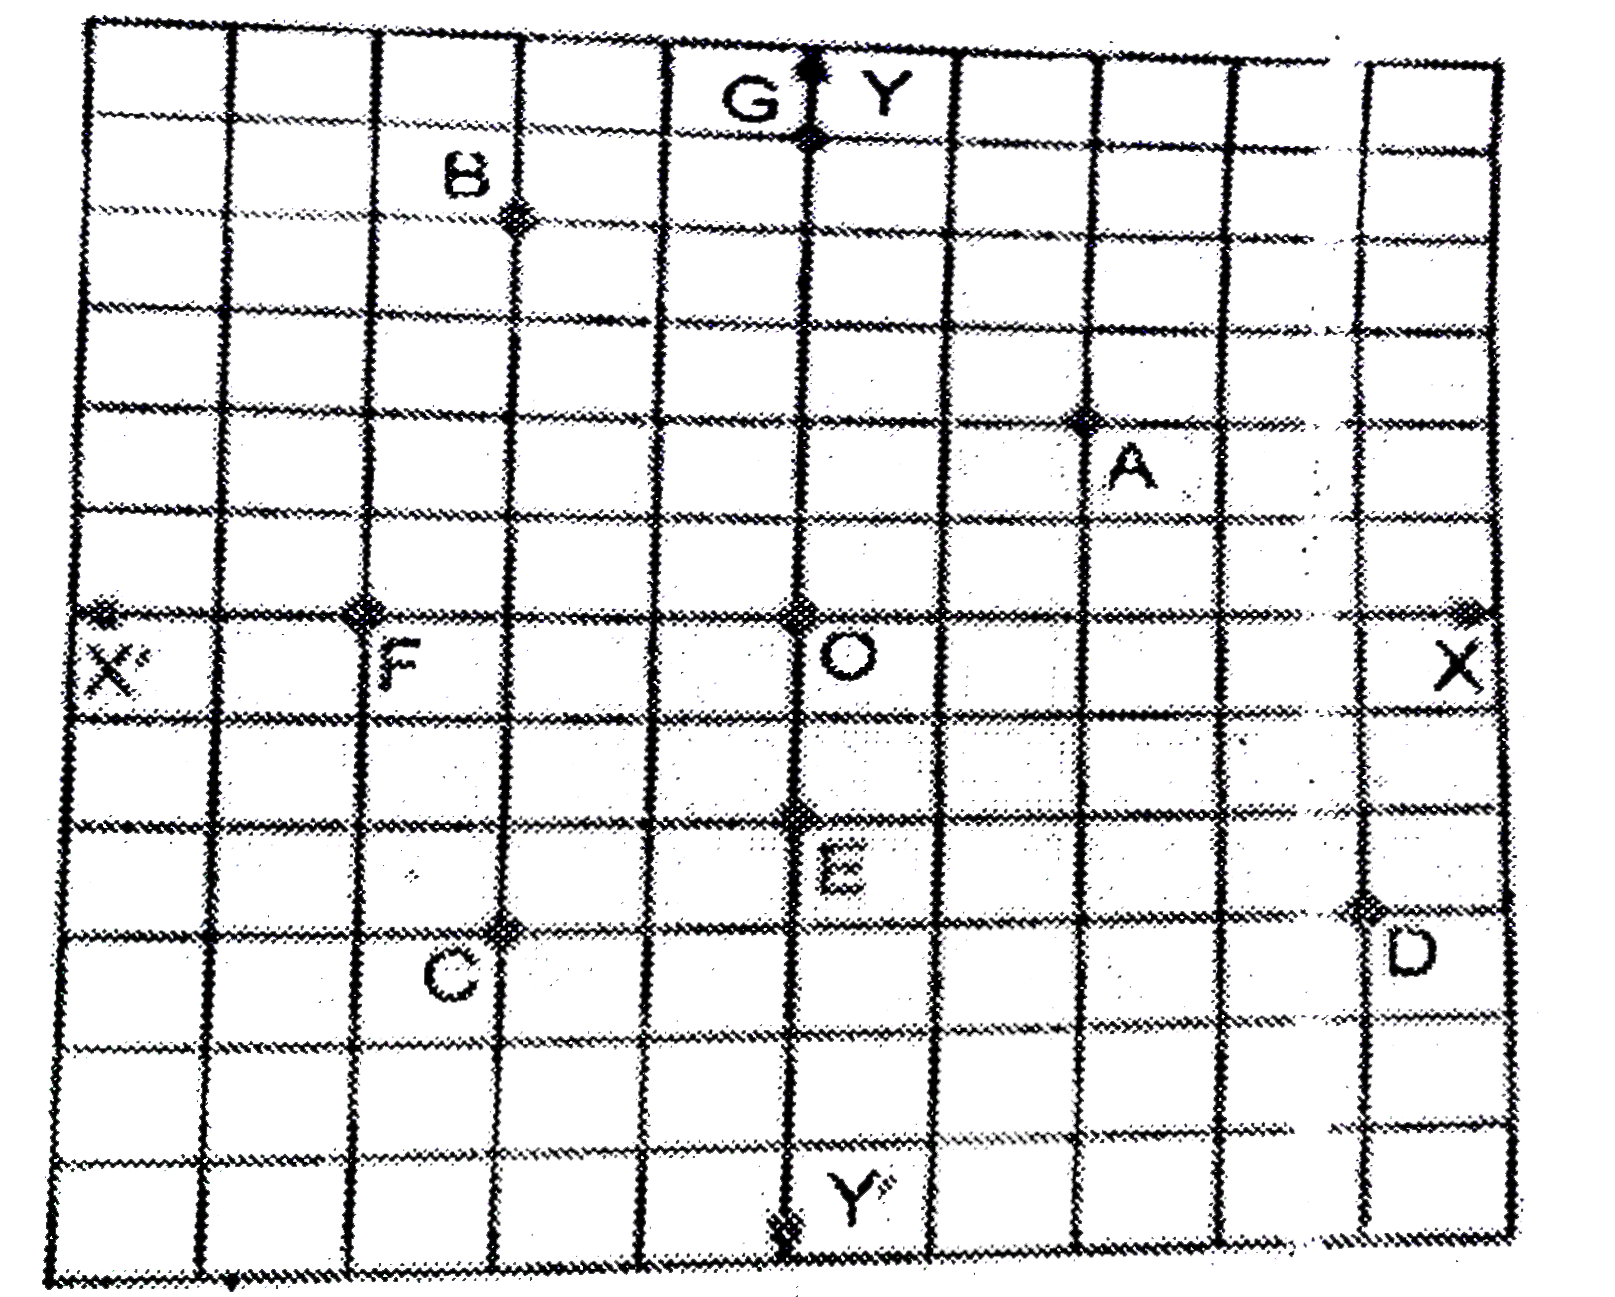
अक्षों पर दूरी का उपयुक्त एकक लेकर नीचे सारणी में दिए गए बिन्दुओं को तल पर आलेखित कीजिए :

The correct Answer is:संलग्न आकृति में बिन्दुओं की स्थितियों बिन्दियों द्वारा दर्शाई गई हैं ।
(##IXHINMATC03E01015_A01##)
Step by step video & image solution for अक्षों पर दूरी का उपयुक्त एकक लेकर नीचे सारणी में दिए गए बिन्दुओं को तल पर आलेखित कीजिए : by Maths experts to help you in doubts & scoring excellent marks in Class 9 exams.
Updated on:21/07/2023Topper's Solved these Questions
- निर्देशांक ज्यामिति Book:MANOHAR RAYChapter:निर्देशांक ज्यामिति Exercise:प्रश्नावली 7
Explore 1 Video
- दो चरों वाले रैखिक समीकरण Book:MANOHAR RAYChapter:दो चरों वाले रैखिक समीकरण Exercise:प्रश्नावली 4.2
Explore 1 Video
- पृष्ठीय क्षेत्रफ़ल और आयतन Book:MANOHAR RAYChapter:पृष्ठीय क्षेत्रफ़ल और आयतन Exercise:प्रश्नावली 13(E)
Explore 27 Videos
Similar Questions
पार्श्व चित्र में अंकित बिन्दुओं के निर्देशांक बताइए :

View Solutionनिम्नलिखित आलेख में से प्रत्येक आलेख के लिए दिए गए विकल्पों से सही समीकरण का चयन कीजिए।
आकृति के लिएआकृति के लिए(i)y=x(i)y=x+2(ii)x+y=0(ii)y=−x+2(iii)y=2x(iii)y=−x+2(iv)2+3y=7x(iv)x+2y=6

View Solutionनिम्न त्रिज्या वाले गोले का पृष्ठीय क्षेत्रफल ज्ञात कीजिए।
(i) 10.5 सेमी
(ii) 5.6 सेमी
(ii) 14 सेमी.
View SolutionHow many lines of symmetry does the above figure have ?
View SolutionWhich of the following are correct chain isomers of butane ? (i)
View SolutionDetermine the point of symmetry of a regular hexagon.
View SolutionDtermine the images of the following figure about the given line :
View SolutionMatch the following Column A to Column B

View SolutionMatch the following Column A to Column B

View SolutionMatch the following Column A to Column B

View SolutionFind the area of the figure given below.

View SolutionThe area of the shaded part in the figure given below is ______.

View SolutionThe inequation represented by the graph given below is :
View SolutionThe inequation that best describes the graph given below is _________
View SolutionThe inequation that best describes the following graph is _________
View SolutionWhich inequations represent the shaded region in the given figure
View Solution
