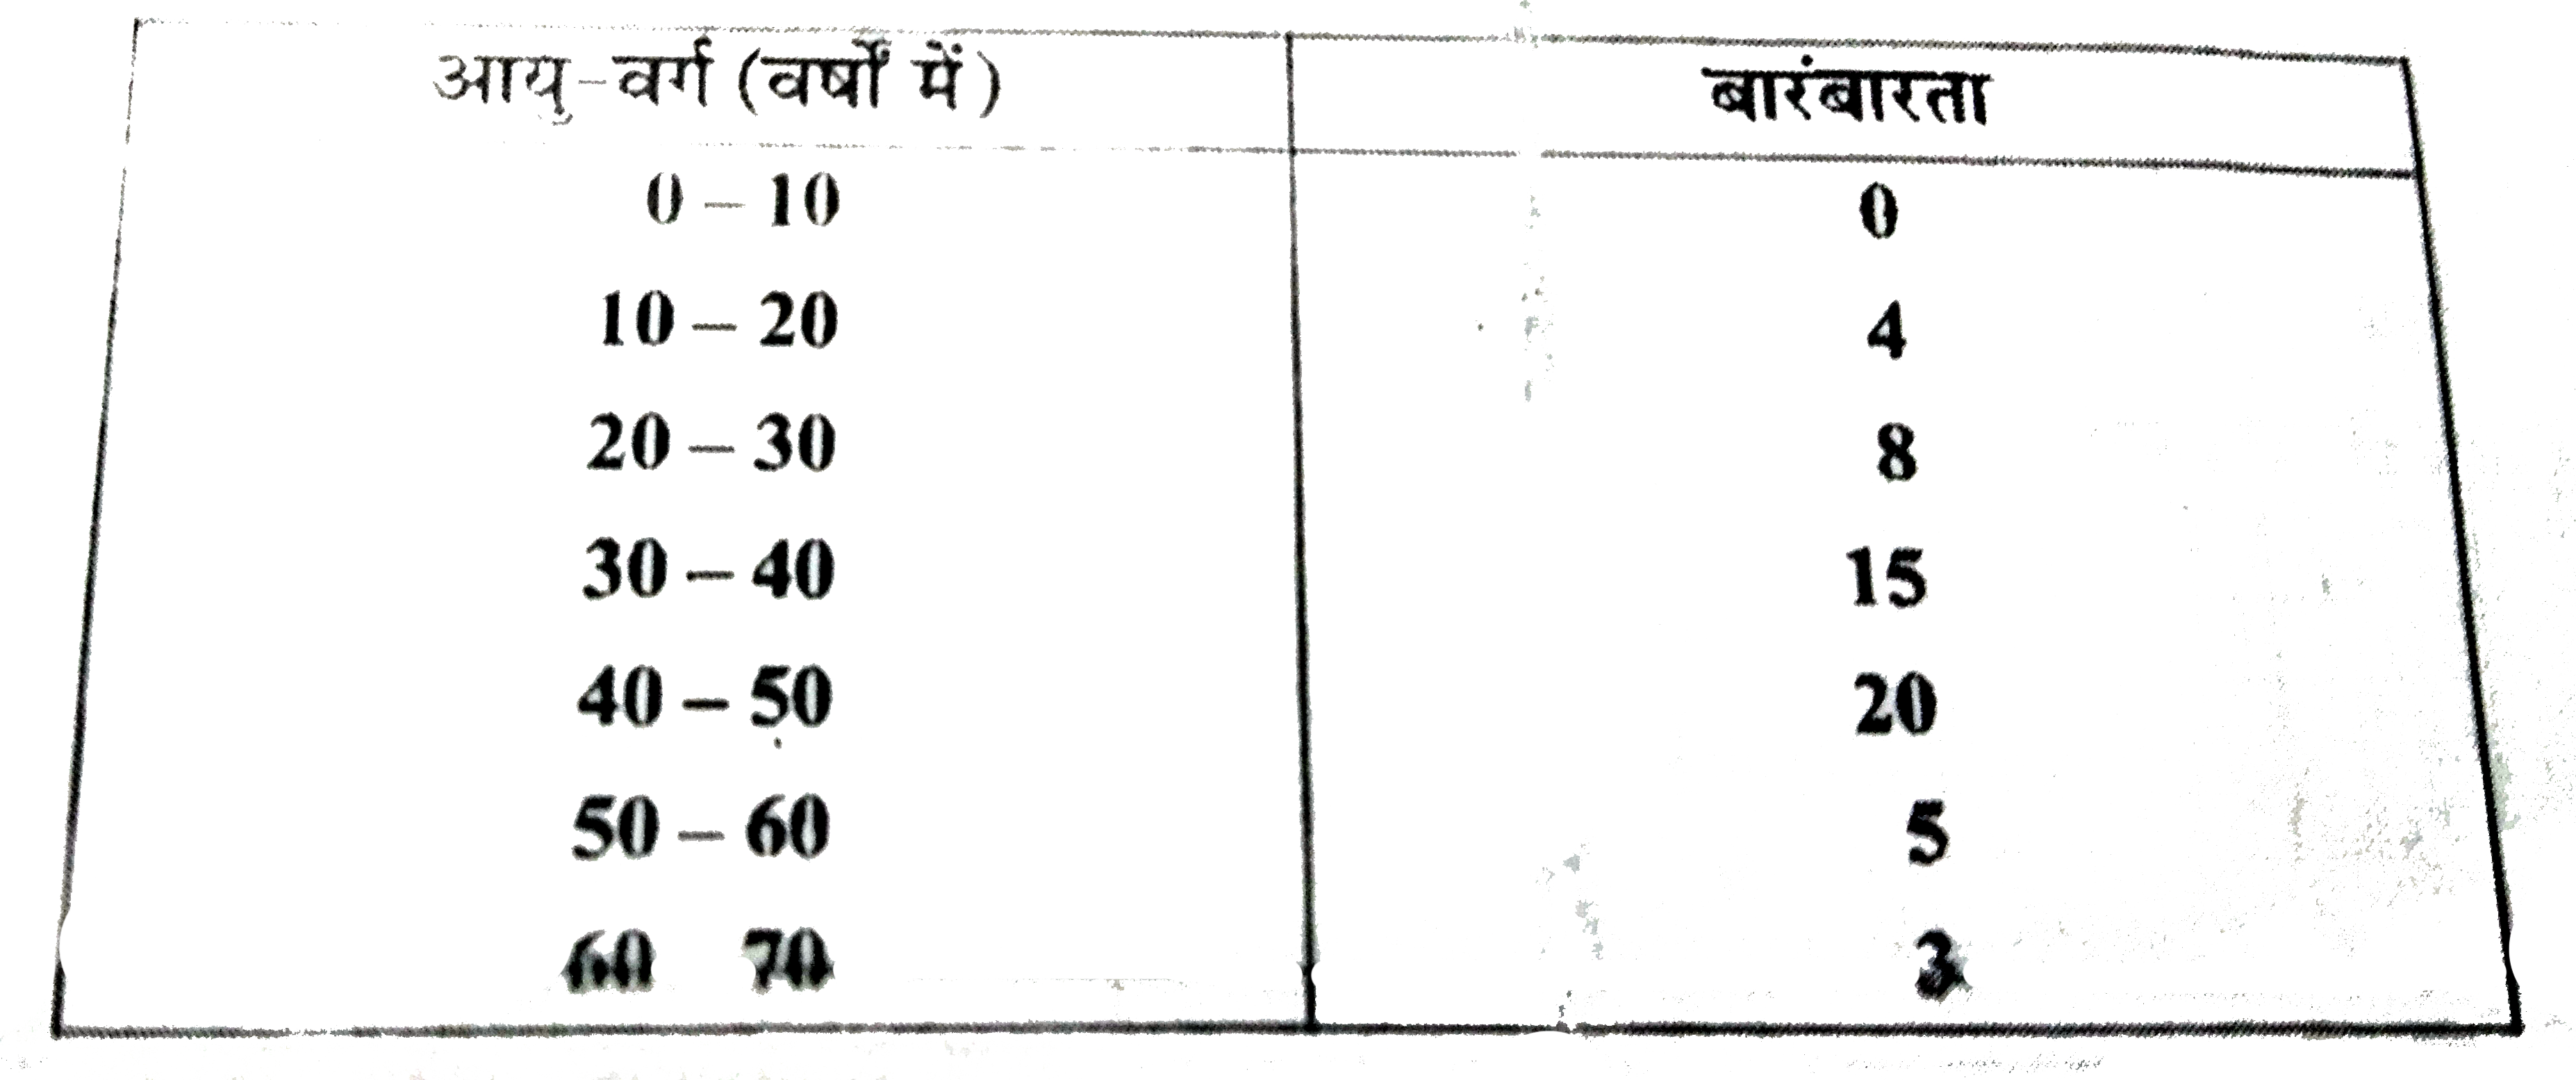
नीचे आयु-वर्ग में बच्चों की बारम्बारता दी हुई है :

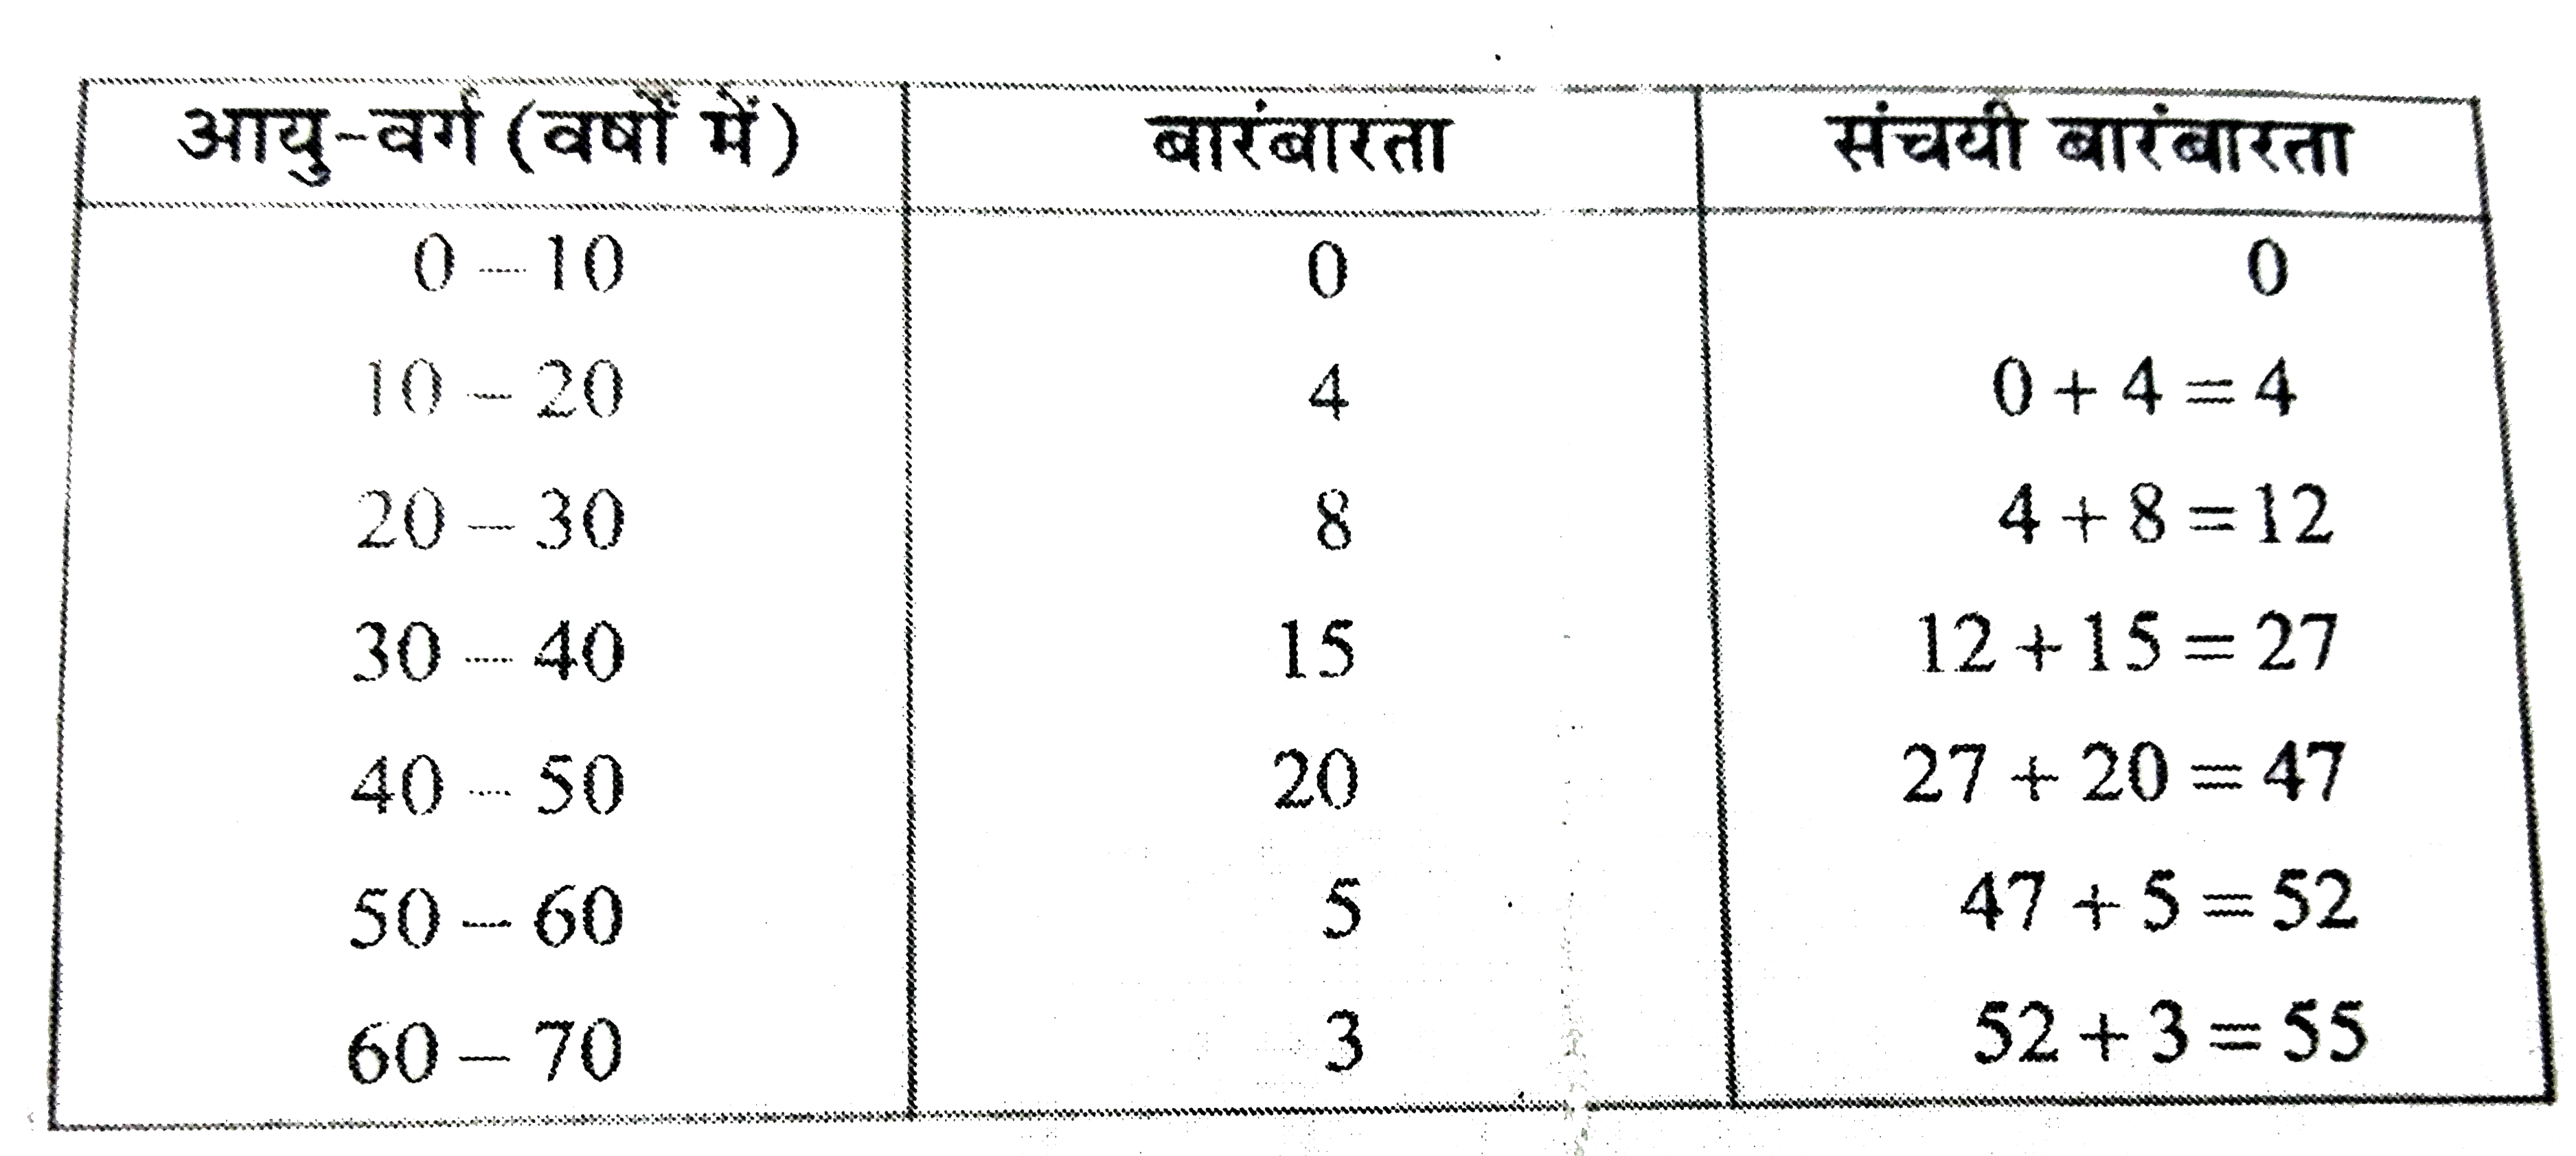
संचयी बारम्बारता की सारणी बनाइए ।

चूँकि 0 - 10 वर्ग के भीतर बारम्बारता 0 है, अतः इस वर्ग की संचयी बारम्बारता है| 10 - 20 के वर्ग की बारम्बारता 4 है, अतः इस वर्ग की संचयी बारम्बारता 0+4 अर्थात 4 है। 20 - 30 के वर्ग की बारम्बारता 8 है और इस वर्ग की संचयी बारम्बारता 4+8 अर्थात 12 है। 30 - 40 के वर्ग की बारम्बारता 15 है, अतः इस वर्ग की संचयी बारम्बारता 12+15 अर्थात 27 है । इसी प्रकार अन्य वर्गो की संचयी बारम्बारता ज्ञात की जा सकती है।
अन्य प्रकार की सारणी : उपरोक्त उदाहरण के आँकड़ों को सारणी रूप में दो प्रकार से लिखा जा सकता है :

Topper's Solved these Questions
- सांखियकीBOOK - MANOHAR RAYCHAPTER - सांखियकीEXERCISE - प्रश्नावली 14 (A)
5 Videos
- सांखियकीBOOK - MANOHAR RAYCHAPTER - सांखियकीEXERCISE - प्रश्नावली 14 (B)
3 Videos
- समान्तर चतुर्भुजों और त्रिभुजों के क्षेत्रफल BOOK - MANOHAR RAYCHAPTER - समान्तर चतुर्भुजों और त्रिभुजों के क्षेत्रफल EXERCISE - प्रश्नावली 9(D)
10 Videos
- हीरोन का सूत्र BOOK - MANOHAR RAYCHAPTER - हीरोन का सूत्र EXERCISE - प्रश्नावली 12(B)
18 Videos
Similar Questions
आँकड़ें किन्हें कहते है और आँकड़ों की क्या विशेषताएँ है ?
View Solutionनिम्नलिखित पर टिप्पणी लिखिए :
(i) वर्ग सीमाएँ (ii) वर्ग अंतराल (iii) वर्ग अंतराल की आमाप ।
View Solutionएक त्रिभुज का क्षेत्रफल 6√2 सेमी 2 है और आधार की लम्बाई 3 सेमी है। त्रिभुज की ऊंचाई होगी :
View Solutionएक पार्क चतुर्भुज ABCD के आकार का है, जिसमे √C=90∘,AB=9 मीटर, BC=12 मीटर, CD=5 मीटर और मीटर AD=8 है । इस पार्क का कितना क्षेत्रफल है ?
View SolutionHow many lines of symmetry does the above figure have ?
View SolutionWhich of the following are correct chain isomers of butane ? (i)
View SolutionDetermine the point of symmetry of a regular hexagon.
View SolutionDtermine the images of the following figure about the given line :
View SolutionMatch the following Column A to Column B

View SolutionMatch the following Column A to Column B

View SolutionMatch the following Column A to Column B

View SolutionFind the area of the figure given below.

View SolutionThe area of the shaded part in the figure given below is ______.

View SolutionThe inequation represented by the graph given below is :
View SolutionThe inequation that best describes the graph given below is _________
View SolutionThe inequation that best describes the following graph is _________
View Solution