Consider the following population and year graph: find the slope of the line AB and using it find what will be the population in the year 2010.
Step by step video & image solution for Consider the following population and year graph: find the slope of the line AB and using it find what will be the population in the year 2010. by Maths experts to help you in doubts & scoring excellent marks in Class 12 exams.
Updated on:21/07/2023Similar Questions
Knowledge Check
The population of a city at present is 80000. If it increase by 5% per year, what will be the population after 3 years?
A88200B84000C92610D86610The population of cattle in a farm increases so that the difference between the populationin year n + 2 and that in year n is proportional to the population in year n + 1. If the populations in years 2010, 2011 and 2013 were 39, 60 and 123, respectively, then the population in 2012 was-
A81B84C87D90

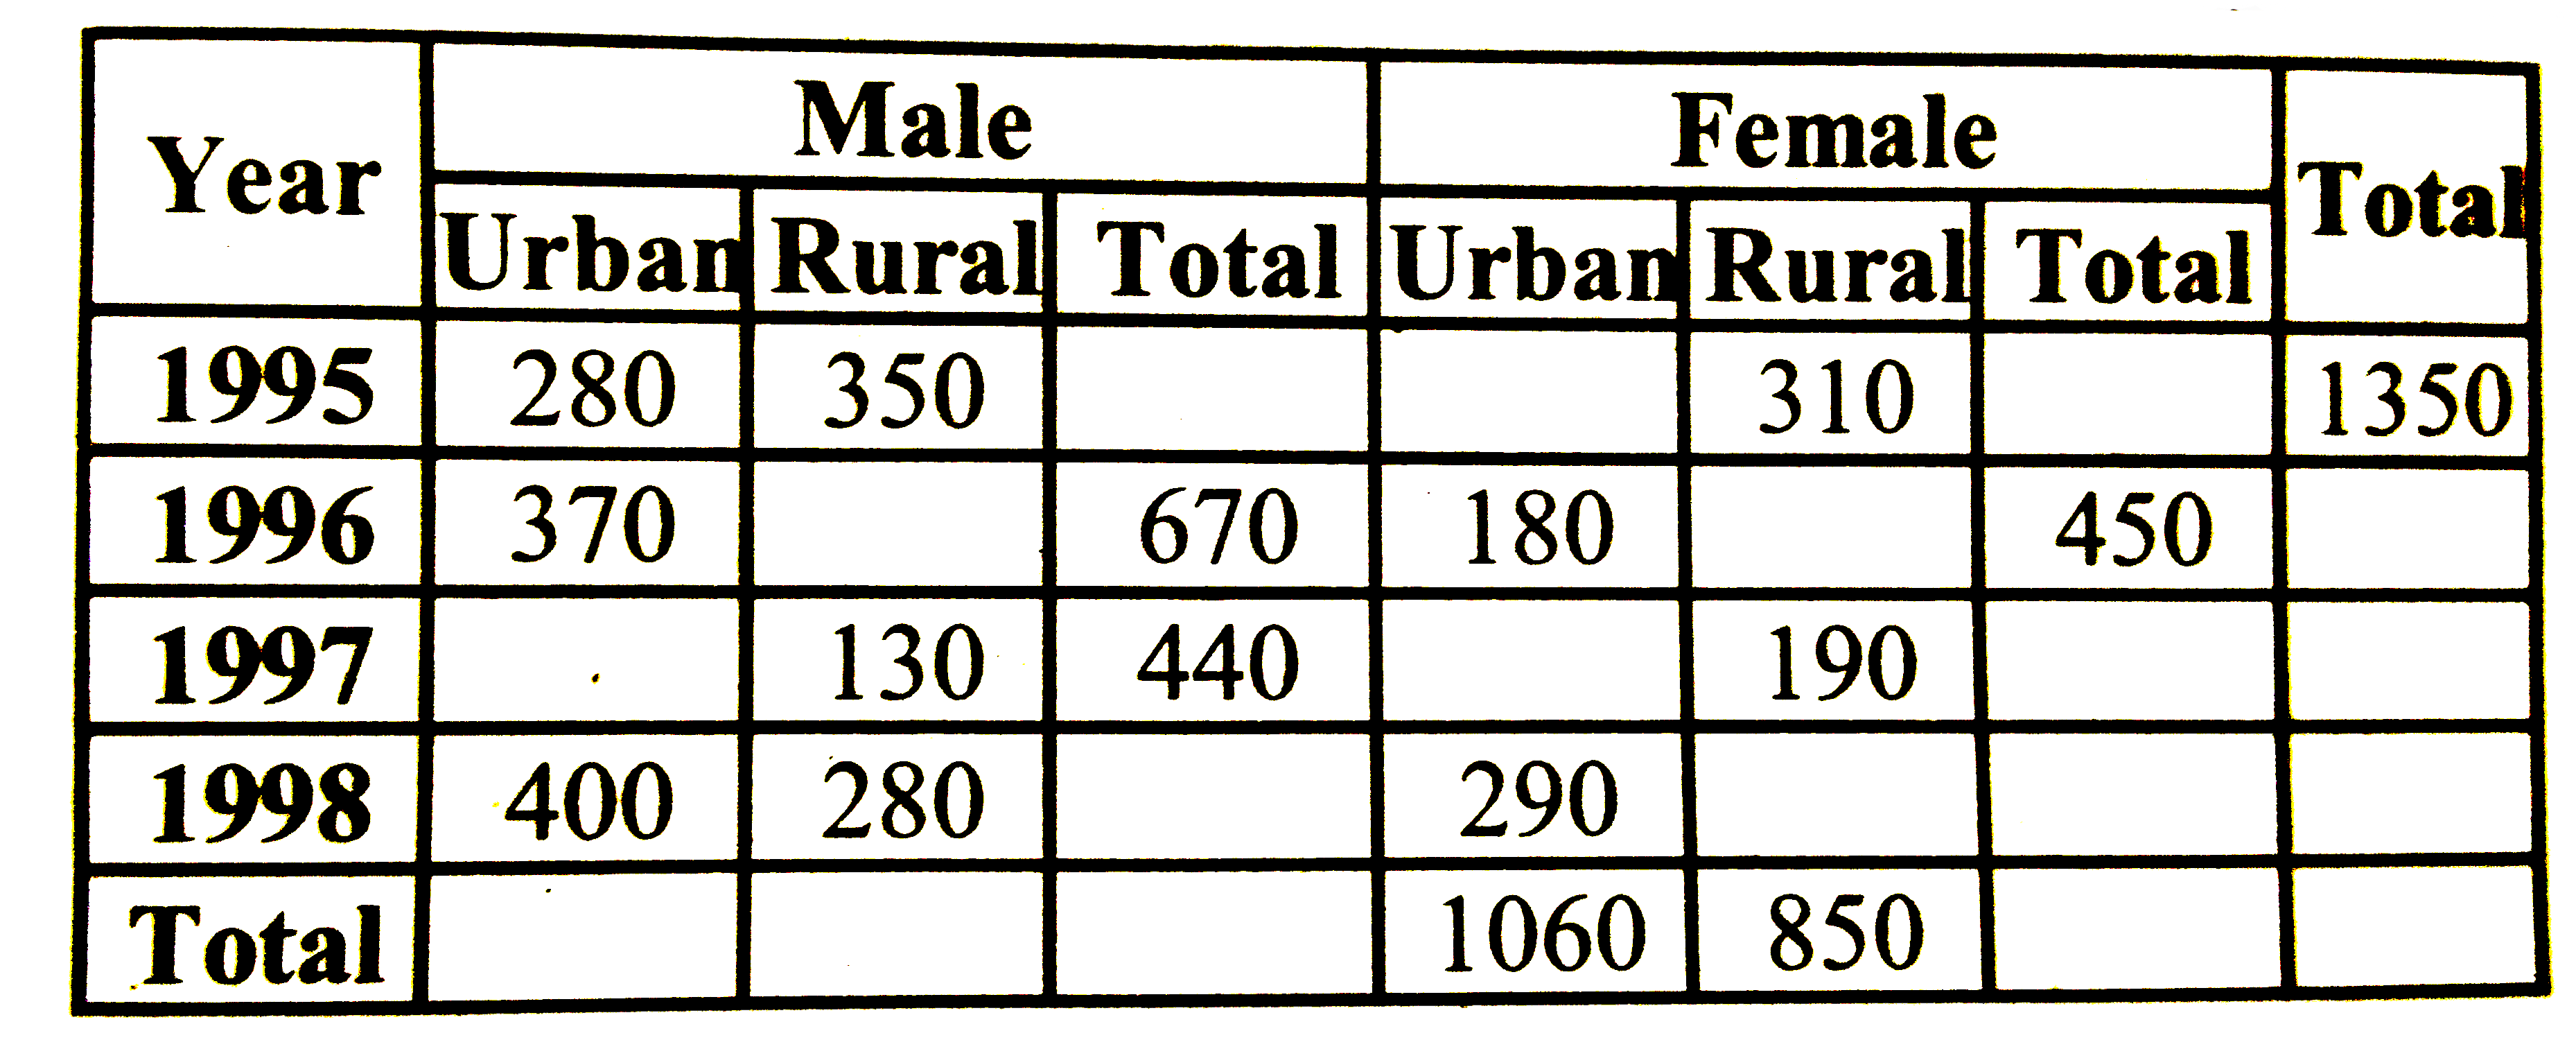
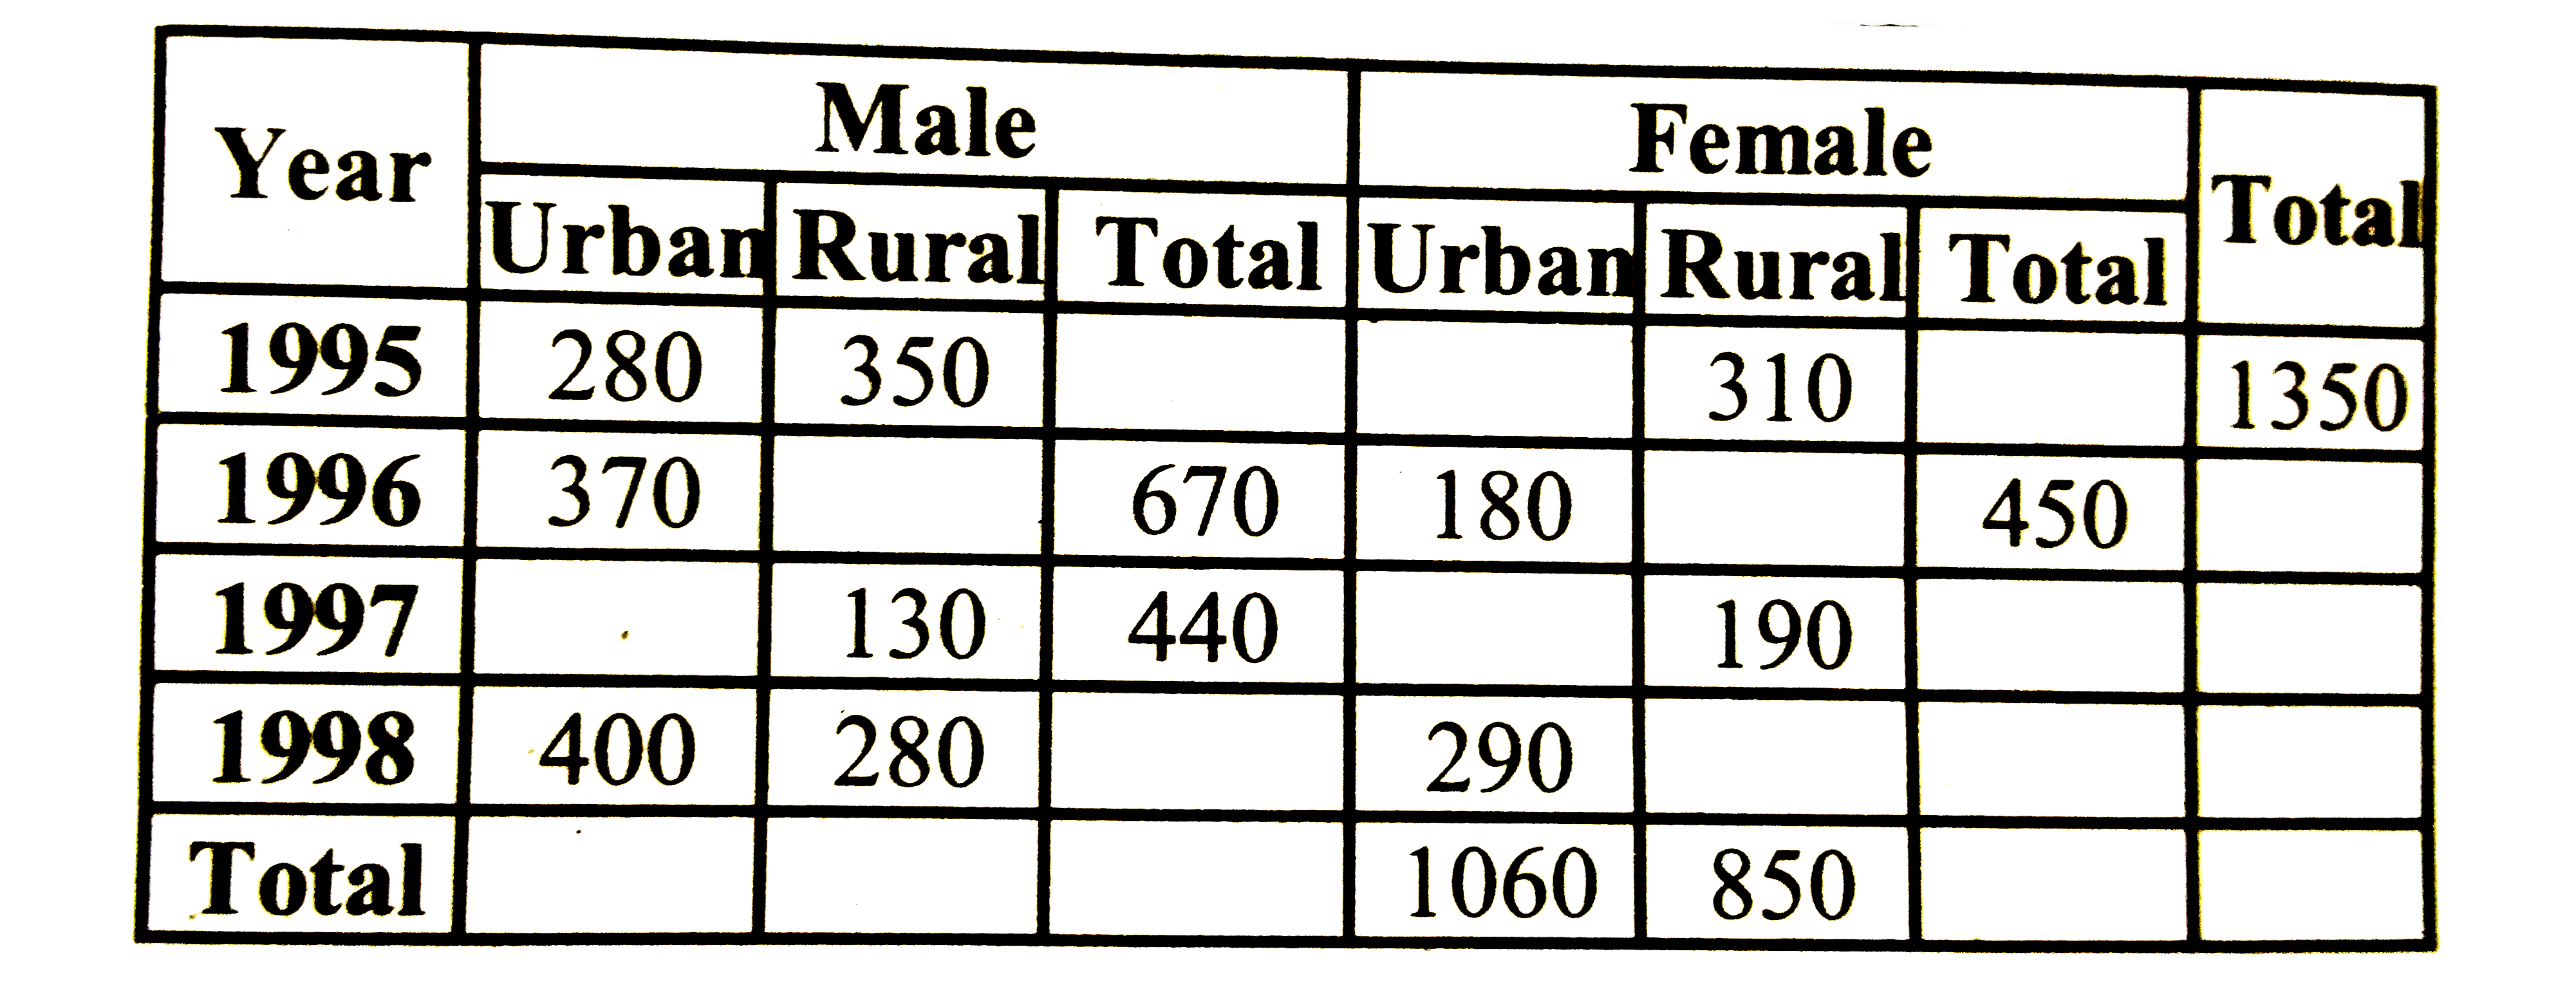
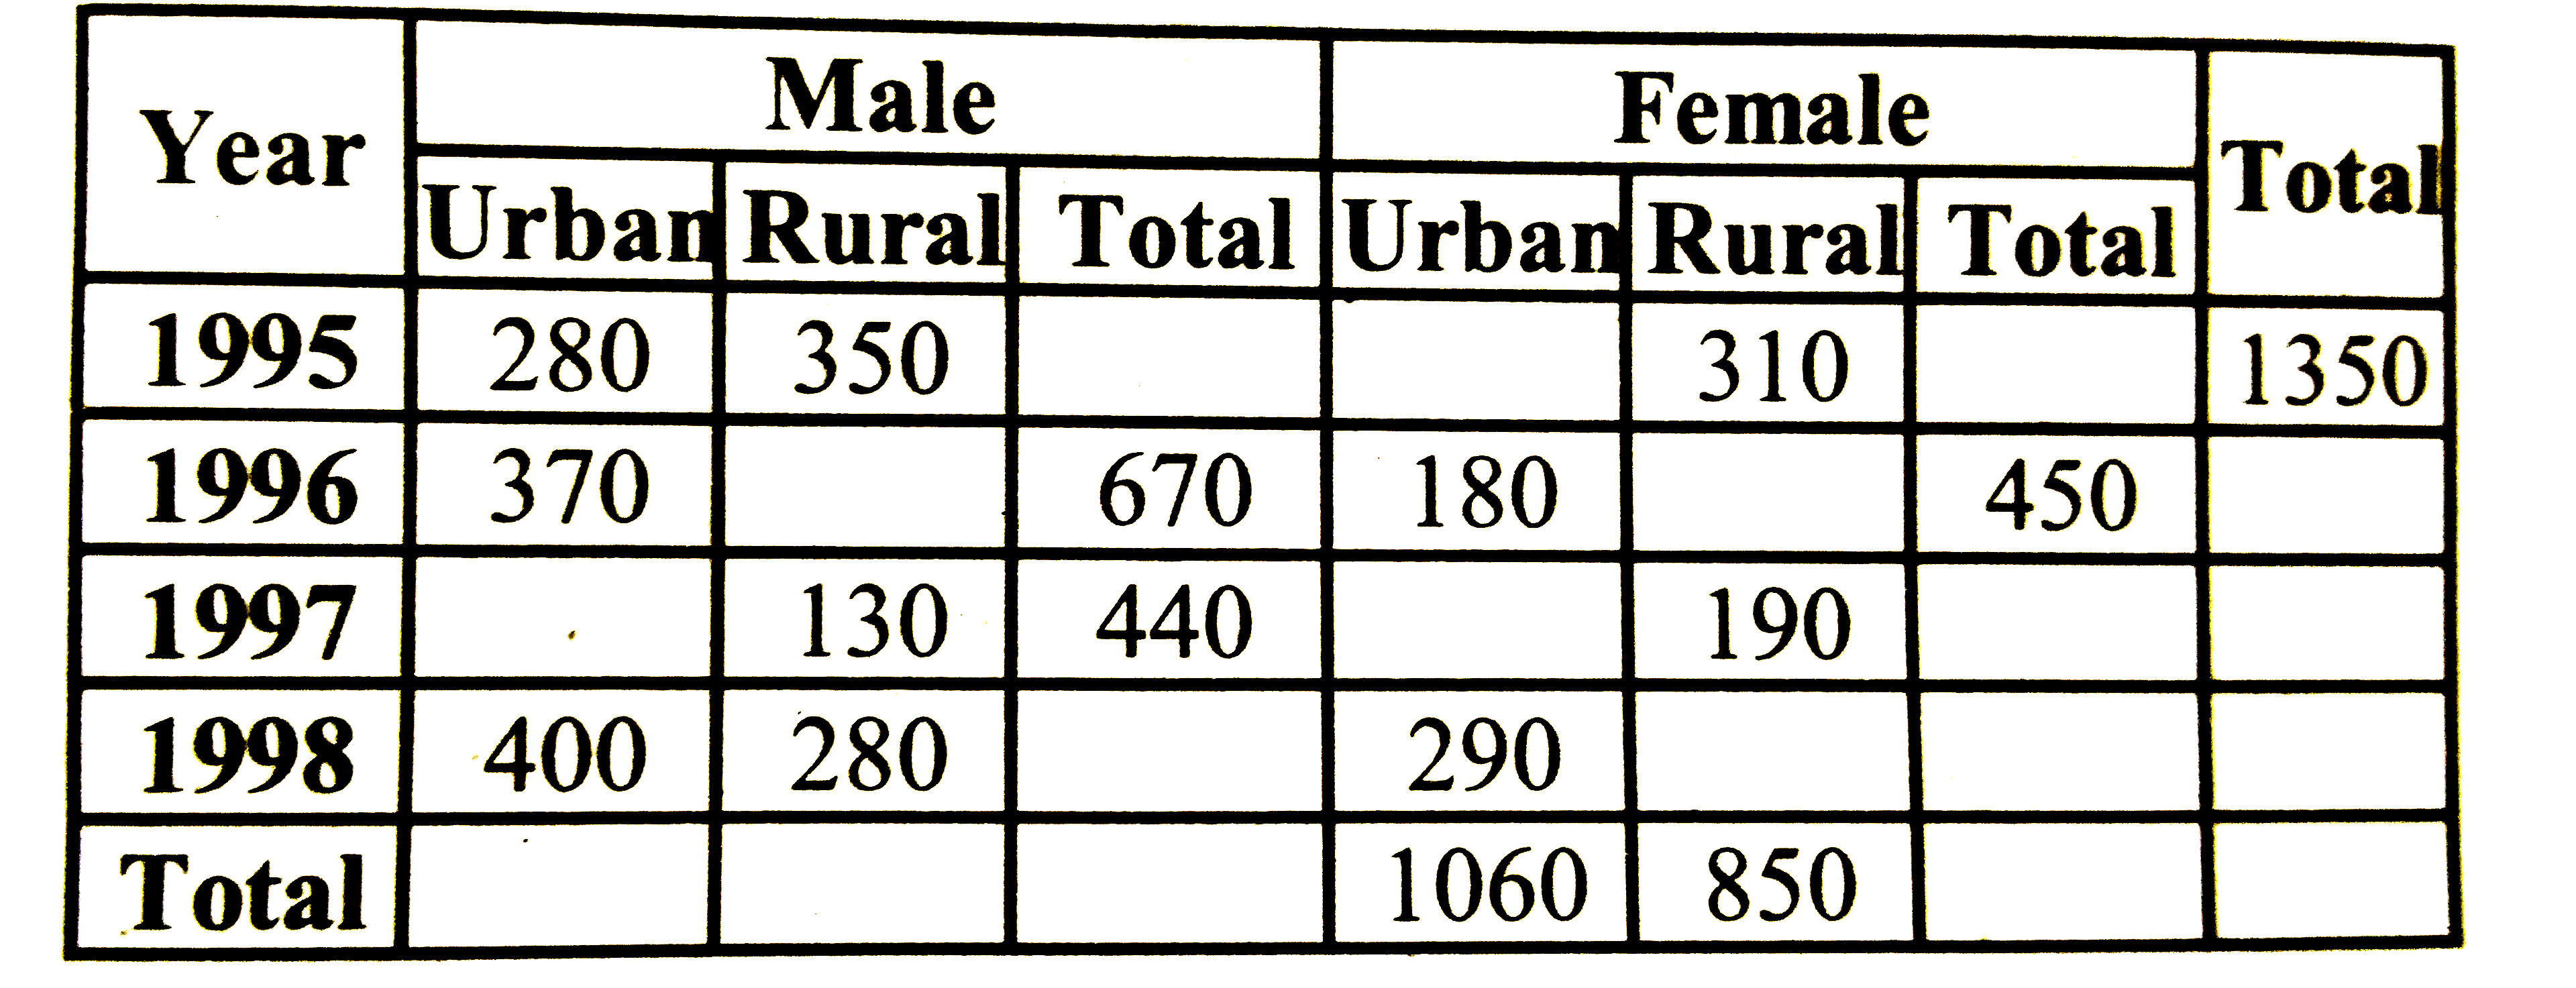
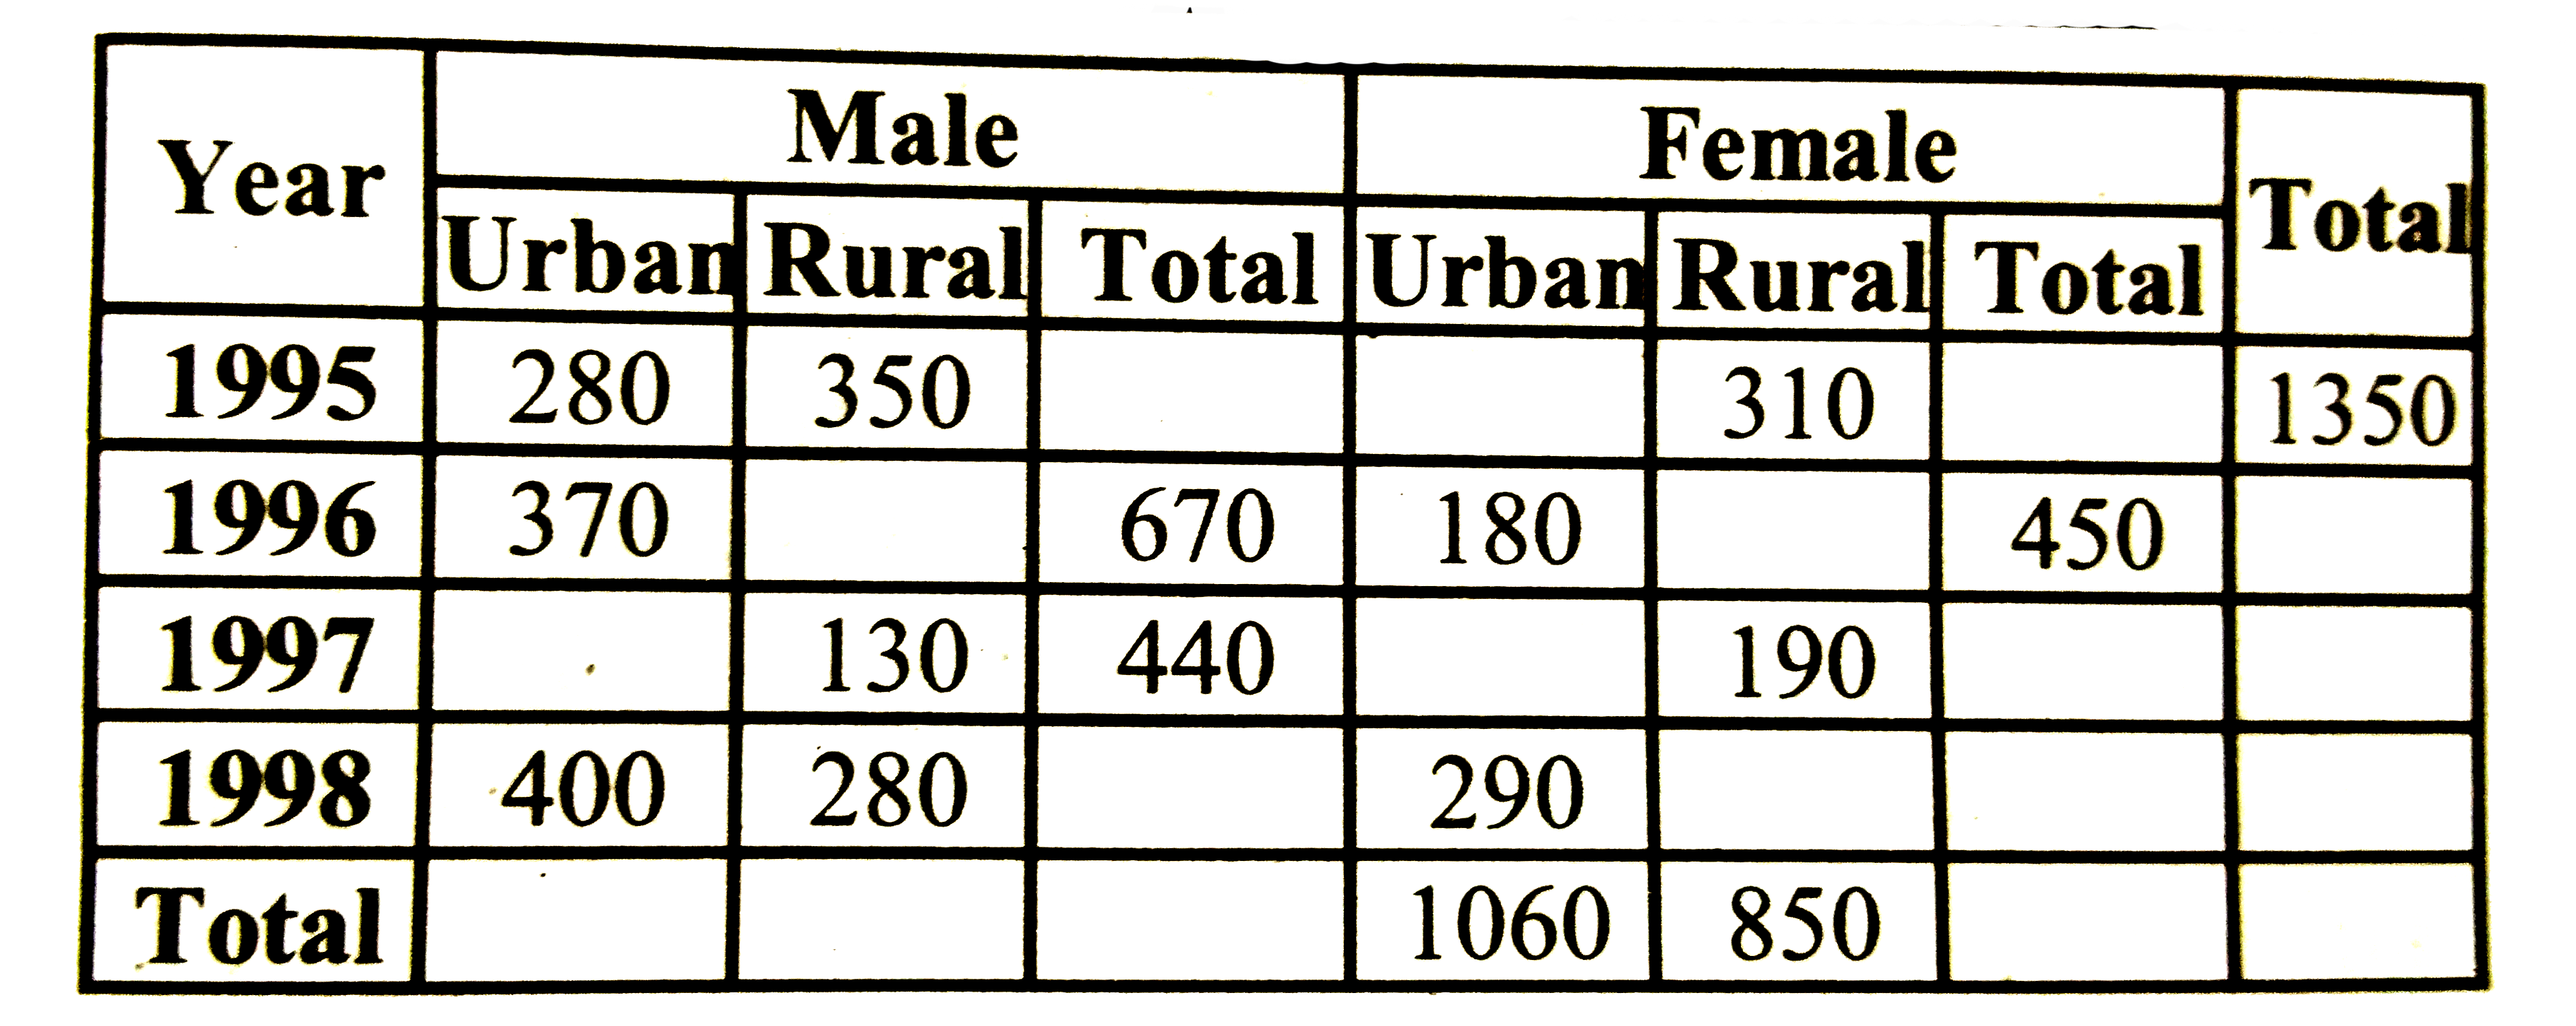
What is the total population for the year 1997?
View Solution
What is the female urban population in the year 1995?
View SolutionThe population of a city increases at the rate of 15% pa. If its population was 4000 at the end of year 2013 , then what will be its population at the end of year 2015.
View SolutionThe annual increase in the population of a town is 10%. If the present population of the town is 180000, then what will be its population after two years ?
View SolutionThe population of a town increases at a rate proportional to the population at that time . If the population increases from 40 thousands to 60 thousands in 40 years, What will be the population in another 20 years ? = [ Given: √32=1.2247 ]
View SolutionThe population of a city was 20,000 in the year 1997. It increased at the rate of 5% p.a. Find the population at the end of the year 2000.
View Solution


