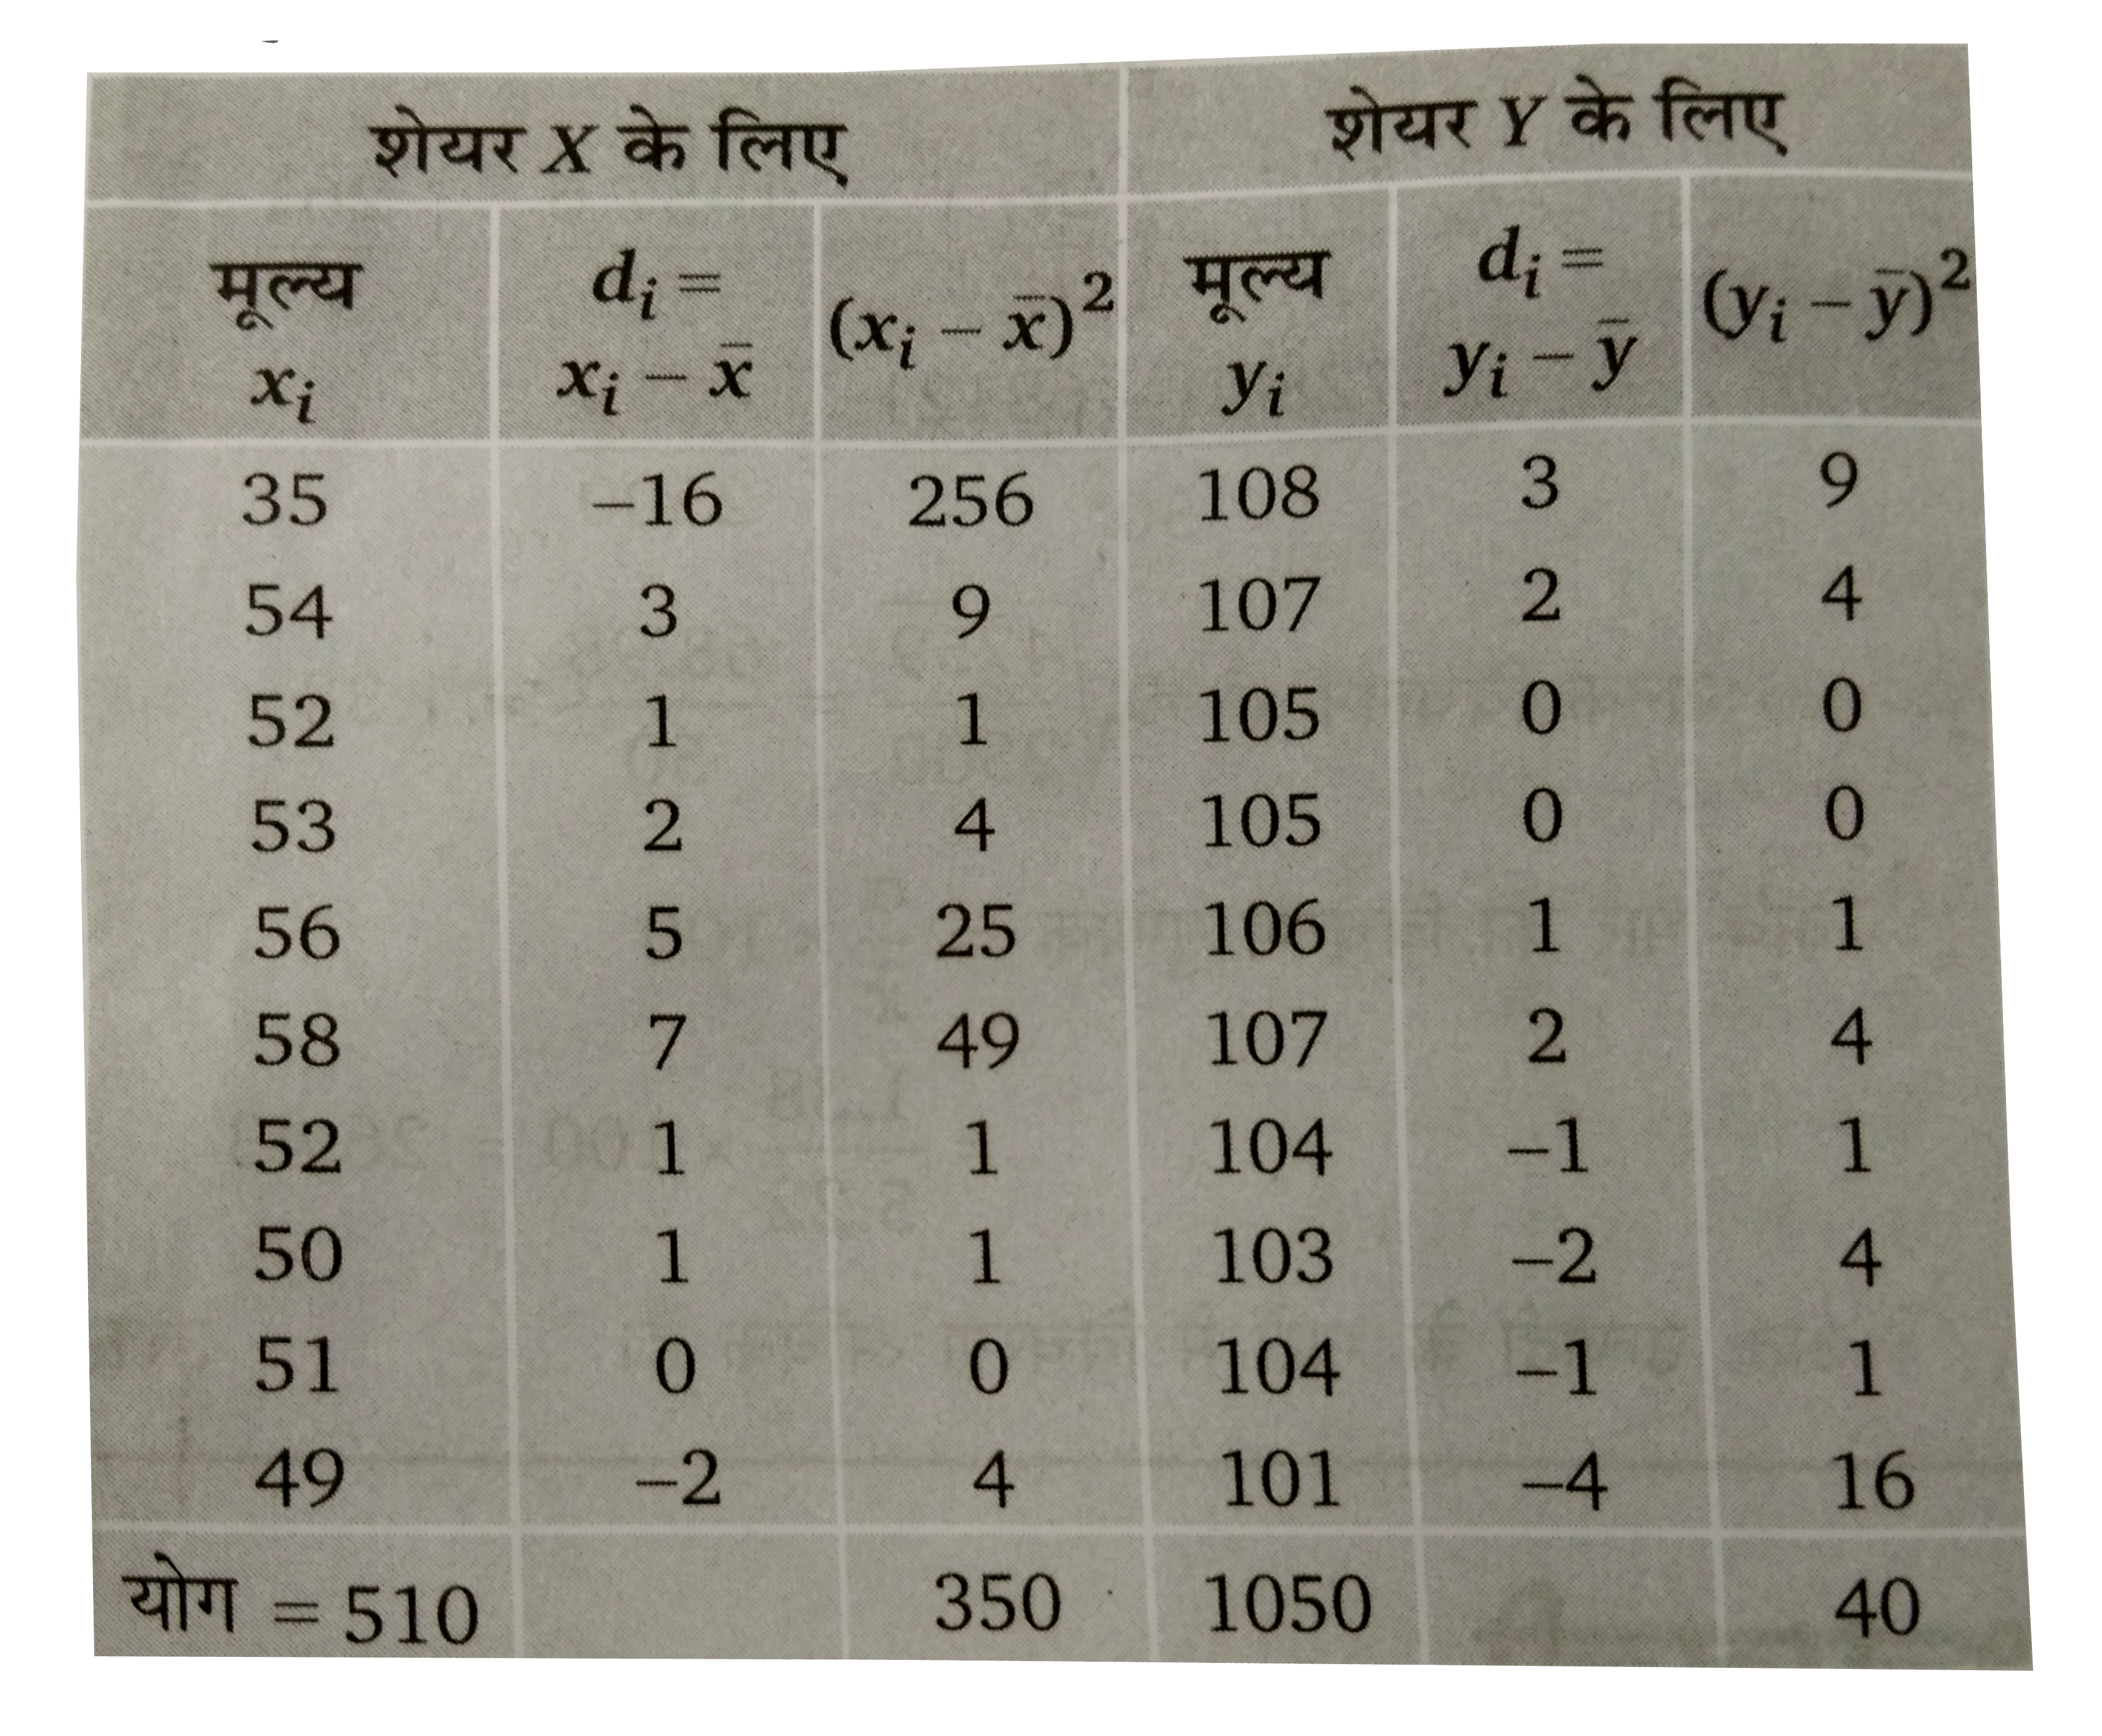
शेयरों X और Y के नीचे दिए गए मूल्यों से बताइये की किस के मूल्यों में अधिक स्थरता है


शेयर X के लिए
माध्य ¯x=sumxin=51010=51
तथा प्रसारण =sum(xi¯x)2n=35010=35
शेयर Y के लिए
माध्य ¯y=sumyin=105010=105
तथा प्रसारण =sum(yi−¯y)2n=4010=4
∴ शेयर Y के मूल्यों में प्रसारण कम है
∴ शेयर Y के मूल्यों में इस्थिरता अधिक है
Topper's Solved these Questions
- सांख्यिकी BOOK - NOOTAN HINDICHAPTER - सांख्यिकी EXERCISE - विविध प्रश्नावली
7 Videos
- सांख्यिकी BOOK - NOOTAN HINDICHAPTER - सांख्यिकी EXERCISE - प्रश्नावली (15.2)
10 Videos
- सरल रेखायेंBOOK - NOOTAN HINDICHAPTER - सरल रेखायेंEXERCISE - विविध प्रश्नावली
24 Videos
- सीमा और अवकलज BOOK - NOOTAN HINDICHAPTER - सीमा और अवकलज EXERCISE - विविध प्रश्नावली
30 Videos
Similar Questions
आठ प्रेक्षणों का माध्य तथा प्रसारण क्रमशः 9 और 9.25 है यदि इनमे से छः प्रेक्षण 6,7,10,12,12 और 13 है ज्ञात कीजिये तो शेष दो प्रेक्षण ज्ञात कीजिये
View Solution1 से 5 तक की आंकड़ों की लिए माध्य व प्रसरण ज्ञात कीजिये
1,6,7,10,12,13,4,8,12
View Solutionk के मान ज्ञात कीजिए जबकि रेखा
(k−3)x−(4−k2)y+k2−7k+6=0
(i) x-अक्ष के समांतर है ।
(ii) y-अक्ष के समांतर है ।
(iii) मूल बिन्दु से जाती है।
View Solutionप्रथम सिद्धान्त से निम्नलिखित फलनों का अवकलज ज्ञात कीजिए :
(i) −x
(ii) (−x)−1
(iii) sin(x+1)
(iv) cos(x−π8)
View SolutionHow many lines of symmetry does the above figure have ?
View SolutionWhich of the following are correct chain isomers of butane ? (i)
View SolutionDetermine the point of symmetry of a regular hexagon.
View SolutionDtermine the images of the following figure about the given line :
View SolutionMatch the following Column A to Column B

View SolutionMatch the following Column A to Column B

View SolutionMatch the following Column A to Column B

View SolutionFind the area of the figure given below.

View SolutionThe inequation represented by the graph given below is :
View SolutionThe inequation that best describes the graph given below is _________
View SolutionThe inequation that best describes the following graph is _________
View SolutionWhich inequations represent the shaded region in the given figure
View Solution
