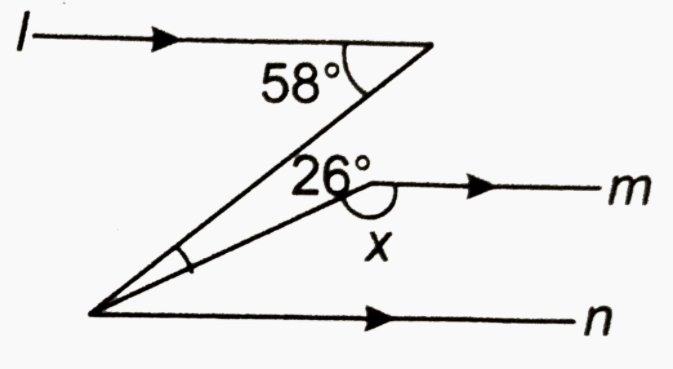
निम्नलिखित चित्रों में l||m||n है, तो प्रत्येक में x का मान ज्ञात कीजिये :

140∘
108∘
128∘
148∘
The correct Answer is:D
Step by step video & image solution for निम्नलिखित चित्रों में l"||"m"||"n है, तो प्रत्येक में x का मान ज्ञात कीजिये : by Maths experts to help you in doubts & scoring excellent marks in Class 9 exams.
Updated on:21/07/2023Topper's Solved these Questions
- रेखाएं और कोण BOOK - NOOTAN HINDICHAPTER - रेखाएं और कोण EXERCISE - प्रशनावली 6C
19 Videos
- रेखाएं और कोण BOOK - NOOTAN HINDICHAPTER - रेखाएं और कोण EXERCISE - प्रशनावली 6.1
6 Videos
- रेखाएं और कोण BOOK - NOOTAN HINDICHAPTER - रेखाएं और कोण EXERCISE - प्रशनावली 6A
19 Videos
- रचनाएँBOOK - NOOTAN HINDICHAPTER - रचनाएँEXERCISE - विविध प्रश्नावली
7 Videos
- वृत्त BOOK - NOOTAN HINDICHAPTER - वृत्त EXERCISE - विविध प्रश्नावली (दीर्ध उत्तरीय प्रश्न)
5 Videos
Similar Questions
एक त्रिभुज के कोण (3x)∘,(2x−7)∘ और (4x−11)∘ है x का मान तथा त्रिभुज का प्रत्येक कोण ज्ञात कीजिय ।
View Solutionआकृति में, रेखाएं AB और CD बणौन्दु O पर प्रतिच्छेद करती है यदि ∠AOC+∠BOE=70∘ है और ∠BOD=40∘ है, तो ∠BOE और प्रतिवर्ती ∠COE ज्ञात कीजिय |

View Solutionदो कोण 4:5 के अनुपात में है । कोण ज्ञात कीजिय यदि वे एक - दूसरे के (i) पूरक है, (ii) सम्पूरक है ।
View Solutionनिम्नलिखित कोणो को बनाइए:
(i) 60∘ (ii)90∘ (iii) 120∘ (iv) 180∘ (v) 270∘
View Solutionएक वृत्त की दो जीवायें AB और CD केन्द्र के एक ही ओर इस प्रकार हैं कि AB = 6 सेमी, CD = 12 सेमी और AB∣∣CD हैं | यदि AB और CD के मध्य दूरी 3 सेमी है, तो वृत्त की त्रिज्या ज्ञात कीजिए |
View SolutionHow many lines of symmetry does the above figure have ?
View SolutionWhich of the following are correct chain isomers of butane ? (i)
View SolutionDetermine the point of symmetry of a regular hexagon.
View SolutionDtermine the images of the following figure about the given line :
View SolutionMatch the following Column A to Column B

View SolutionMatch the following Column A to Column B

View SolutionMatch the following Column A to Column B

View SolutionThe inequation represented by the graph given below is :
View SolutionThe inequation that best describes the graph given below is _________
View SolutionThe inequation that best describes the following graph is _________
View SolutionWhich inequations represent the shaded region in the given figure
View Solution
