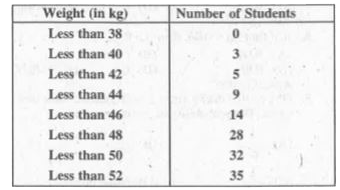
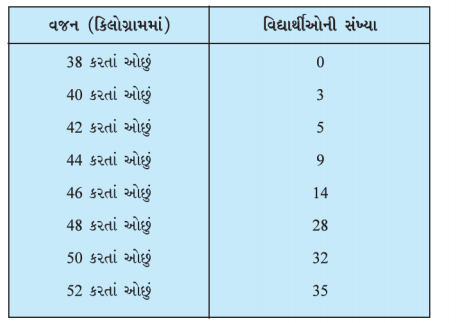
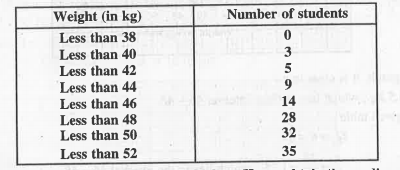
Draw a less than and more than median weight from the graph and type ogive for the given data. Hence find the verify the result by using the formula.
Step by step video & image solution for Draw a less than and more than median weight from the graph and type ogive for the given data. Hence find the verify the result by using the formula. by Maths experts to help you in doubts & scoring excellent marks in Class 10 exams.
Updated on:21/07/2023समान प्रश्न
During the medical check up of 35 students of a class, their weights were recorded as follows :
Draw a less then type ogive for the given data. Hence obtain the median weight from the graph and verify the result by using the formula.

View SolutionFind the mode of the given data 4,5,5,4,7,2,3,4,2,4,5
View SolutionDuring the medical check-up of 35 students of a class, their weights were recorded as follows :

Draw a less than type ogive for the given data. Hence, obtain the median weight from the graph and verify the result by using the formula.
View SolutionFor the following data, draw a 'less than' ogive and hence find the median of the distribution.

View SolutionWhat is the value of the median of the data using the graph in the following figure of less than ogive and more than ogive? (FIGURE)
View SolutionDuring the medial check up of 35 students of a class, their weights were recorded as follows:

Draw a less than type ogive for the given data. Hence obtain the median weight from the graph and verify the result by using the formula.
View SolutionHeight of 50 plants in a garden were recorded and data is presented as below:

Draw ‘less than’ ogive and ‘more than’ ogive simultaneously on the same graph and find the median of the data from graph. Also verify your result by using formula.
View SolutionIf the less than type Ogive and more than type Ogive intersect each other at (42, 18), then the median of the given data is
View Solution