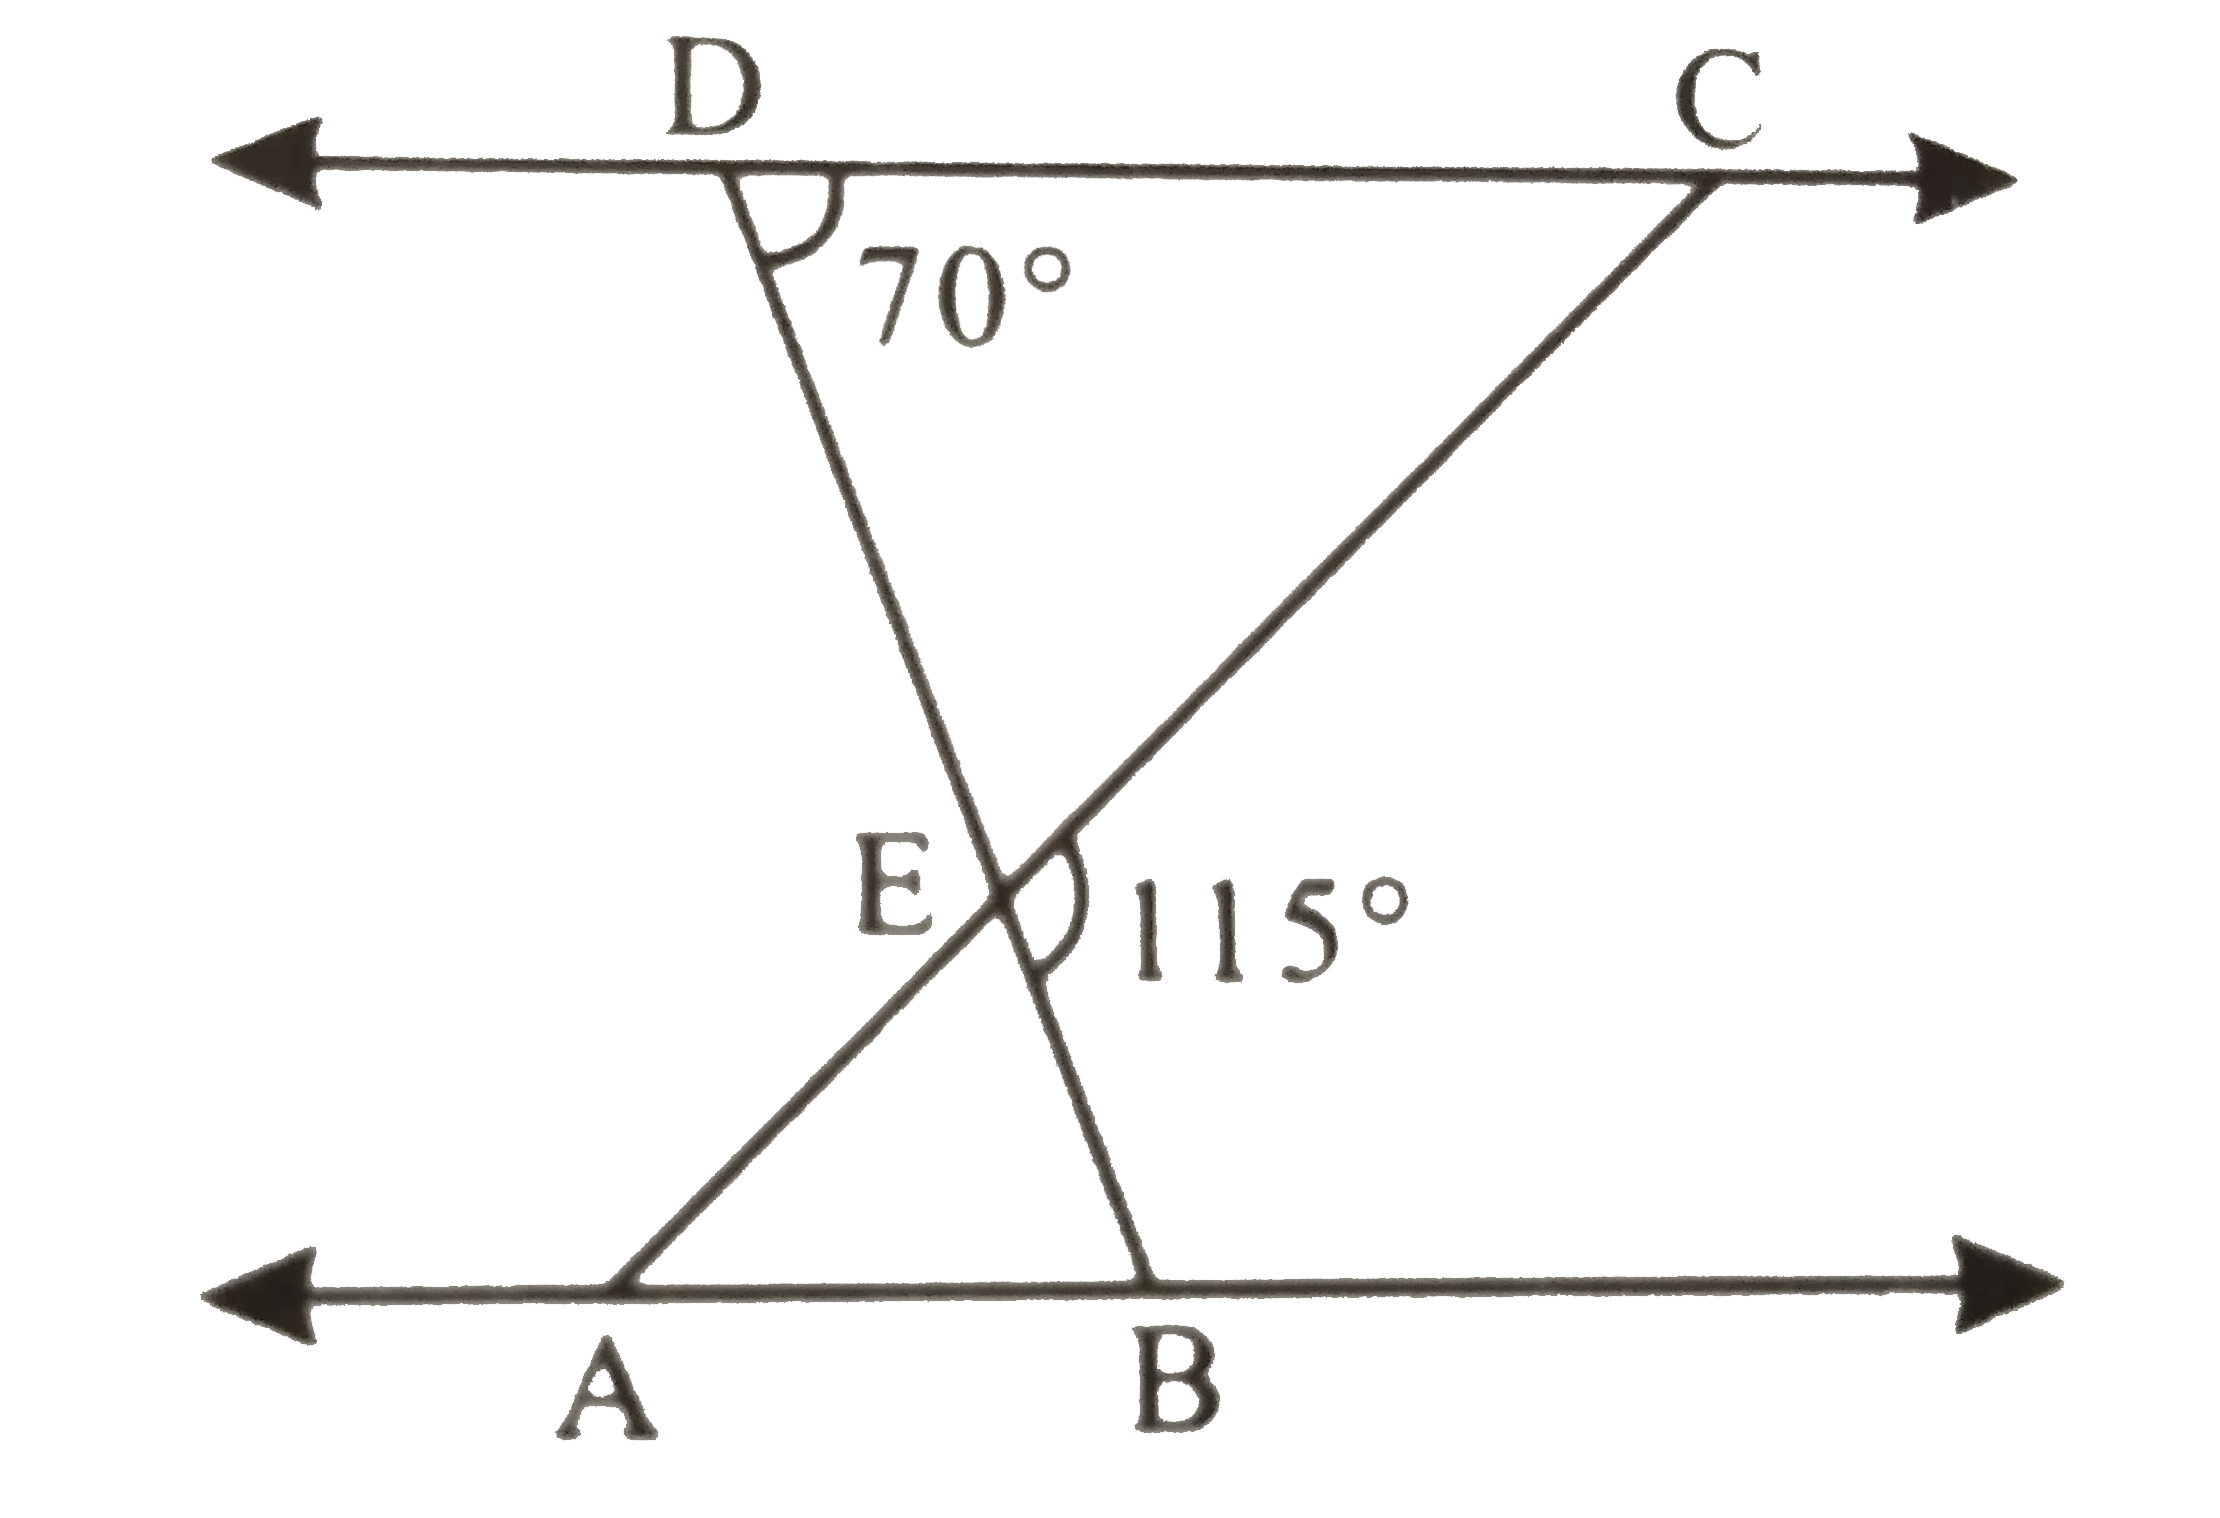
दी गई आकृति में, यदि △EDC तथा △EBA समरूप है । ∠BEC=115∘ तथा ∠EDC=70∘ तब ∠DEC,∠DCE,∠EAB,∠AEB तथा ∠EBA ज्ञात कीजिए ।

चित्र द्वारा, यहाँ ∠DEC+∠BEC=180∘
⇒∠DEC+115∘=180∘⇒∠DEC=65∘
अब, चूँकि ∠AEB तथा ∠DEC सीर्षाभिमुख कोण है, इसलिए
∠AEB=∠DEC⇒∠AEB=65∘
तथा △CDE में
∠CDE+∠DEC+∠DCE=180∘
⇒70∘+65∘+∠DCE=180∘⇒∠DCE=45∘
चूँकि यह दिया गया है कि, △EDC~△EBA
इसलिए ∠EBA=∠EDC तथा ∠EAB=∠ECD
⇒∠EBA=70∘ तथा ∠EAB=45∘
Topper's Solved these Questions
- त्रिभुज BOOK - BALAJI PUBLICATIONCHAPTER - त्रिभुज EXERCISE - अभ्यास प्रश्न 7.1
9 Videos
- त्रिभुज BOOK - BALAJI PUBLICATIONCHAPTER - त्रिभुज EXERCISE - अभ्यास प्रश्न 7.2
17 Videos
- त्रिकोणमितीय अनुपात एव असमिकाएँ BOOK - BALAJI PUBLICATIONCHAPTER - त्रिकोणमितीय अनुपात एव असमिकाएँ EXERCISE - स्वमूल्यांकन परीक्षण
35 Videos
- दो चर वाले रैखिक समीकरण युग्म BOOK - BALAJI PUBLICATIONCHAPTER - दो चर वाले रैखिक समीकरण युग्म EXERCISE - स्वमूल्यांकन परीक्षण
29 Videos
Similar Questions
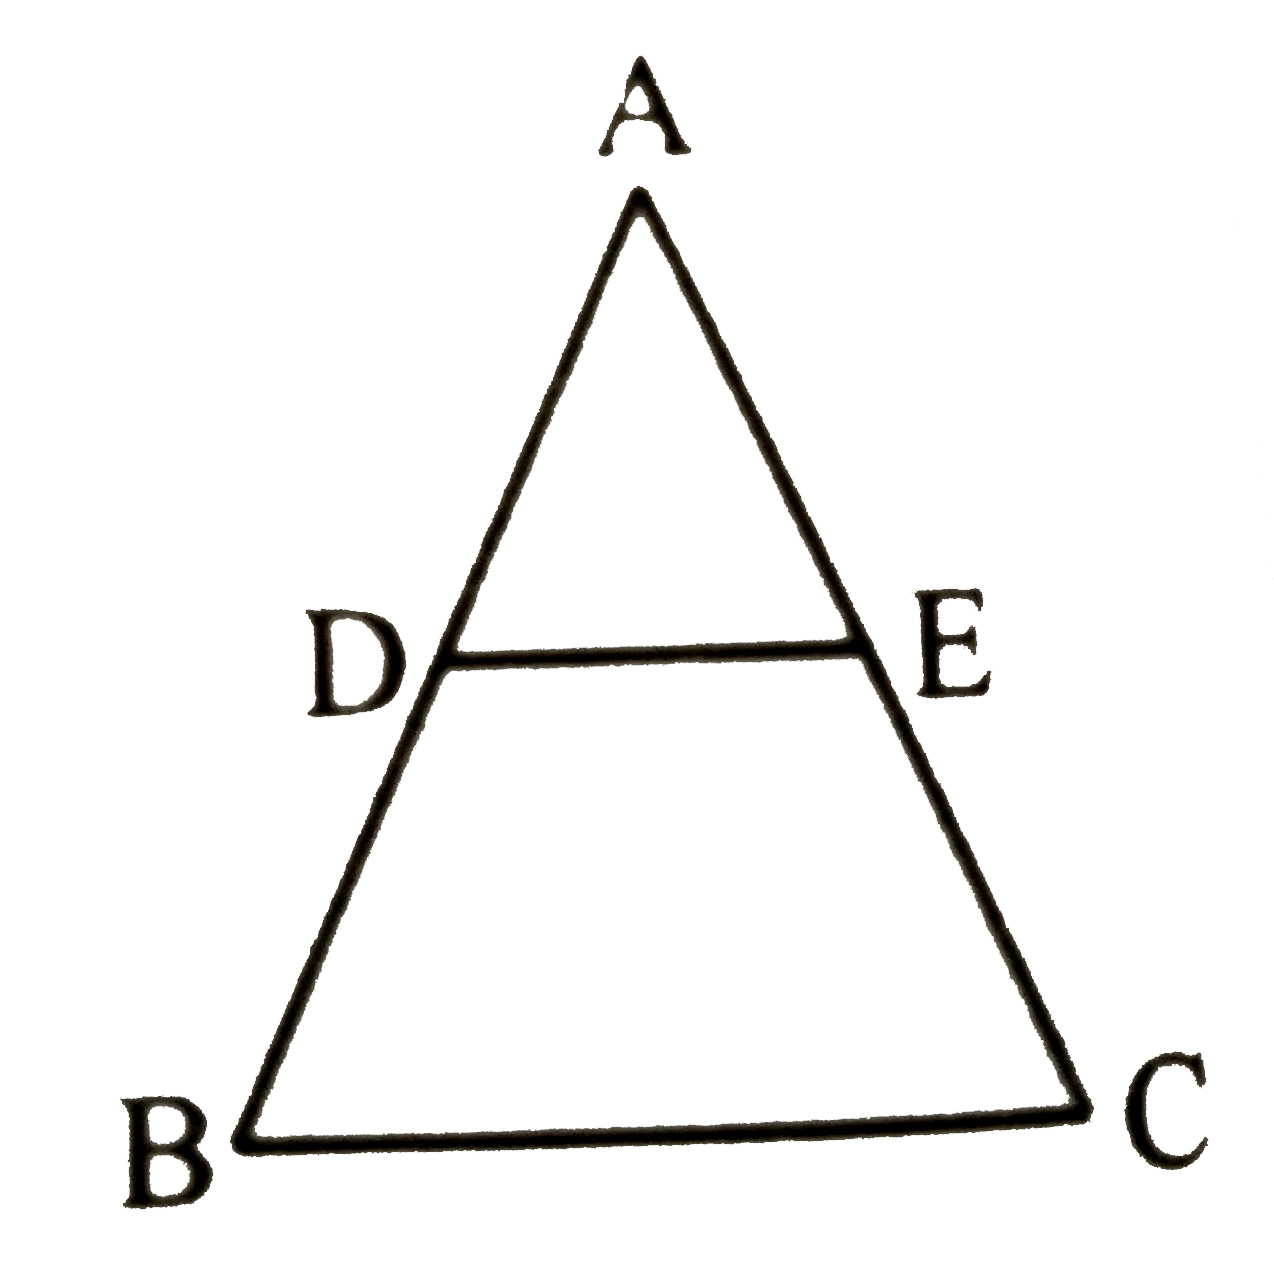
दी गई आकृति में DE∣∣BC यदि AD=2.5 सेमी, DB = 3 सेमी तथा AE = 3.75 सेमी है तो AC का मान ज्ञात कीजिए |

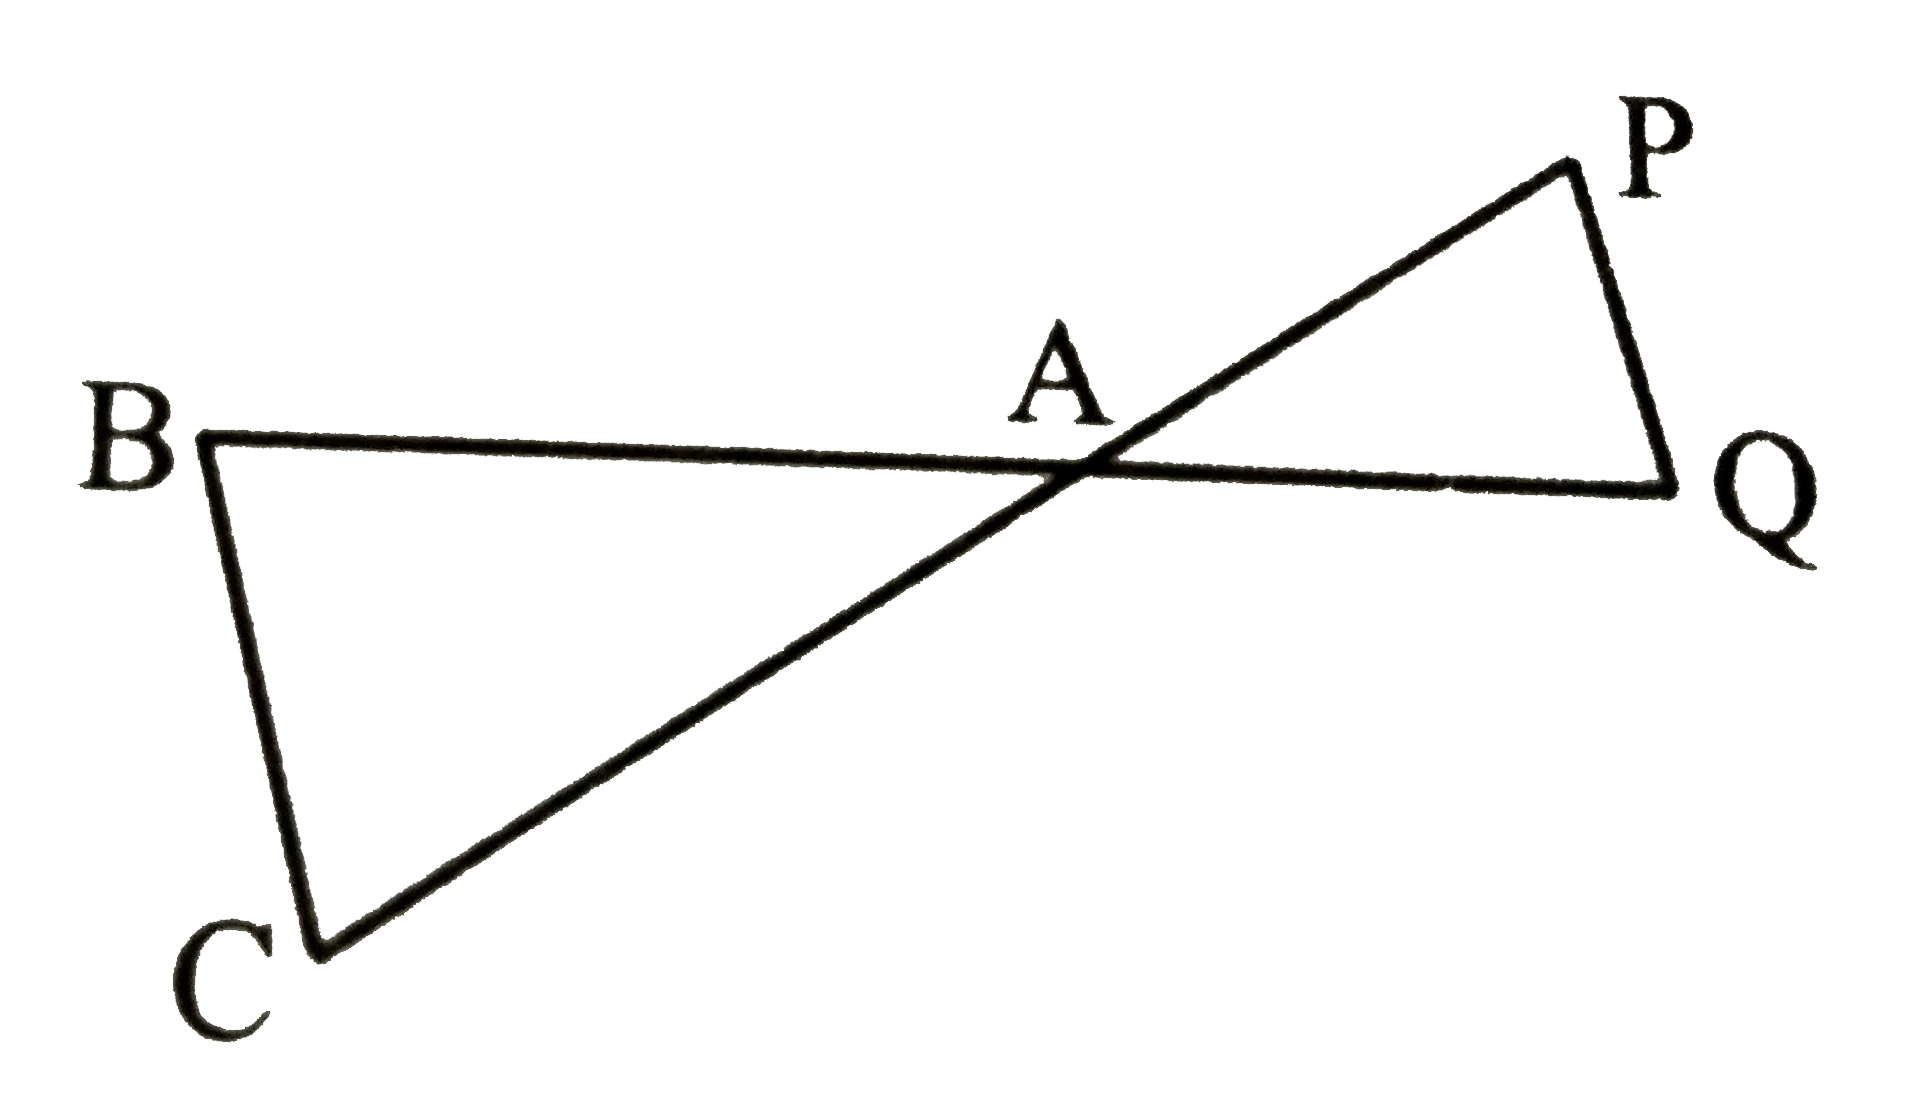
View Solutionदी गई आकृति में △ACB~△APQ है यदि BC=8 सेमी०, PQ=4 सेमी०, BA = 6.5 सेमी०, AP = 2.8 सेमी० है तो CA तथा AQ ज्ञात कीजिए |

View Solutionयदि cosθ=1√122, तब sinθ व tanθ के मान ज्ञात कीजिए.
View Solutionकिसी भिन्न के अंश से यदि 1 घटाया जाये तो वह 13 तथा यदि हर में 8 जोड़ा जाये तो वह 14 हो जाती है। भिन्न ज्ञात कीजिए।
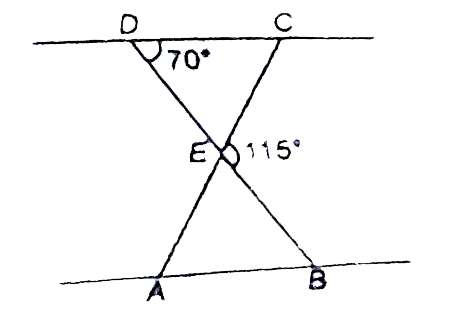
View SolutionIn the given figure if △EDC~△EBA,∠BEC=115∘and∠EDC=70∘.Find∠DEC,∠DCE,∠EAB,∠AEBand∠EBA.

View SolutionHow many lines of symmetry does the above figure have ?
View SolutionWhich of the following are correct chain isomers of butane ? (i)
View SolutionDetermine the point of symmetry of a regular hexagon.
View SolutionDtermine the images of the following figure about the given line :
View SolutionMatch the following Column A to Column B

View SolutionMatch the following Column A to Column B

View SolutionMatch the following Column A to Column B

View SolutionFind the area of the figure given below.

View SolutionThe area of the shaded part in the figure given below is ______.

View SolutionThe inequation represented by the graph given below is :
View Solution
