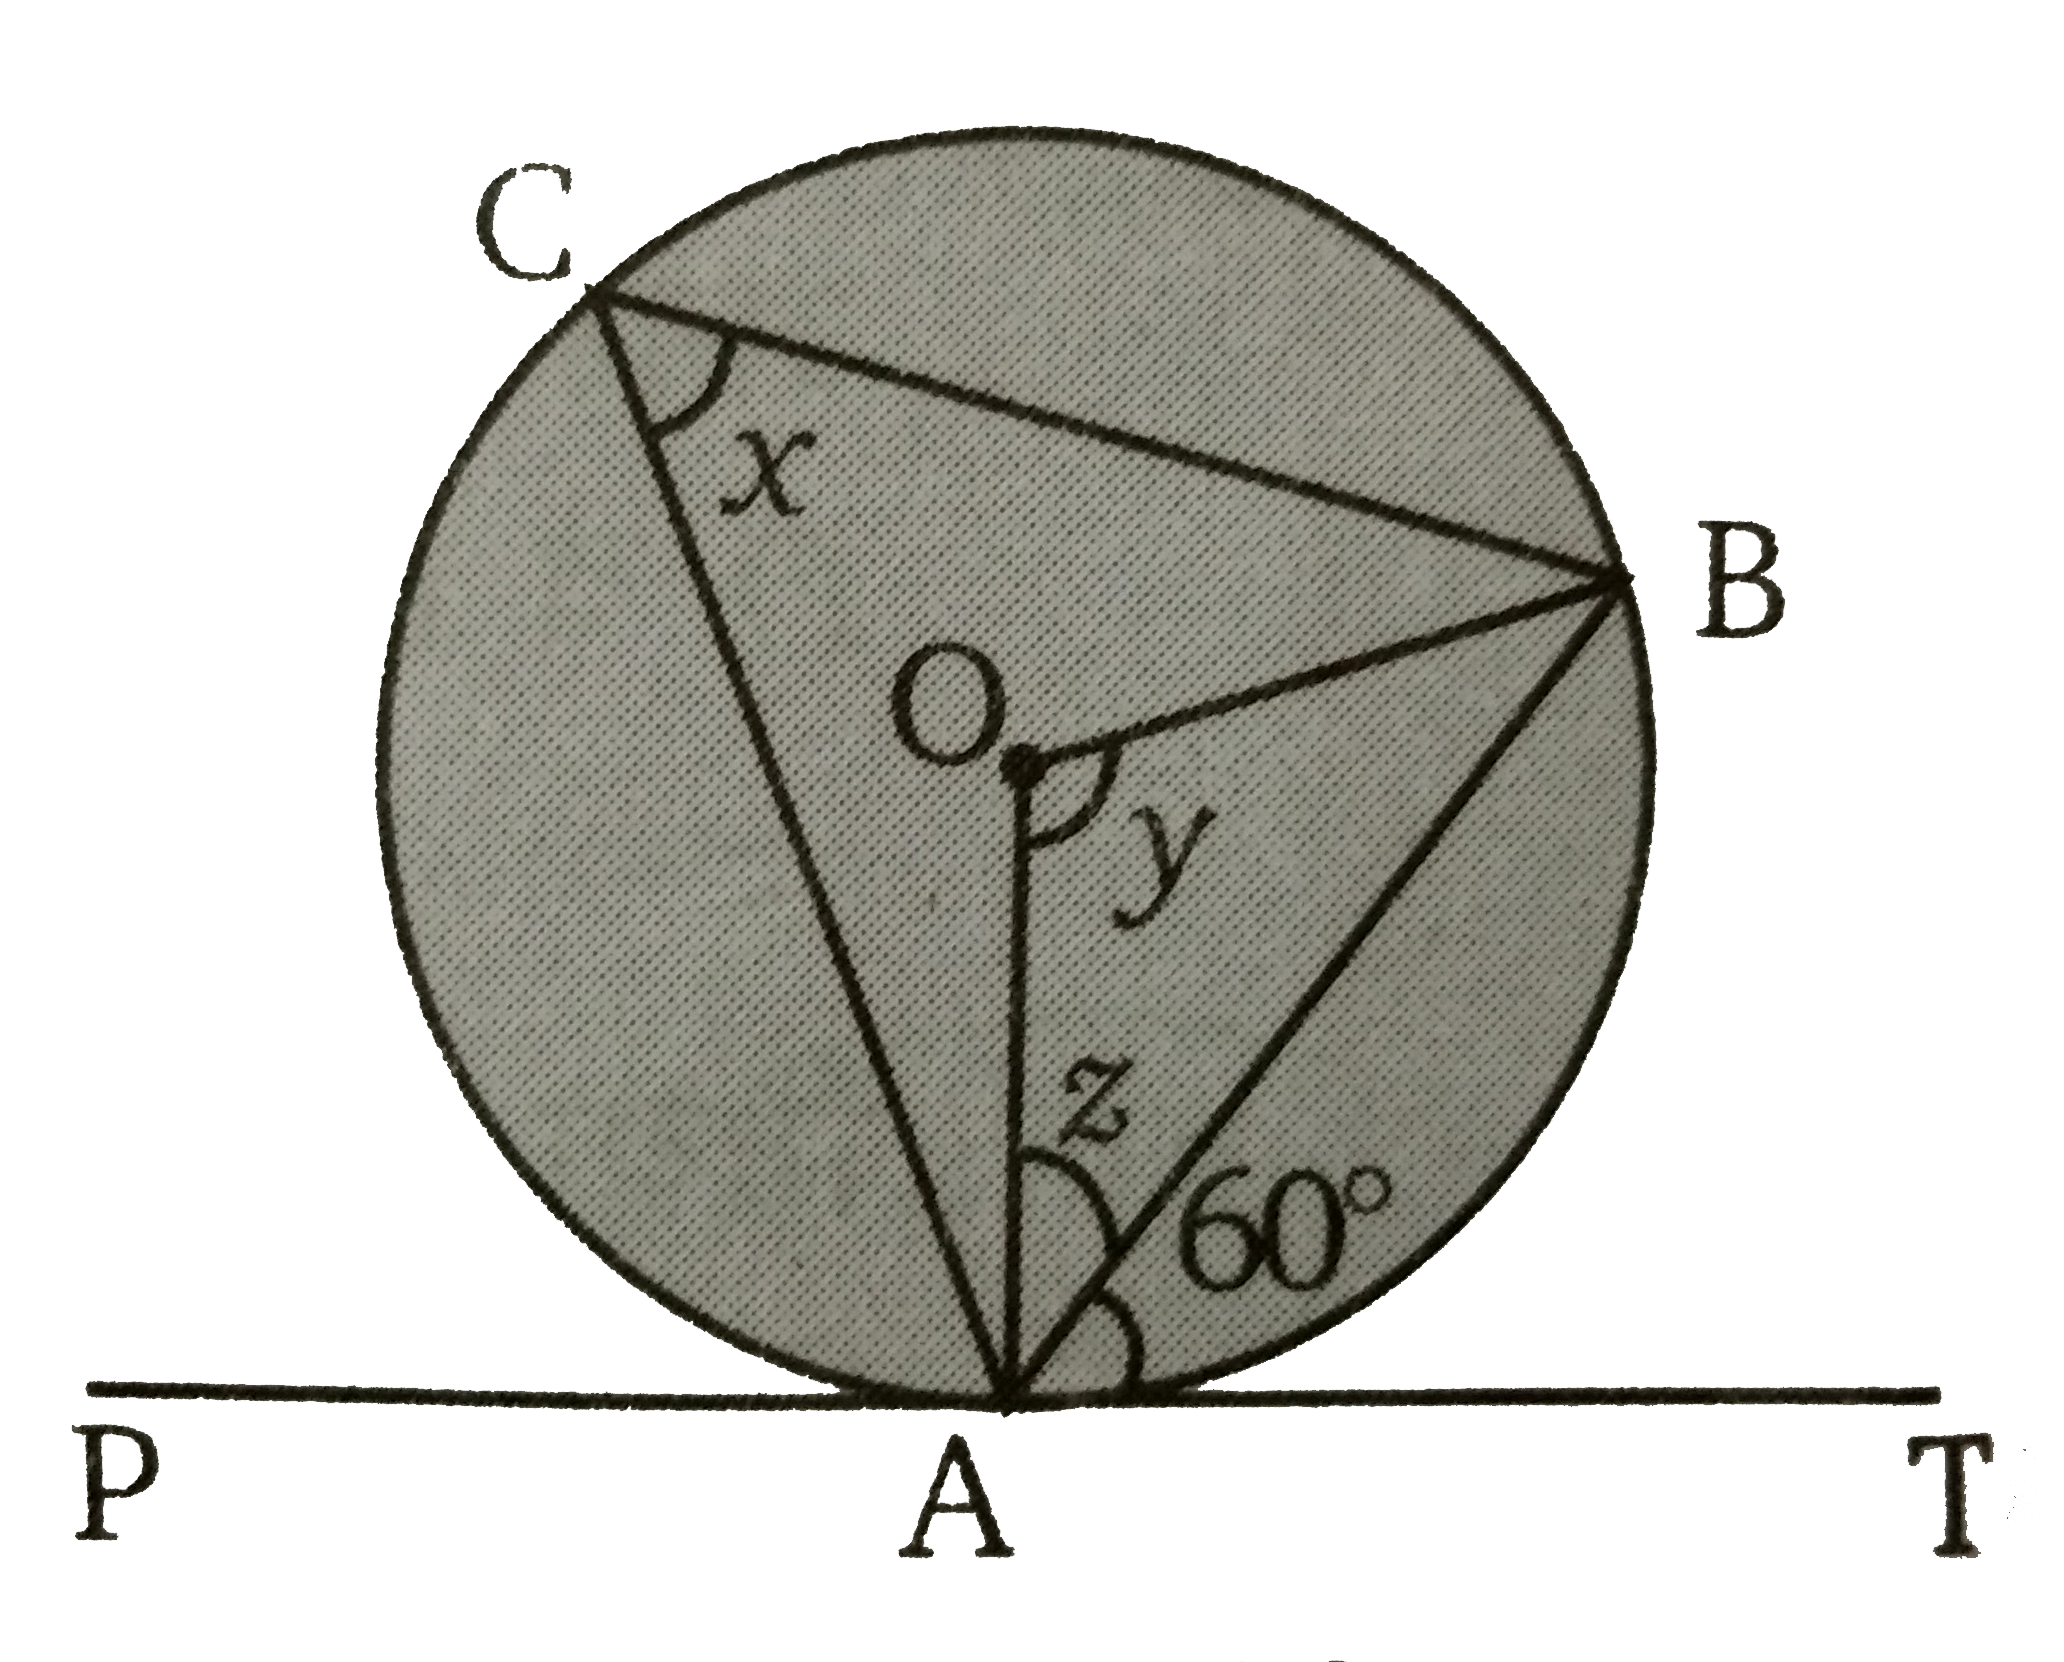
दिए गये चित्र में O वृत्त का केंद्र है तथा AT वृत्त पर स्पर्शी है। तब x, y व z के मान ज्ञात कीजिए ।

x=60∘, y=120∘, z=30∘
x=30∘, y=120∘, z=30∘
x=30∘, y=120∘, z=60∘
इनमे से कोई नहीं
The correct Answer is:A
∠x∘=∠BAT=60∘ (एकान्तर वृत्तखंड के कोण)
∠AOB=2∠ACB
y=2×x=2×60∘=120∘
अब ΔAOB में, OA = OB
∠OAB=∠OBA=z
∠OAB+∠ABO+∠BOA=180∘
2z=180∘−∠AOB⇒2z=180∘−120∘=60∘
z=60∘2=30∘
Topper's Solved these Questions
- वृत्त BOOK - BALAJI PUBLICATIONCHAPTER - वृत्त EXERCISE - अभ्यास प्रश्न 8.1 (अतिलघु उत्तरीय प्रश्न)
4 Videos
- वृत्त BOOK - BALAJI PUBLICATIONCHAPTER - वृत्त EXERCISE - अभ्यास प्रश्न 8.1 (लघु उत्तरीय प्रश्न - II)
2 Videos
- वास्तविक संख्याऐंBOOK - BALAJI PUBLICATIONCHAPTER - वास्तविक संख्याऐंEXERCISE - स्वमूल्यांकन परीक्षण
18 Videos
- वृत्तों से समबन्धित क्षेत्रफल BOOK - BALAJI PUBLICATIONCHAPTER - वृत्तों से समबन्धित क्षेत्रफल EXERCISE - स्वमूल्यांकन परीक्षण
15 Videos
Similar Questions
6 सेमी त्रिज्या के वृत्त के केन्द्र से 8 सेमी दूर स्थित एक बिंदु से खींची गई स्पर्श रेखा की लम्बाई ज्ञात कीजिये ।
View Solutionएक बिंदु A वृत्त केन्द्र से 26 सेमी दूर है तथा A से वृत्त पर स्पर्शी की लम्बाई 24 सेमी है। वृत्त की त्रिज्या ज्ञात कीजिए ।
View Solutionनिम्नलिखित संख्या-युग्मो के HCF ज्ञात कीजिए ।
(i) 156, 13
(ii) 1001, 385
(iii) 81445, 687897
View Solution6 सेमी त्रिज्या वाले वृत्त पर 60∘ पर त्रिज्यखण्ड का क्षेत्रफल व परिमाप ज्ञात कीजिए ।
View SolutionHow many lines of symmetry does the above figure have ?
View SolutionWhich of the following are correct chain isomers of butane ? (i)
View SolutionDetermine the point of symmetry of a regular hexagon.
View SolutionDtermine the images of the following figure about the given line :
View SolutionMatch the following Column A to Column B

View SolutionMatch the following Column A to Column B

View SolutionMatch the following Column A to Column B

View SolutionThe inequation represented by the graph given below is :
View SolutionThe inequation that best describes the graph given below is _________
View SolutionThe inequation that best describes the following graph is _________
View SolutionWhich inequations represent the shaded region in the given figure
View SolutionIn Fig, find the value of x.
ltimg src="https://d10lpgp6xz60nq.cloudfront.net/physics_images/PS_MATH_IX_C12_S01_032_Q01.png" width="80%"gt
View Solution
