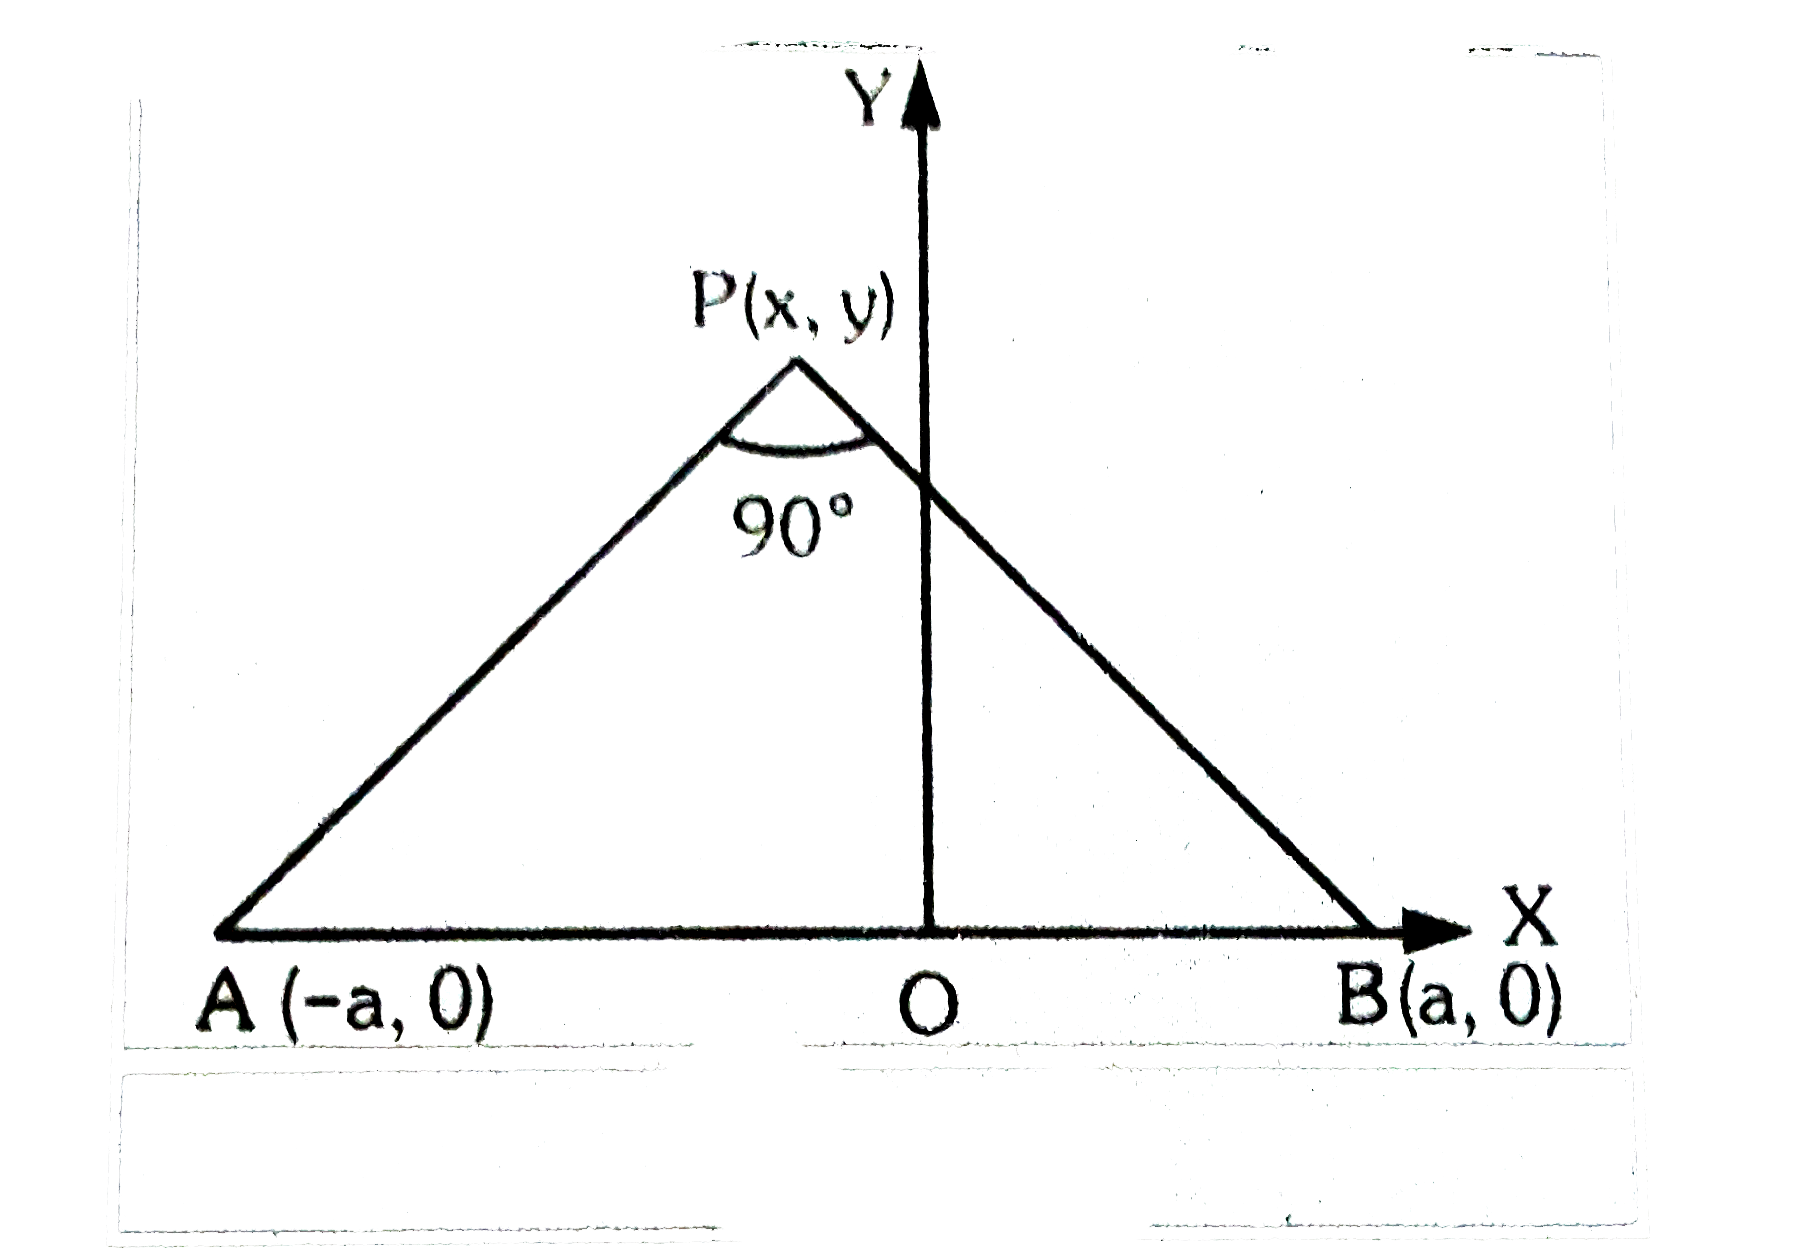
माना A तथा B दो स्थिर बिन्दु है | ऐसे बिन्दु P का बिन्दुपथ ज्ञात कीजिए जिससे ∠APB समकोण बनता है |

माना AB = 2a तथा P(x,y) एक चर बिन्दु है |
तथा A≡A(−a,0) तथा B≡B(a,0)
दिया है: ∠APB=90∘
⇒(AP)2+(PB)2=(AB)2
⇒(x+a)2+y2+(x−a)2+y2=(2a)2
⇒2x2+2y2+2a2=4a2
⇒x2+y2=a2
Topper's Solved these Questions
- समकोणीय कार्तीय निर्देशांक निकाय BOOK - BALAJI PUBLICATIONCHAPTER - समकोणीय कार्तीय निर्देशांक निकाय EXERCISE - अभ्यास प्रश्न 13.1
22 Videos
- समकोणीय कार्तीय निर्देशांक निकाय BOOK - BALAJI PUBLICATIONCHAPTER - समकोणीय कार्तीय निर्देशांक निकाय EXERCISE - NCERT प्रारूप प्रश्न
4 Videos
- शंकु परिच्छेदः वृतBOOK - BALAJI PUBLICATIONCHAPTER - शंकु परिच्छेदः वृतEXERCISE - स्वमूल्यांकन परीक्षण ((B) विवेचनात्मक सोच वाले प्रश्न )
3 Videos
- समुच्चय BOOK - BALAJI PUBLICATIONCHAPTER - समुच्चय EXERCISE - विवेचनात्मक सोच वाले प्रश्न
5 Videos
Similar Questions
एक आयत के तीन शीर्ष (0,0)(2,0) तथा (0,3) है | सिद्ध कीजिए चौथे शीर्ष के निर्देशांक (2,3) होंगे |
View Solutionकार्तीय तल में एक चतुर्भुज जिसके शीर्ष (−4,5),(0,7),(5,−5) और (−4,−2) है | इसका क्षेत्रफल भी ज्ञात कीजिए |
View Solutionसिद्ध कीजिए की तीन वृतों x2+y2−4x−6y−12=0, x2+y2+2x+4y−10=0 तथा x2+y2−10x−16y−1=0 के केंद्र संरेखाय हैं।
View Solutionदो परिमित समुच्चों m में n है, प्रथम समुच्चय के उपसमुच्चायों की कुल संख्या, द्वितीय समुच्चय के उपसमुच्चयों से 56 अधिक है, m व n के मान ज्ञात कीजिए।
View SolutionHow many lines of symmetry does the above figure have ?
View SolutionWhich of the following are correct chain isomers of butane ? (i)
View SolutionDetermine the point of symmetry of a regular hexagon.
View SolutionDtermine the images of the following figure about the given line :
View SolutionMatch the following Column A to Column B

View SolutionMatch the following Column A to Column B

View SolutionMatch the following Column A to Column B

View SolutionFind the area of the figure given below.

View SolutionThe inequation represented by the graph given below is :
View SolutionThe inequation that best describes the graph given below is _________
View SolutionThe inequation that best describes the following graph is _________
View SolutionWhich inequations represent the shaded region in the given figure
View Solution
