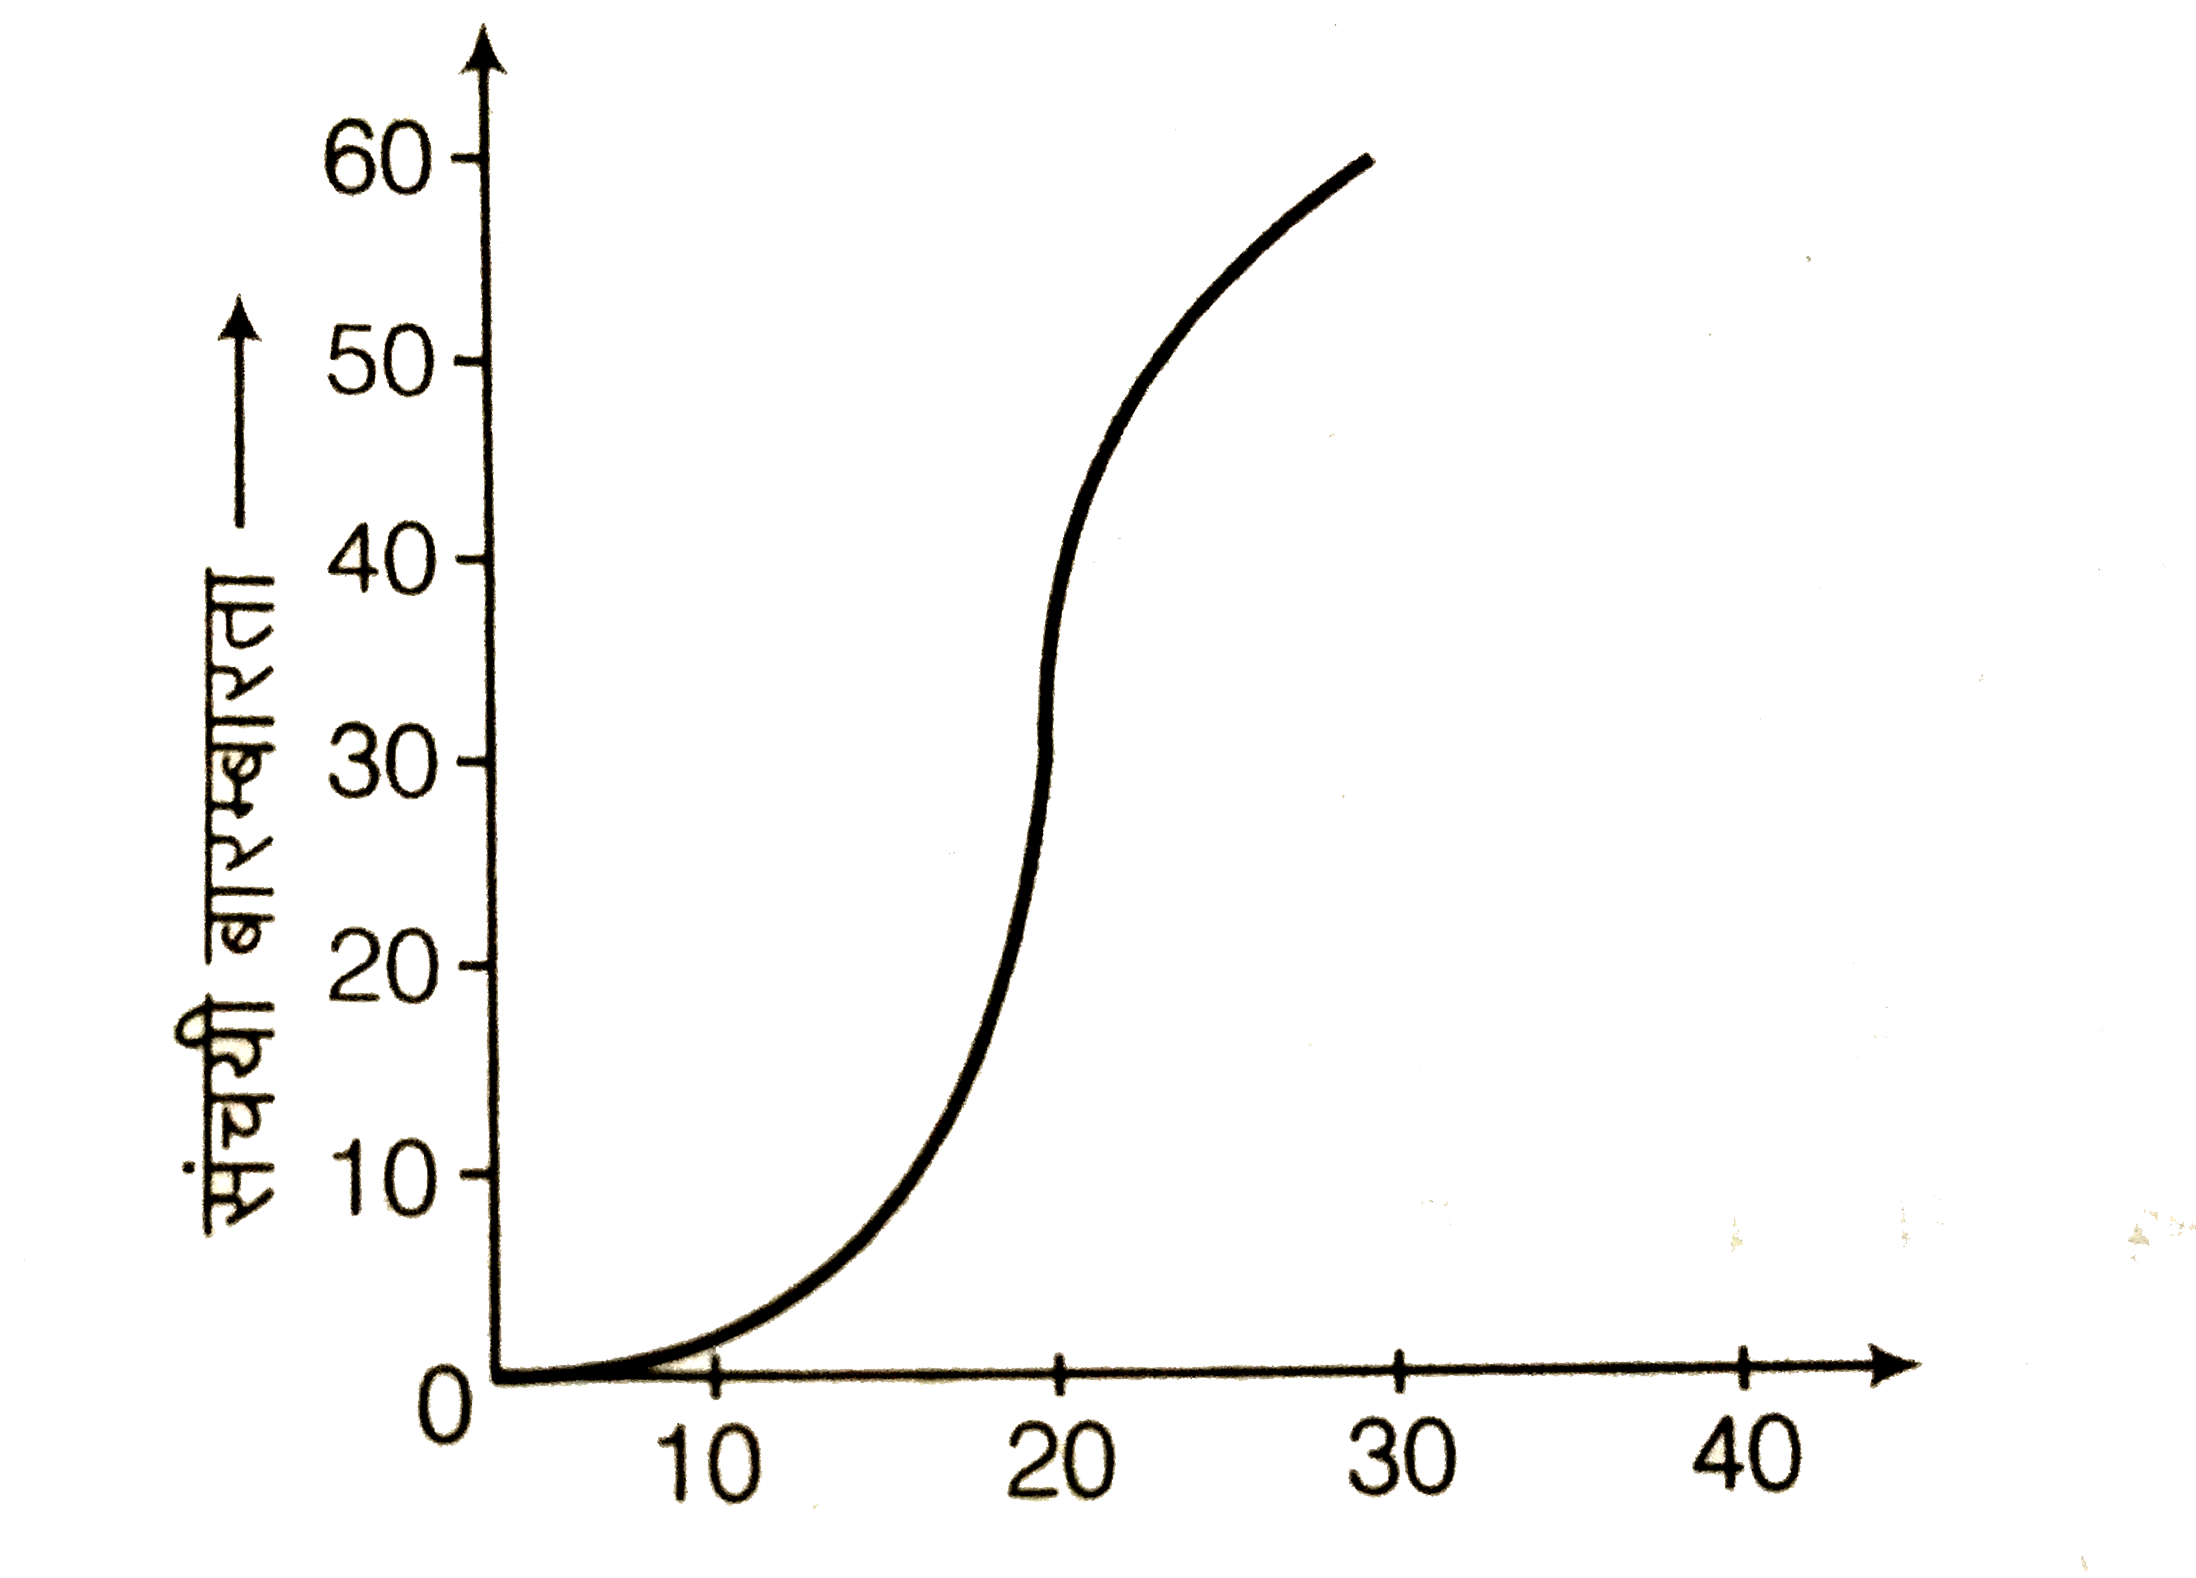
नीचे दिया गया चित्र प्रदर्शित करता है एक

पाई चार्ट
स्तम्भ चार्ट
तोरण
आयत चित्र
The correct Answer is:C
Step by step video & image solution for नीचे दिया गया चित्र प्रदर्शित करता है एक by Maths experts to help you in doubts & scoring excellent marks in Class 12 exams.
Updated on:21/07/2023Topper's Solved these Questions
- सांख्यिकीBOOK - NDA PATHFINDERCHAPTER - सांख्यिकीEXERCISE - विगत वर्षो के प्रश्न
59 Videos
- सांख्यिकीBOOK - NDA PATHFINDERCHAPTER - सांख्यिकीEXERCISE - विगत वर्षो के प्रश्न
59 Videos
- सम्मिश्र संख्याएँ BOOK - NDA PATHFINDERCHAPTER - सम्मिश्र संख्याएँ EXERCISE - अभ्यास प्रश्नावली
90 Videos
- सारणिक BOOK - NDA PATHFINDERCHAPTER - सारणिक EXERCISE - विगत वर्षो के प्रश्न
45 Videos
Similar Questions
आँकड़ो 20,20,20,21,21,21,21,21,22,22,22,22,22,22,22,23,23,23,23,23,24,24 तथा 25 का बहुलक क्या है?
View Solutionआँकड़ो 20,20,20,21,21,21,21,21,22,22,22,22,22,22,22,23,23,23,23,23,24,24 तथा 25 का बहुलक क्या है?
View Solution(i5+i6+i7+i8+i9)(1+i) का मान है
View Solution∣∣ ∣ ∣∣−a2abacab−b2bcacbc−c2∣∣ ∣ ∣∣ किसके बराबर है ?
View SolutionHow many lines of symmetry does the above figure have ?
View SolutionWhich of the following are correct chain isomers of butane ? (i)
View SolutionDetermine the point of symmetry of a regular hexagon.
View SolutionDtermine the images of the following figure about the given line :
View SolutionMatch the following Column A to Column B

View SolutionMatch the following Column A to Column B

View SolutionMatch the following Column A to Column B

View SolutionFind the area of the figure given below.

View SolutionThe area of the shaded part in the figure given below is ______.

View SolutionThe inequation represented by the graph given below is :
View SolutionThe inequation that best describes the graph given below is _________
View SolutionThe inequation that best describes the following graph is _________
View Solution
