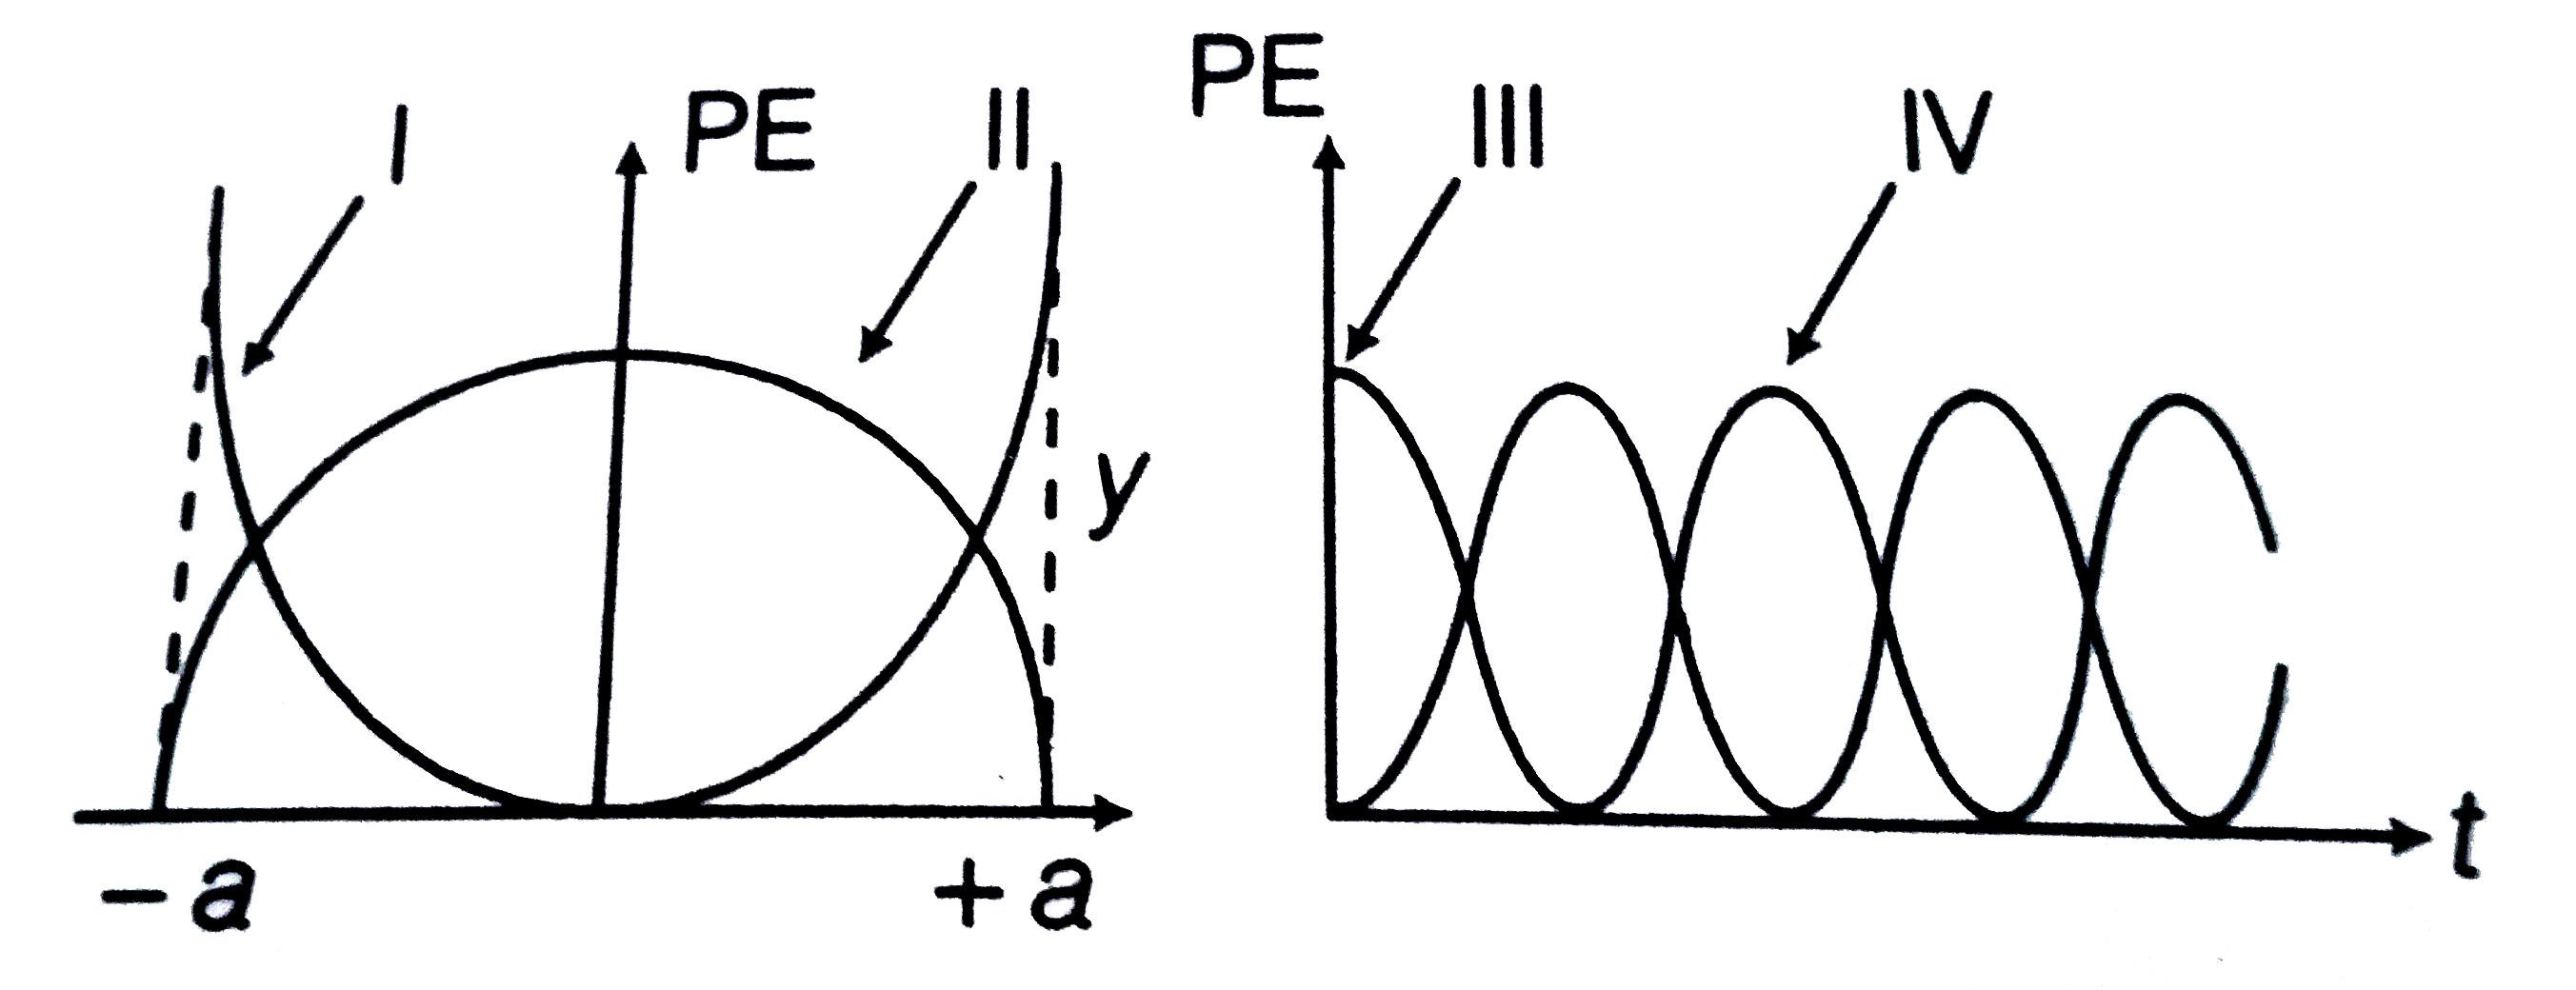
If for a particle executing SHM, the equation of SHM is given as y=acosωt. Then which of the following graphs represents the variation in potential energy?

II,IV
I,III
III,IV
I,II
The correct Answer is:B
The potential energy is maximum at extreme position (where y=±a) and zero at mean position, so, graph I is correct.
Also, from y=acosωt
y=±a at time t=0
hence, raph III is also correct.
Topper's Solved these Questions
Similar Questions
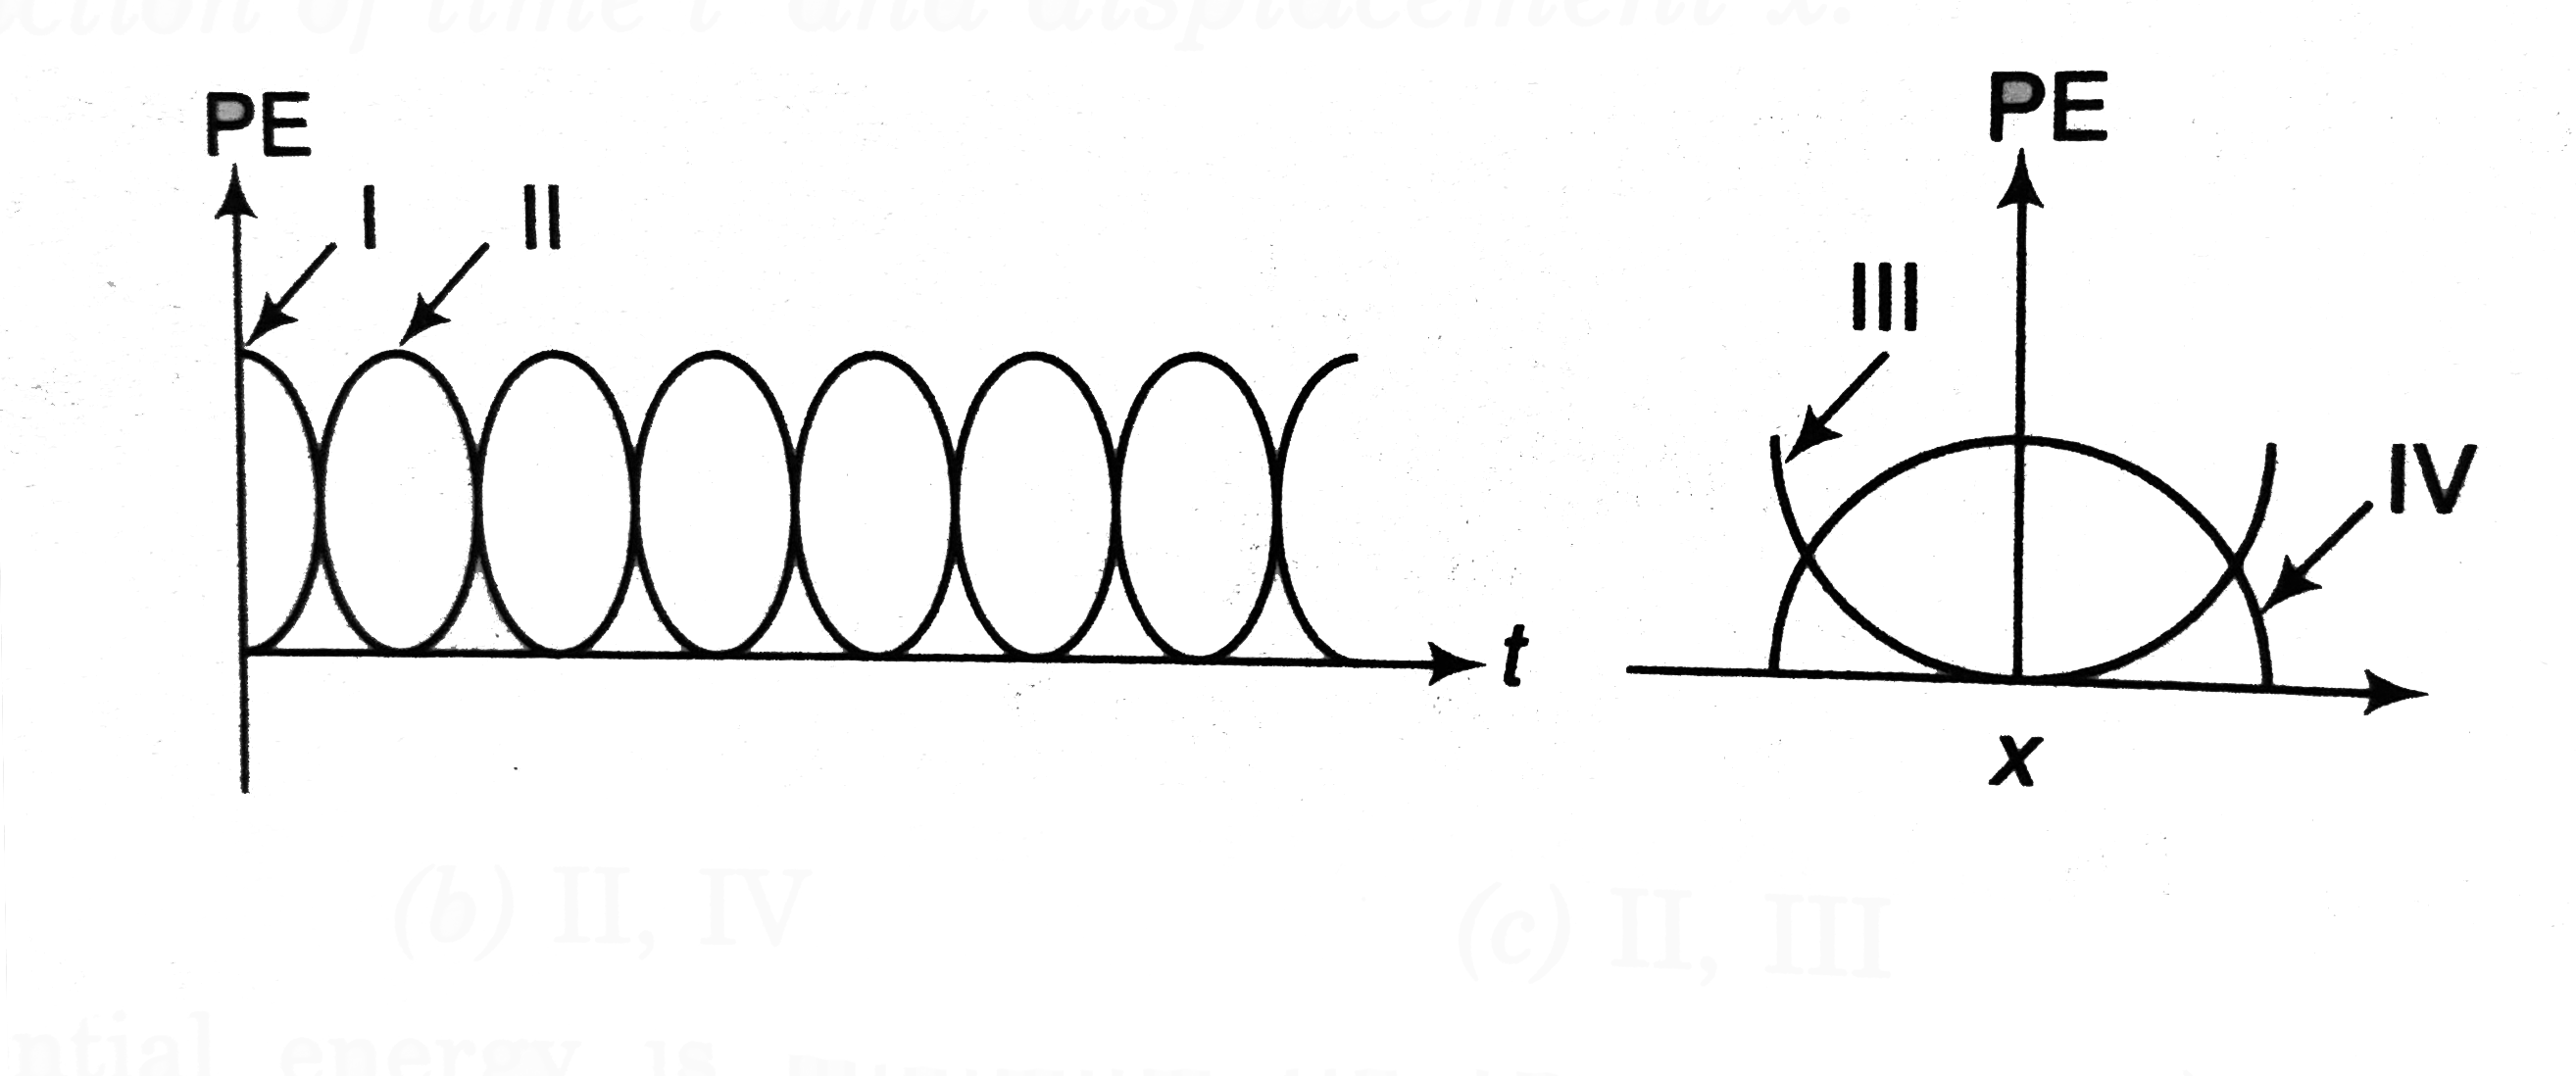
For a particle executing SHM, the displacement x is given by x=Acosωt. Identify the graph which represents the variation of potential energy (PE) as a function of time t and displacement x.

(a) I,III
(b) II,IV (c ) II,III
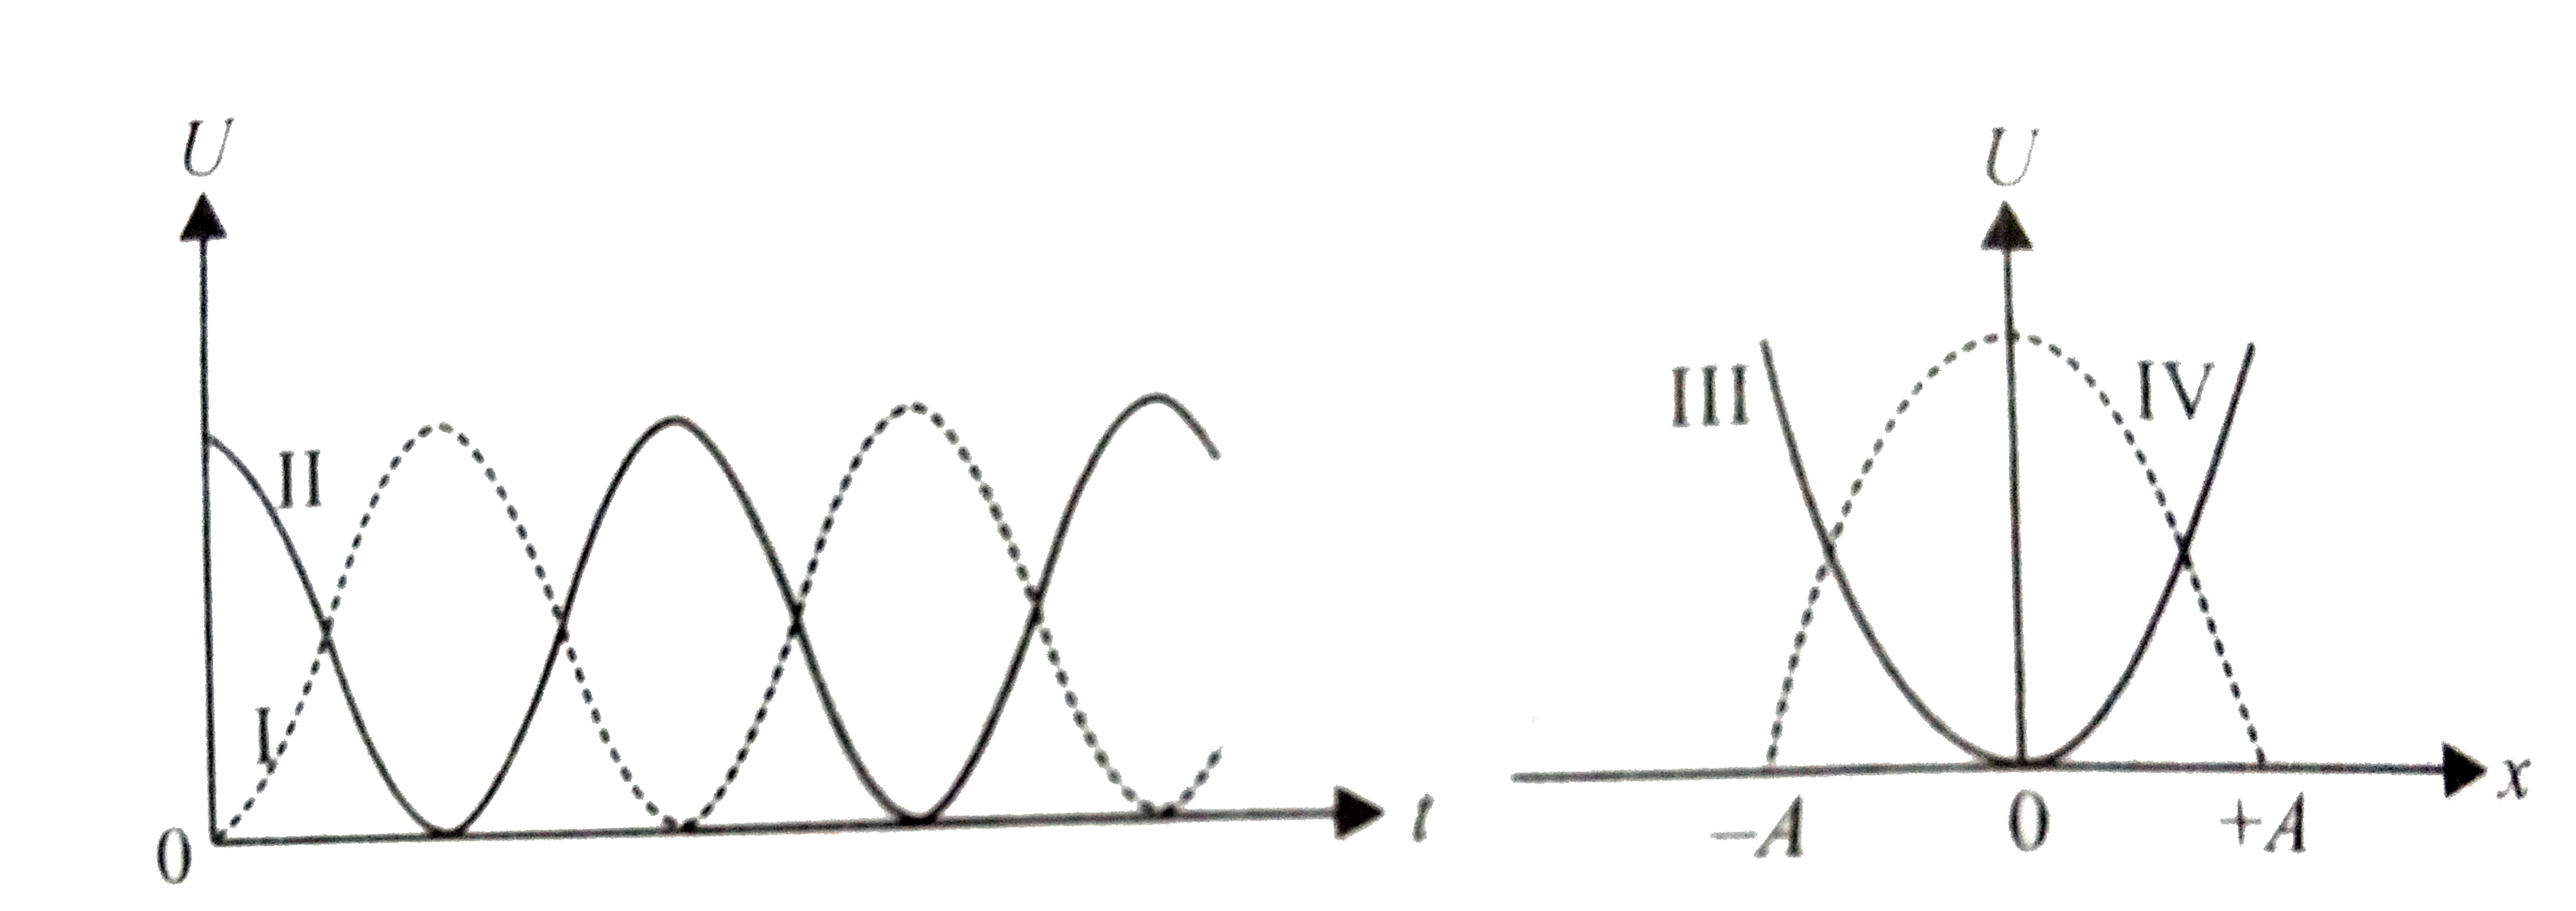
(d) I,IVView SolutionFor a particle executing simple harmonic motion, the displacement x is given by x=Acosωt. Identify the graph, which represents the variation of potential energy (U) as a function of time t and displacement x.
 View Solution
Knowledge Check
- Question 1 - Select One
Which of the following represents a SHM?
Asinωt−cosωtBsinωt+cosωtCsinωt+2cosωtDAll of these - Question 2 - Select One
For a particle executing S.H.M. the displacement x is given by x=Acosωt . Identify the graph which represents the variation of potential energy (P.E.) as a function of time
 AI,IIIBII, IVCII, IIIDI,IV
 - Question 3 - Select One
Which of the following equations represent S.H.M. ?
Ay=2sin(ωt+30∘)By=2cos(ωt−30∘)Cy=2sinωt+3cosωtDy=2sinωt.cosωt
Energy of particle executing SHM depends upon
View SolutionFor a particle executing SHM, the kinetic energy (K) is given by K=K0cos2ωt. The equation for its displacement is
View SolutionFor a particle executing S.H.M., the kinetic energy K is given K=K0cos2ωt. The maximum value of potential energy is:
View SolutionAssertion : x-t equation of a particle in SHM is given as :x=Acosωt
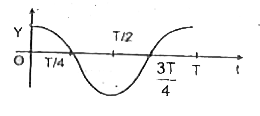
Reason : In the given equation the minimum potential energy is zero.View SolutionThe displacement time graph of a particle executing an SHM is as shown. Which of the following statements are true?
 View Solution
