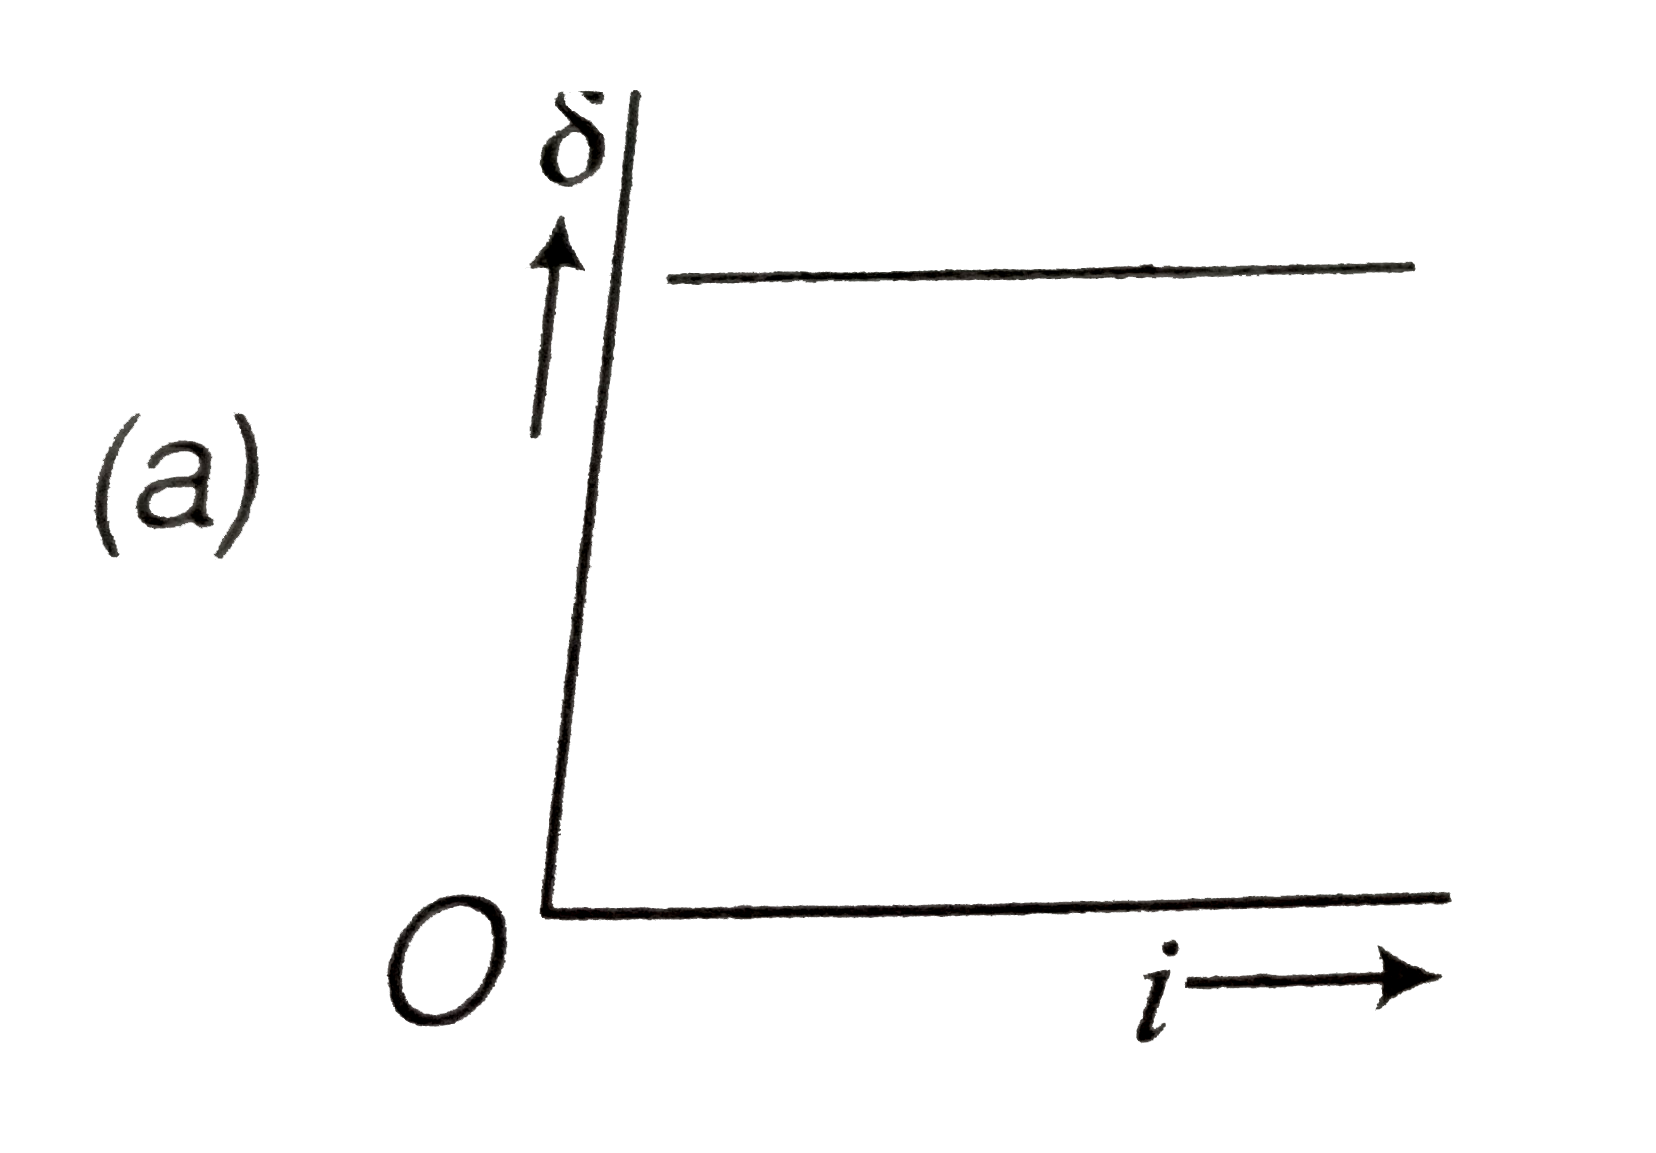
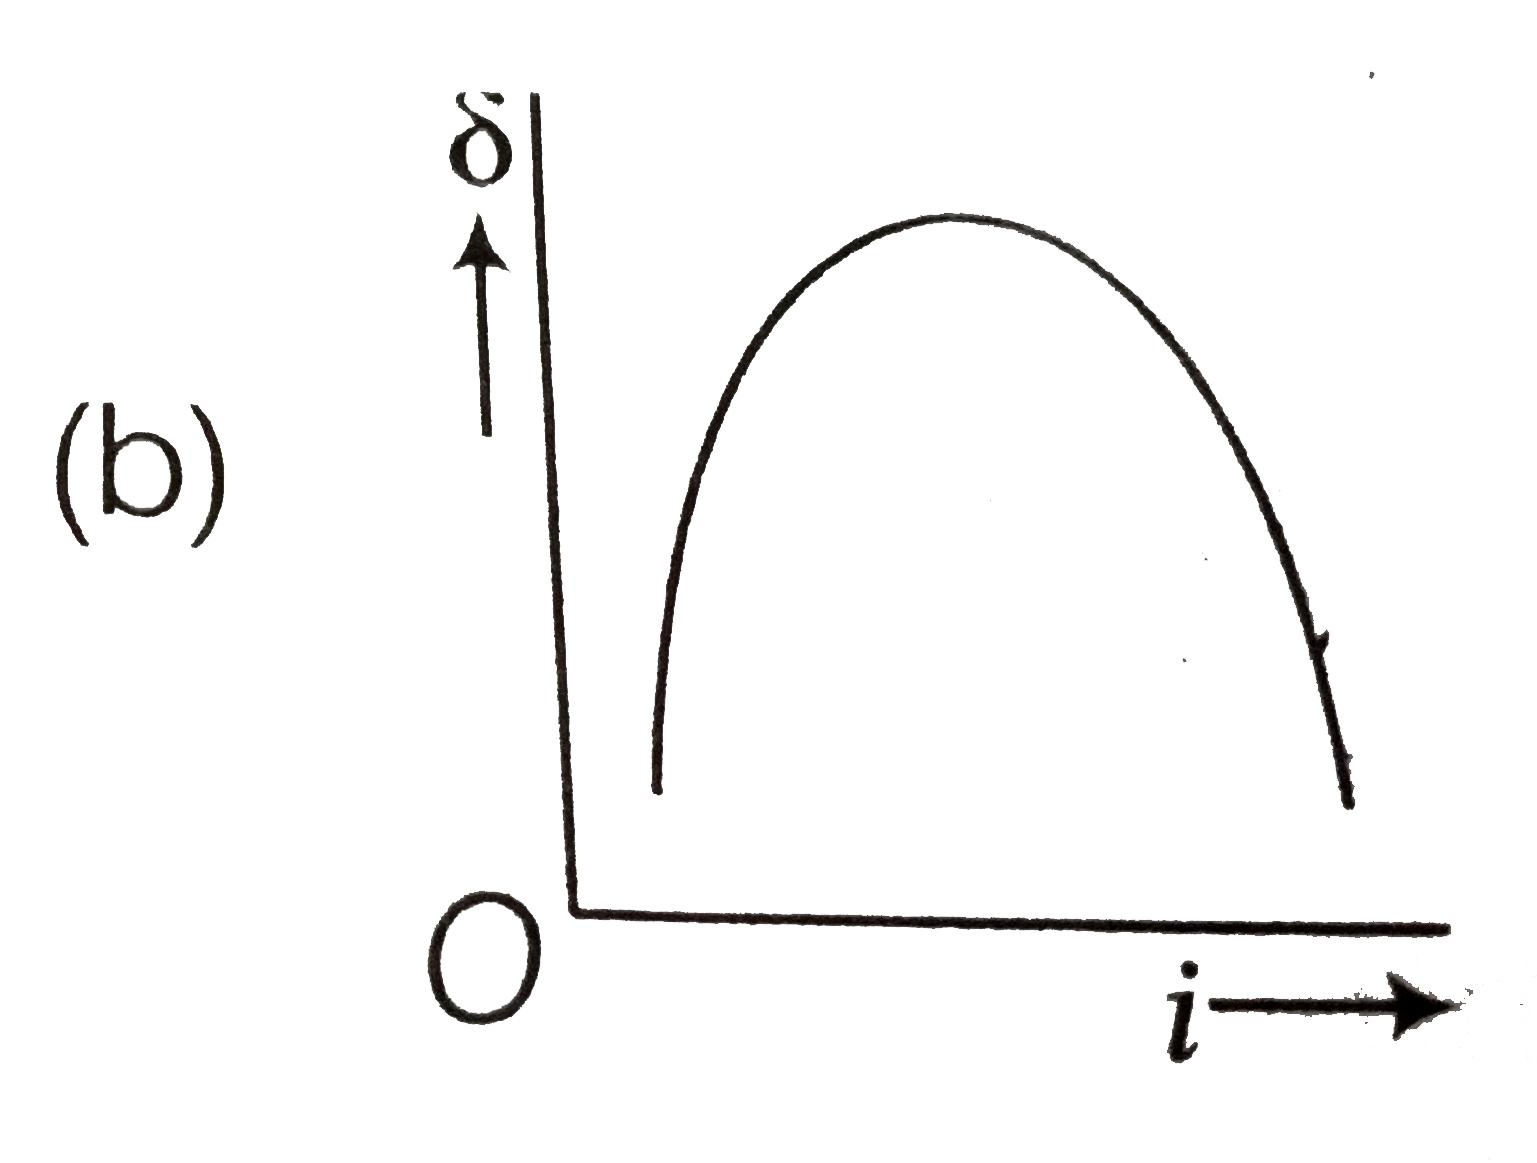
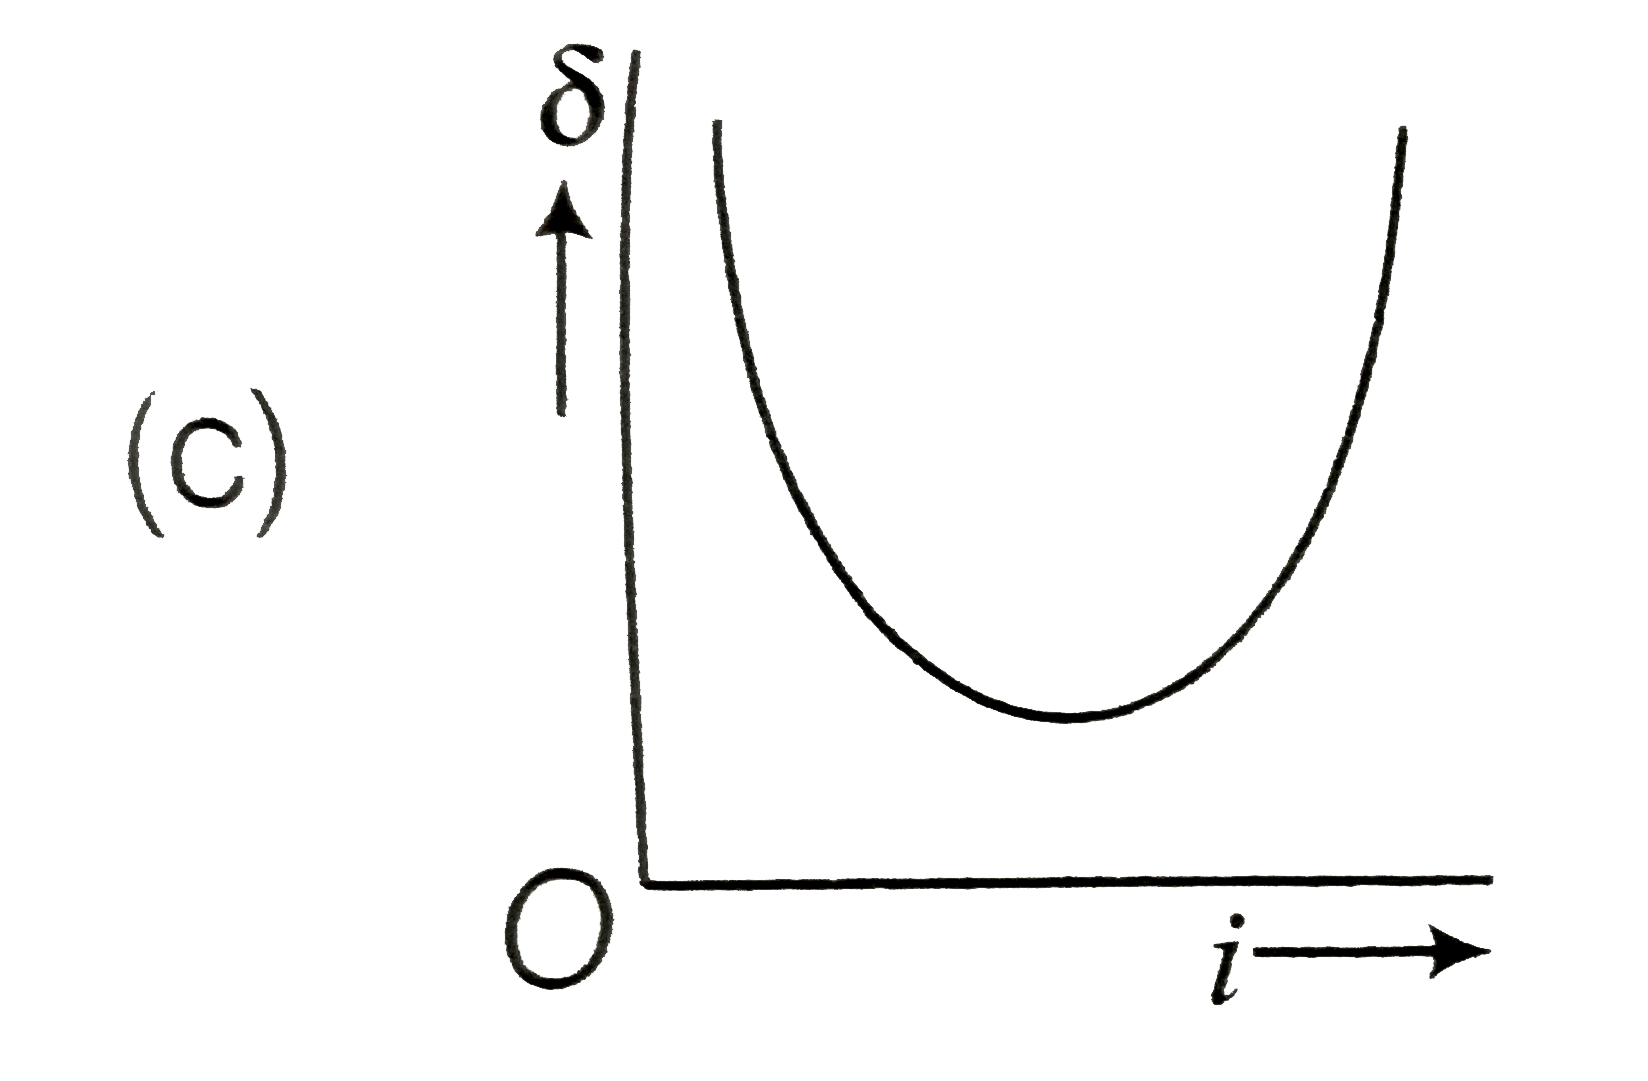
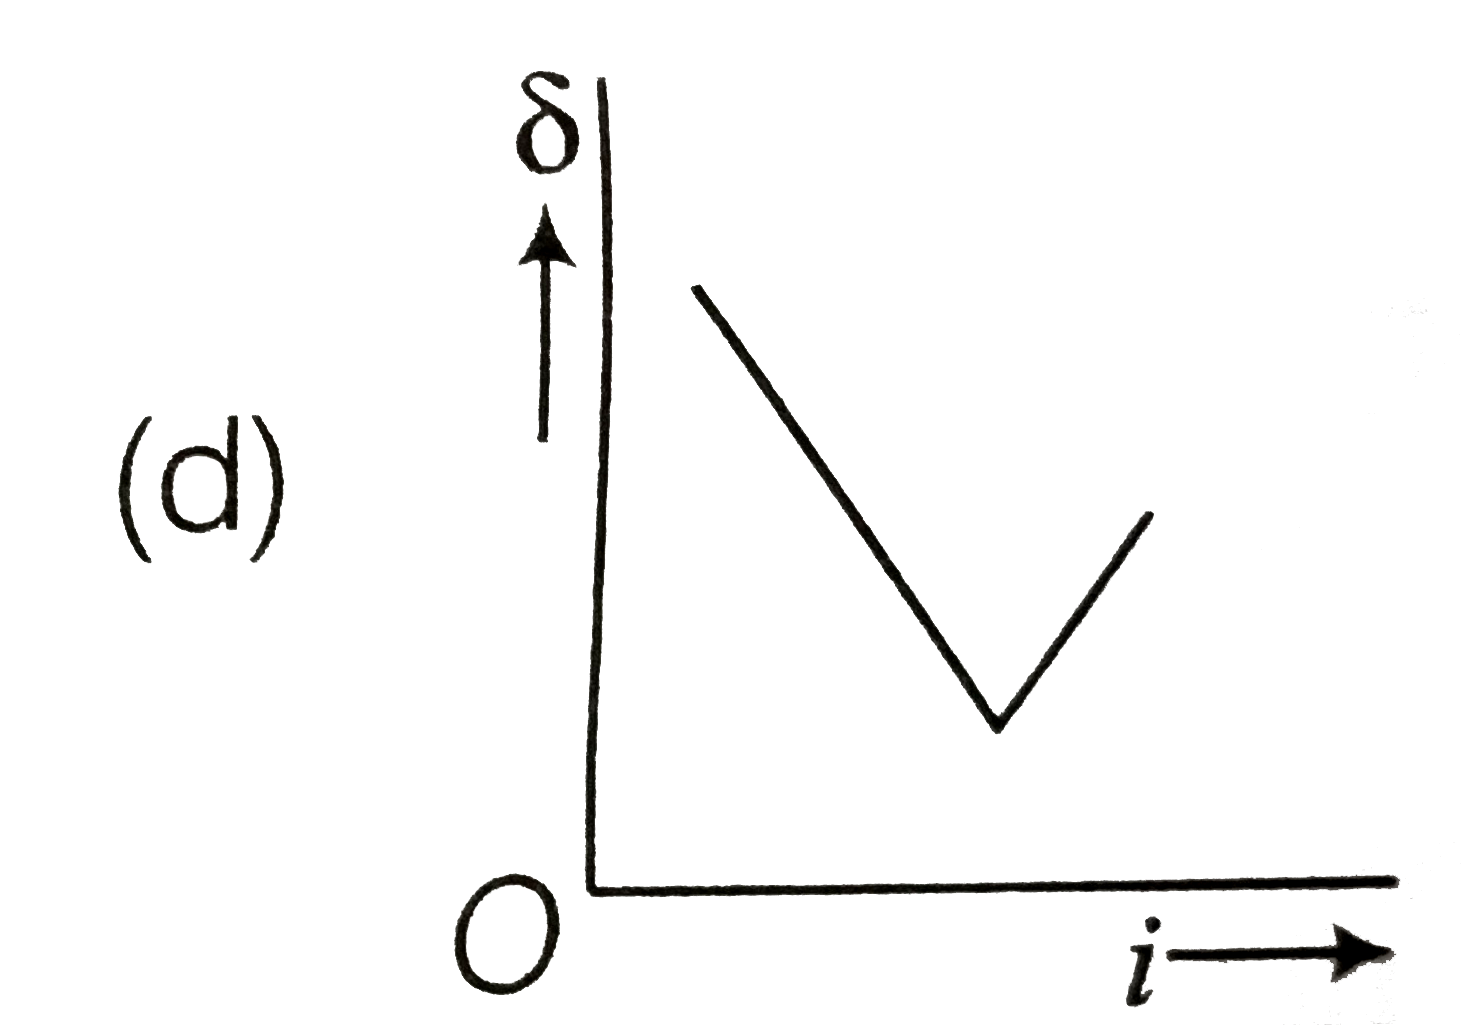
The graph between angle of deviation (δ) and angle of incidence (i) for a triangular prism is represented by
A
B
C
D
Video Solution
Text Solution
The correct Answer is:C
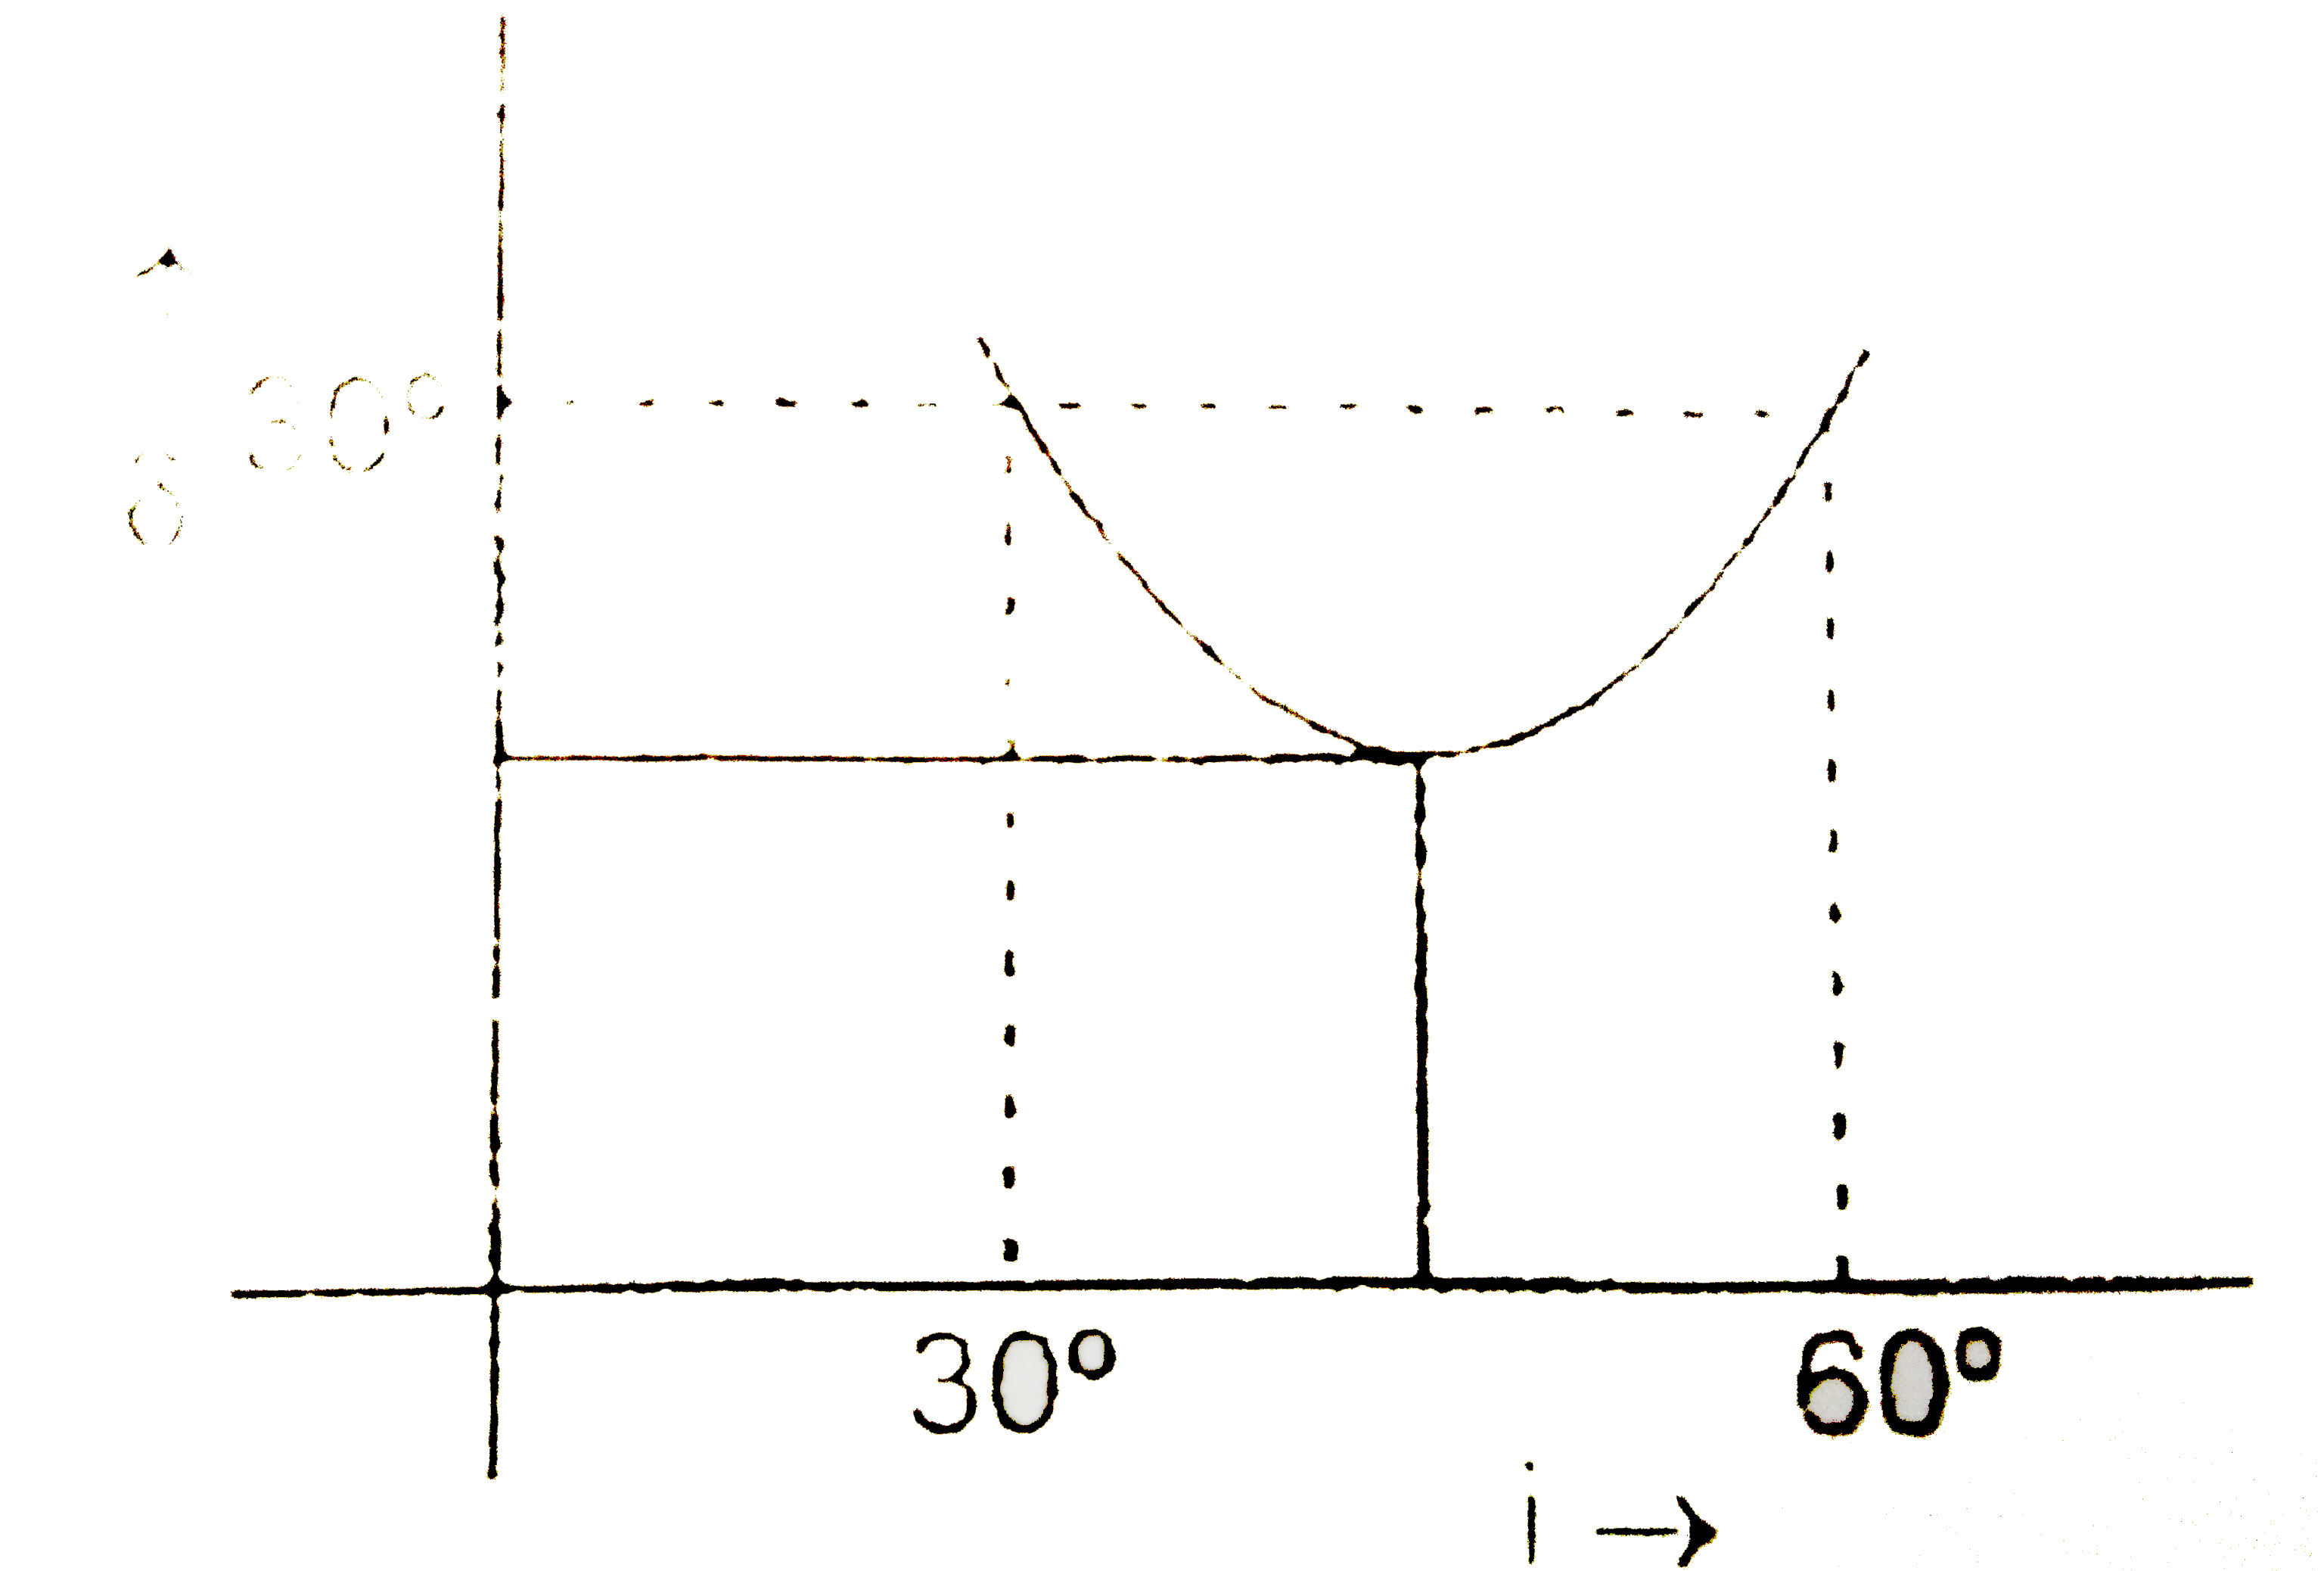
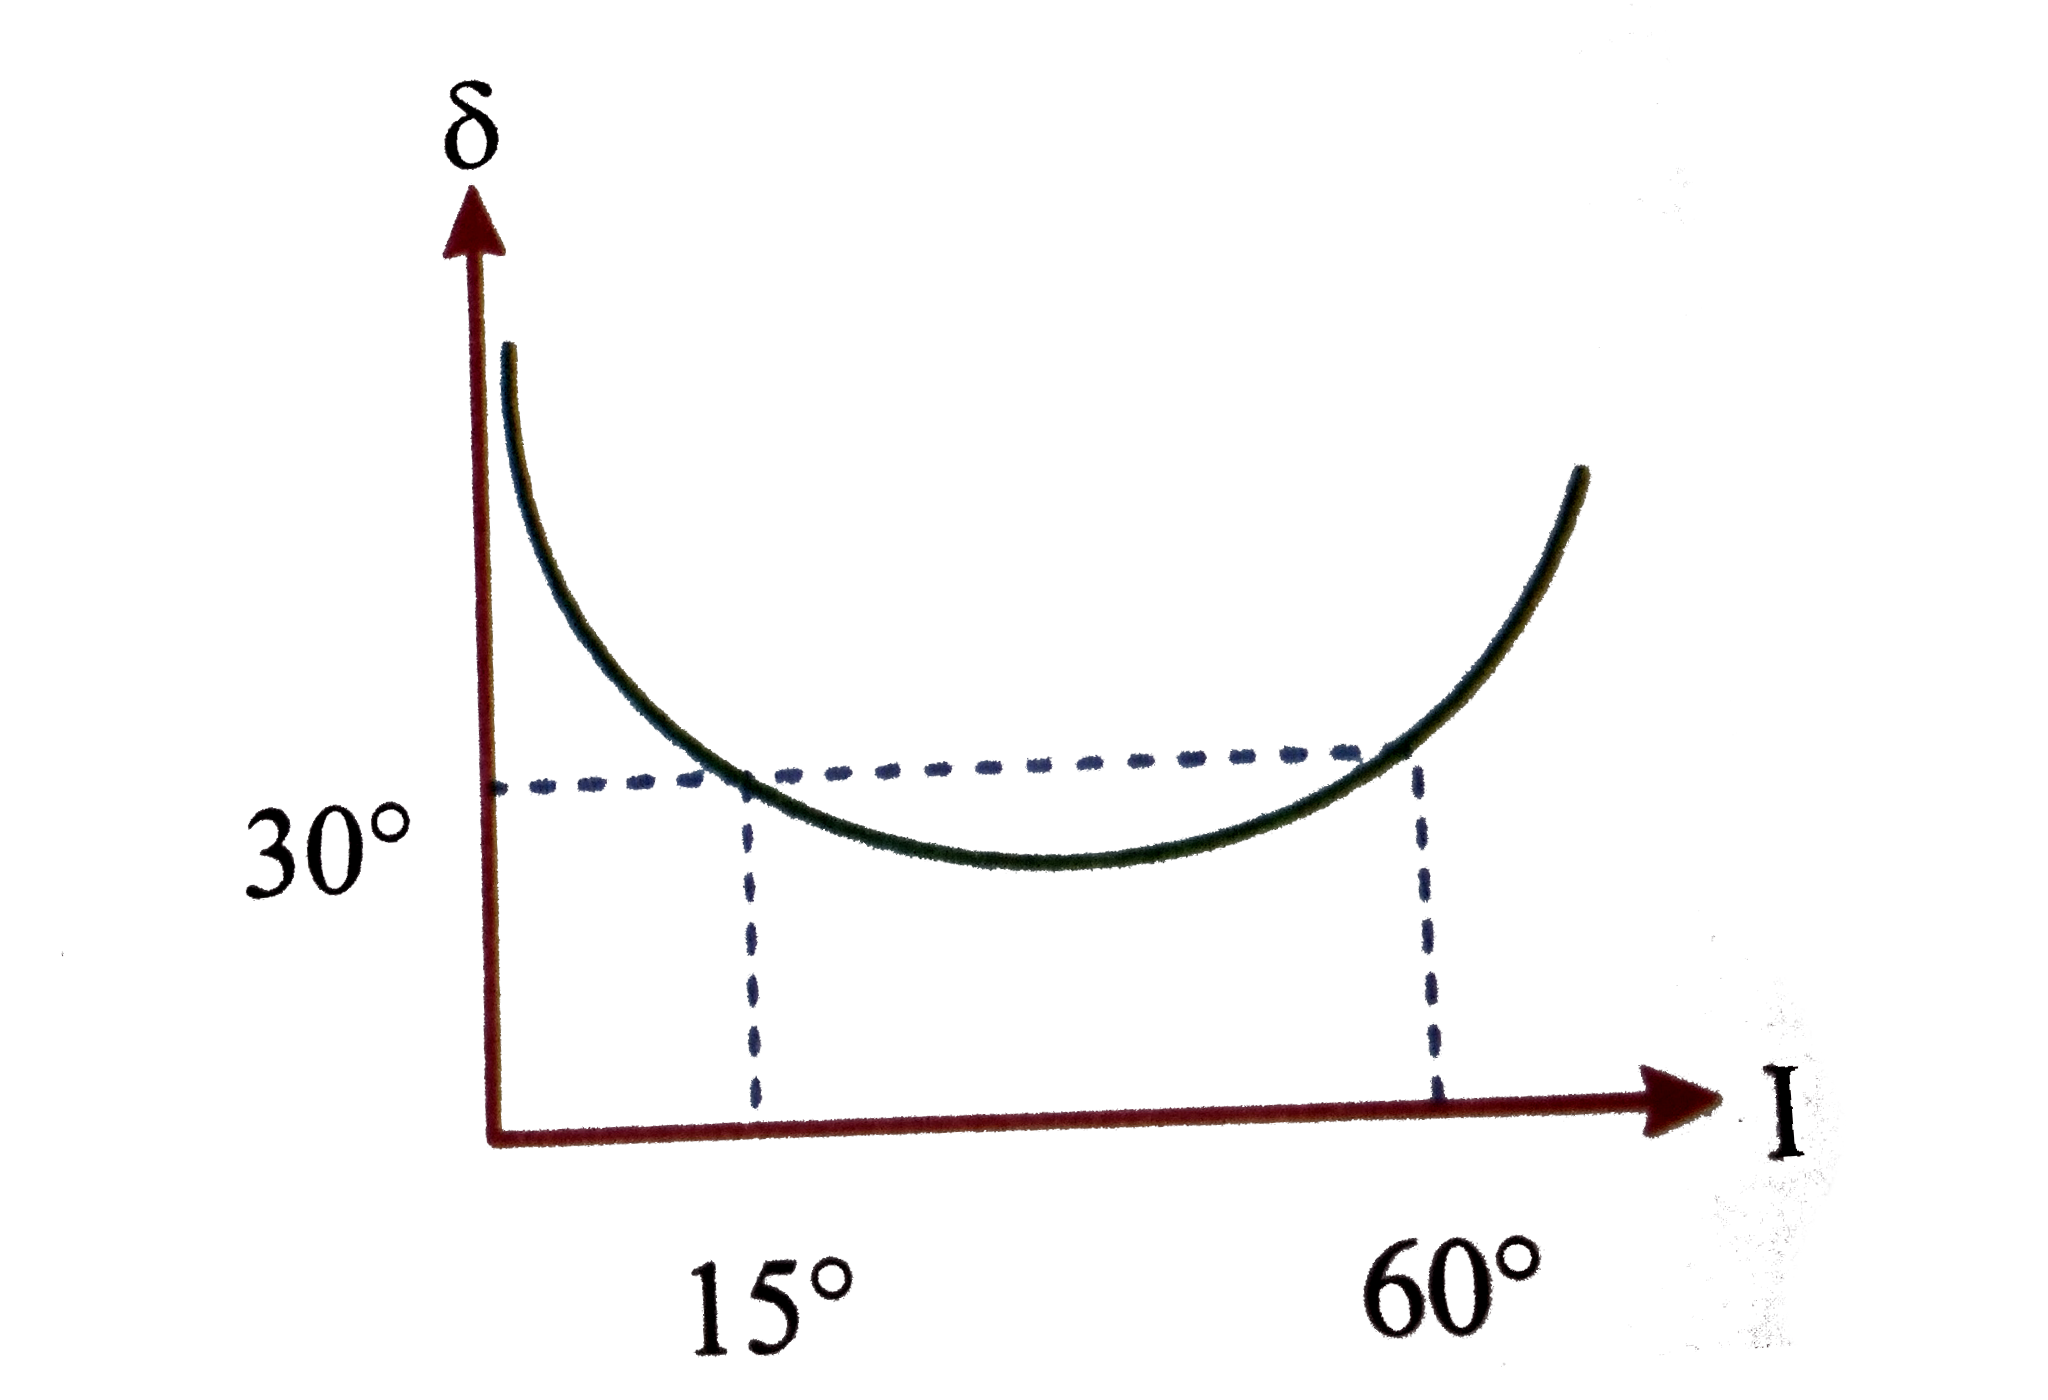
We know that the angle of deviation depends upon the angle of incidence. If we determine experimentally, the angles of deviation comparing to different angles of incidence and then plot I (on - x-axis) and δ (on y-axis) we get a curve as shown in the figure.
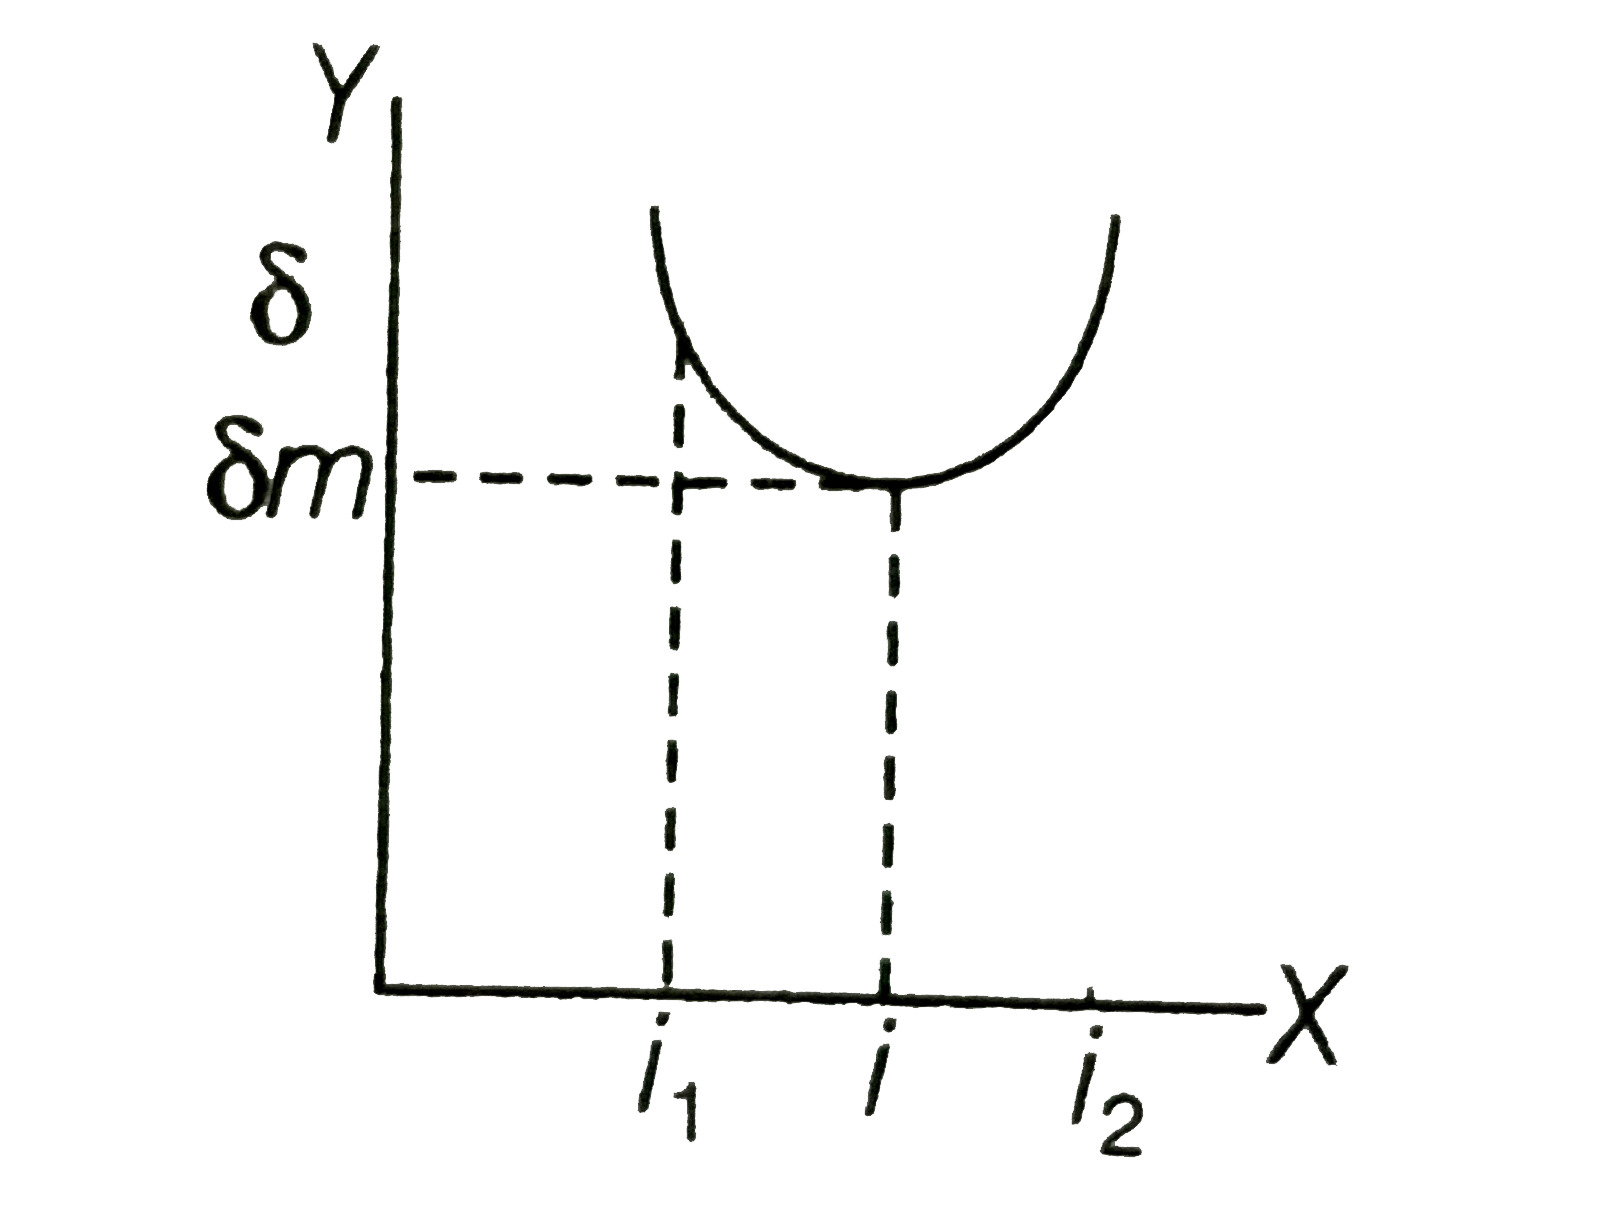
Clearly if angle of incidence is gradually increased from a small value the angle of deviation first decreases, becomes minimum for a particular angle of incidence and then begains to increase.
|
Topper's Solved these Questions
Similar Questions
Knowledge Check
The graph between angle of deviation (δ) and angle of incidence (i) for a triangular prism is represented by
A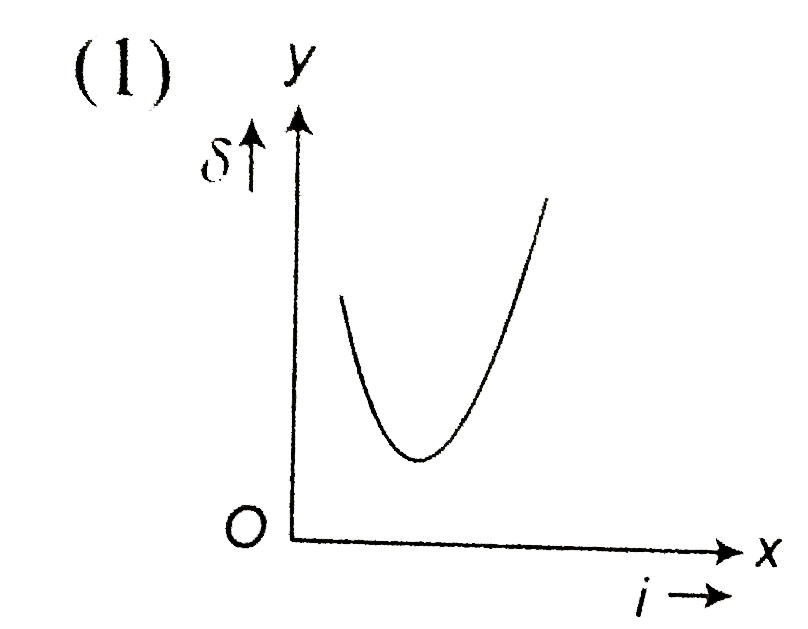 B
B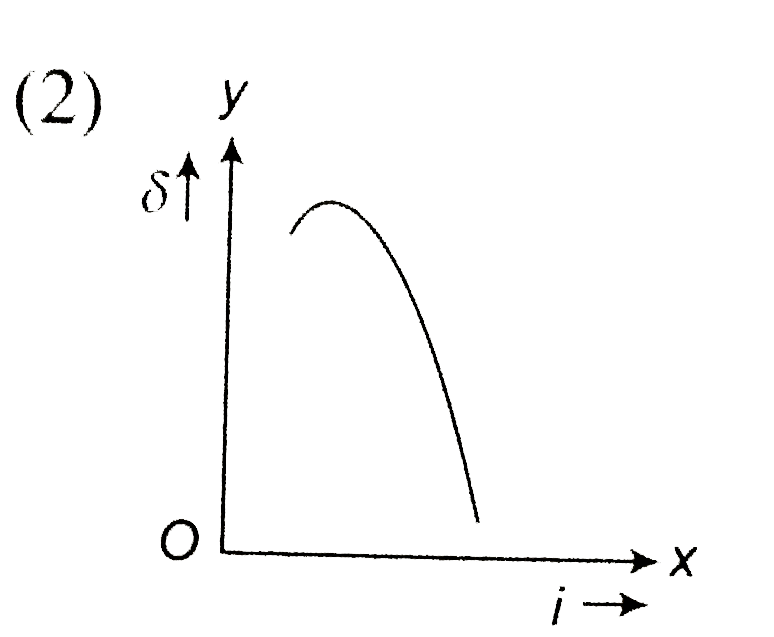 C
C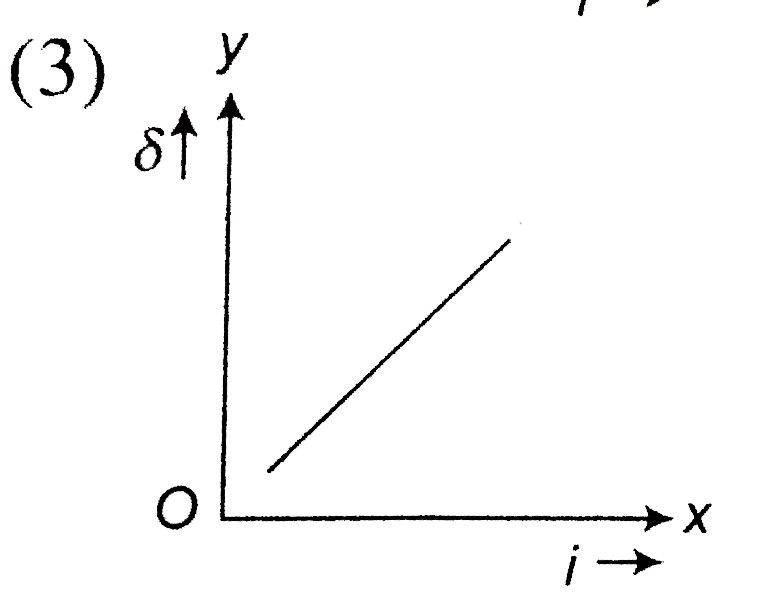 D
D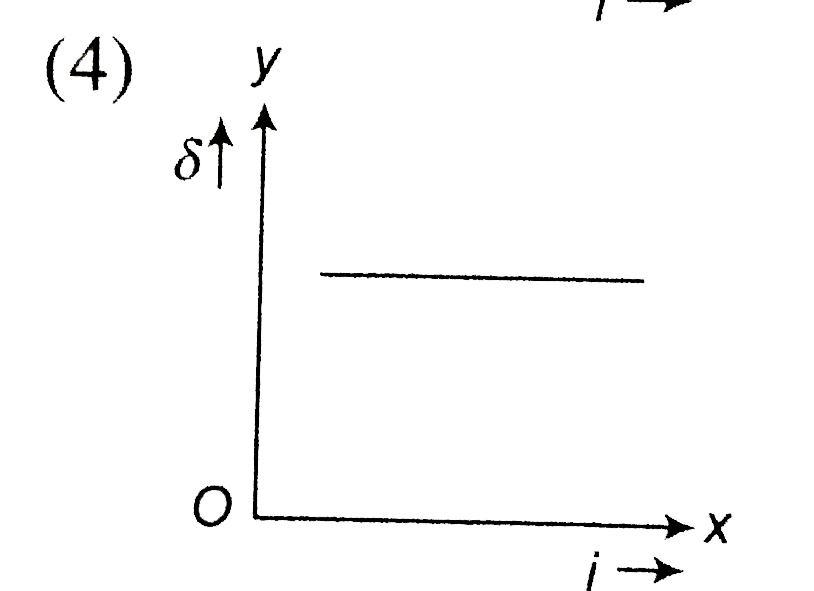
Figure shown the graph of angle of deviation δ verses angle of incidence I for a light ray striking a prism. The prism angle is
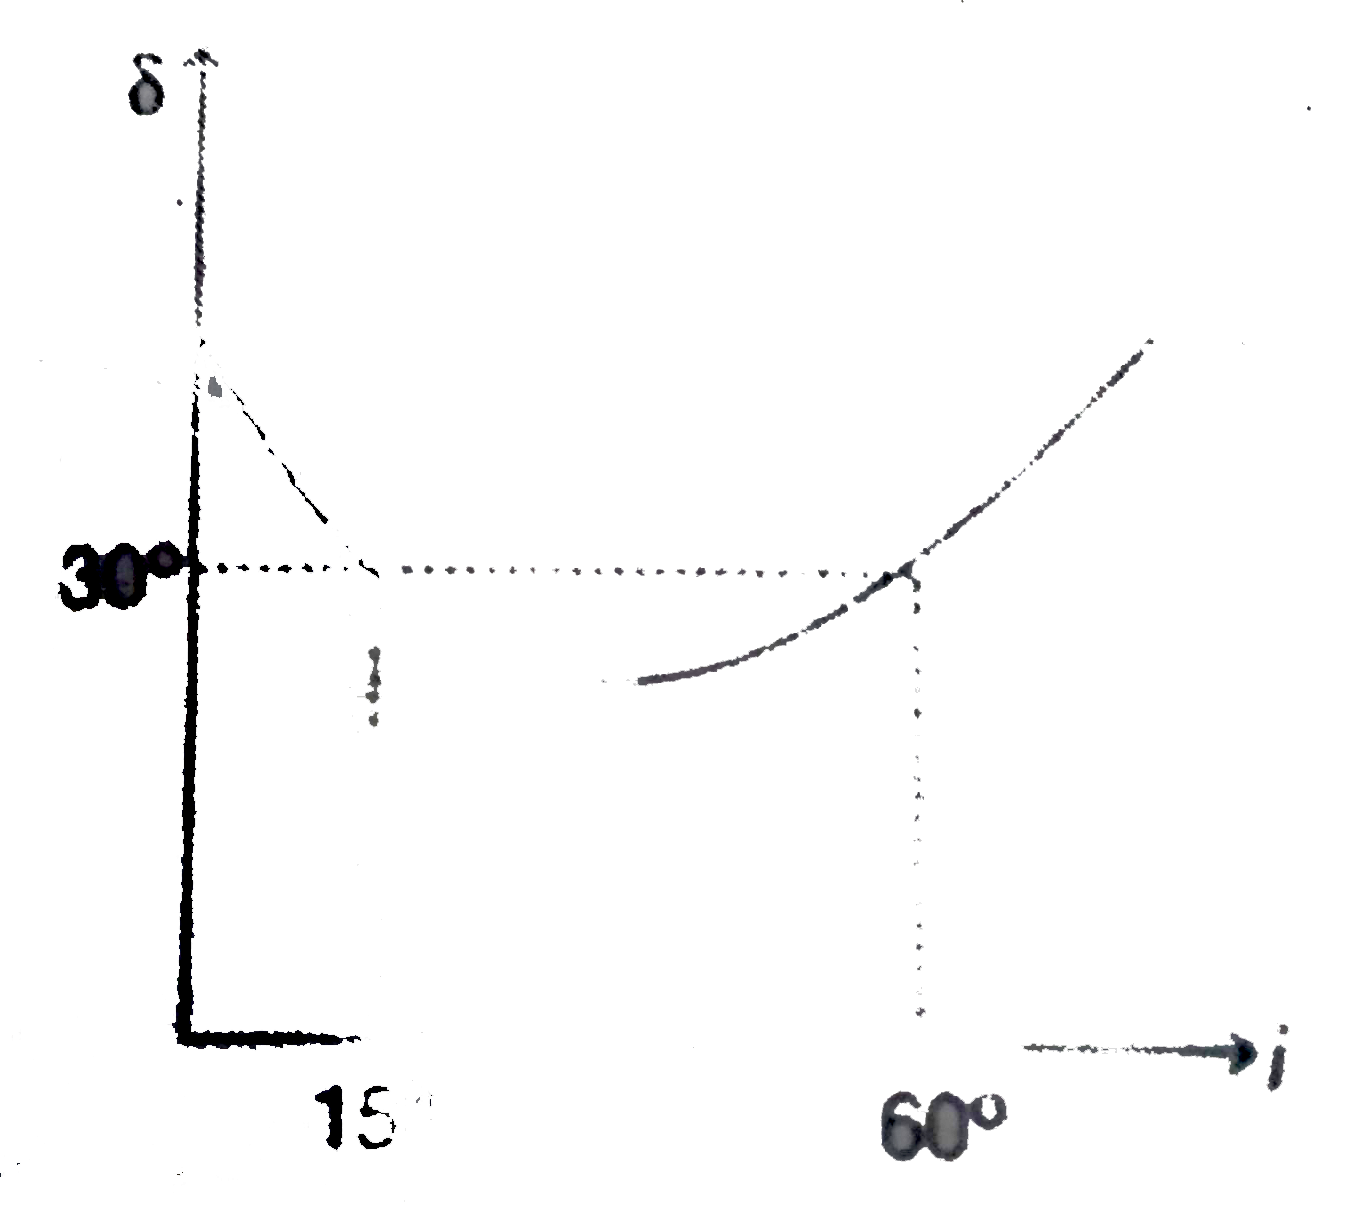 A30∘B45∘C60∘D75∘
Figure shows the graph of angle of deviation ∂ versus angle of incidence i for a light ray striking a prism. The prism angle is
 A30∘B45∘C60∘D75∘
Write the relationship between angle of incidence 'i', angle of prism 'A' and angle of minimum deviation for a triangular prism.
View SolutionExplain the relation between angle of incidence and deviation for a prism
View SolutionThe expected graphical representation of the variation of angle of deviation 'δ' with angle of incidence 'i' in a prism is :
View SolutionThe relation between angle of incidence i, angle of prism A and angle of minimum deviation for a triangular prism is.
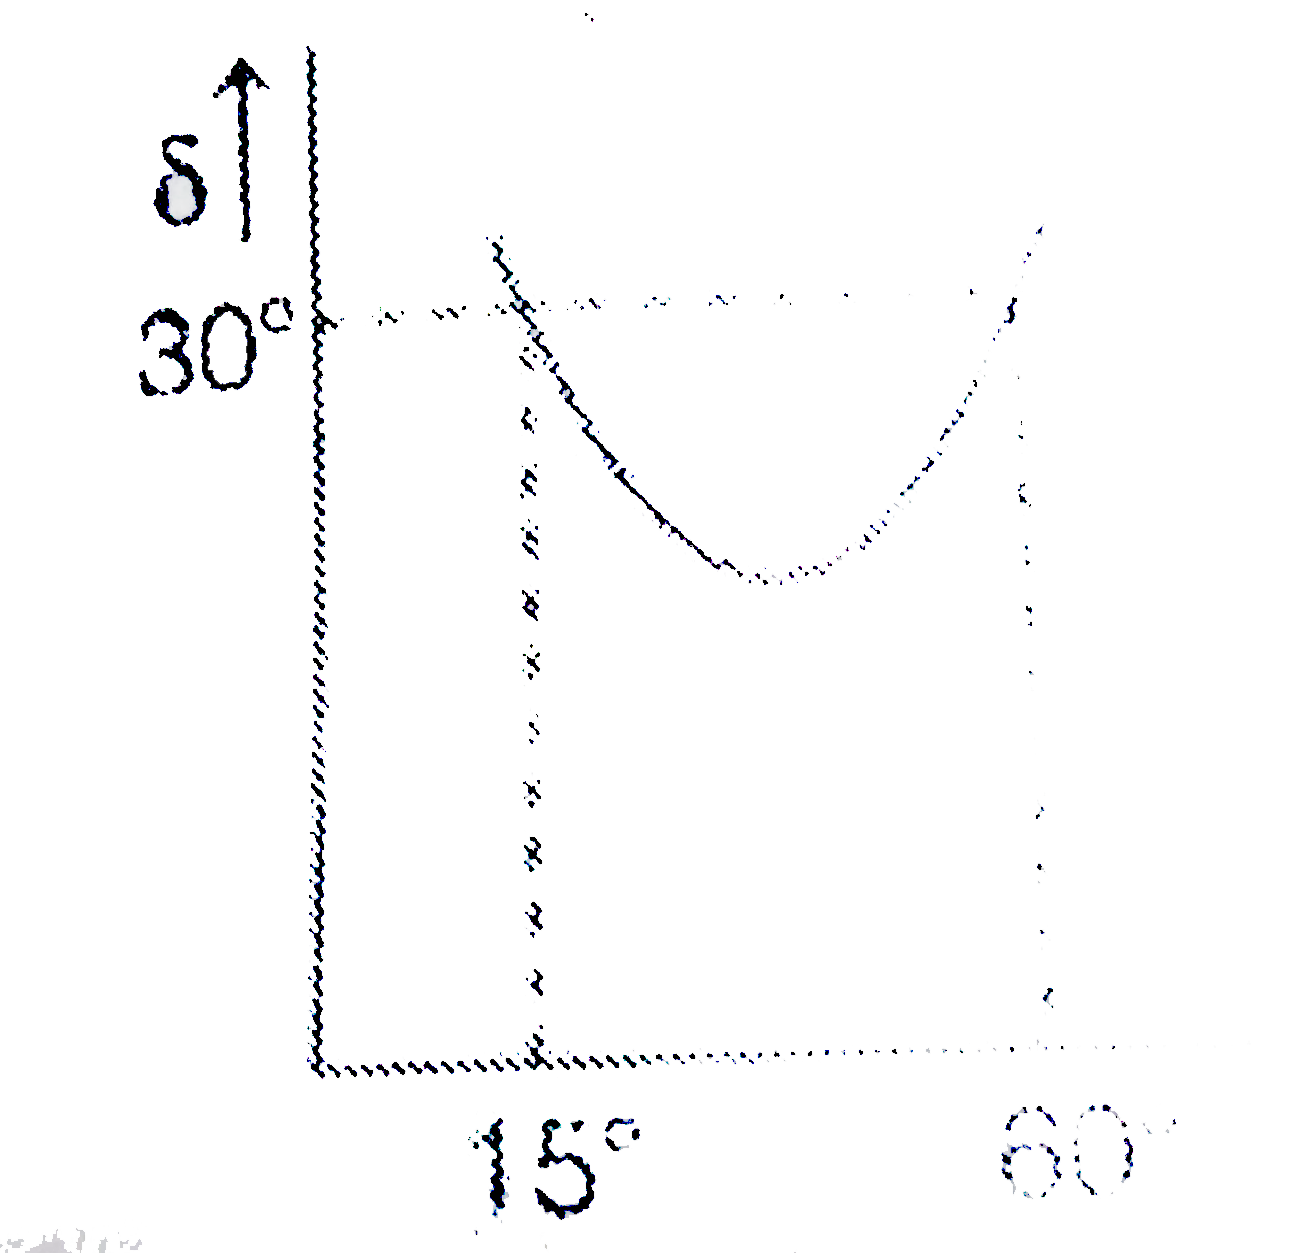
View SolutionFigure shows graph of deviation δ versus angle of incidence for a light ray striking a prism. Angle of prism is
View Solution
