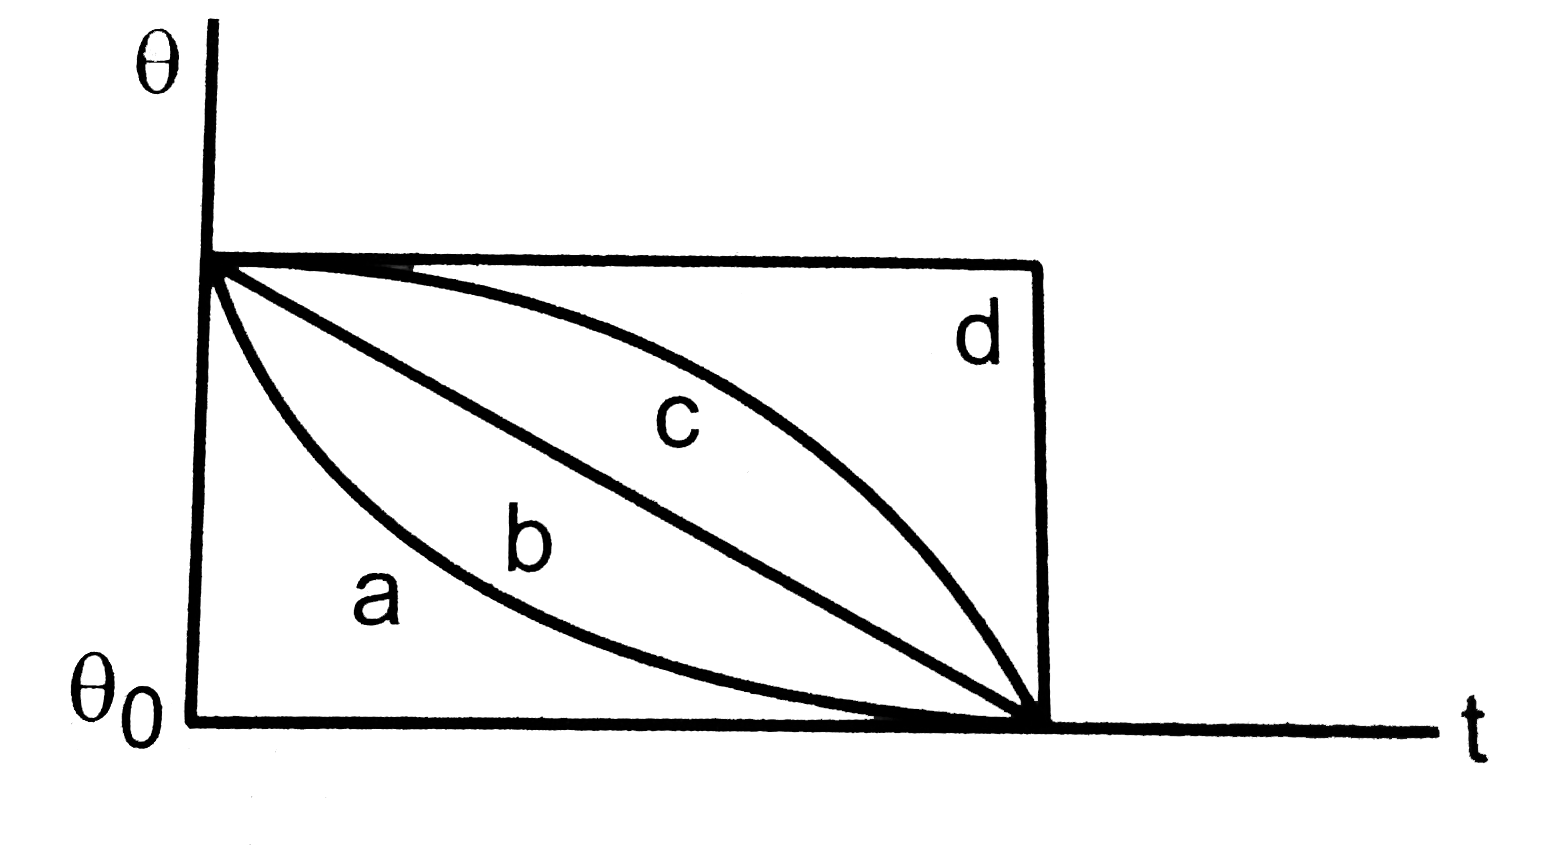
A hot liquid is kept in a big room. Its temperature is plotted as a function of time. Which of the following curves may represent the plot?
Video Solution
Text Solution
The correct Answer is:A
|
Updated on:21/07/2023
Topper's Solved these Questions
- BOOK - HC VERMACHAPTER - HEAT TRANSFEREXERCISE - Objective 26videos
HEAT TRANSFER
- BOOK - HC VERMACHAPTER - HEAT TRANSFEREXERCISE - Exercises54videos
HEAT TRANSFER
- BOOK - HC VERMACHAPTER - HEAT TRANSFEREXERCISE - Short Answer11videos
HEAT TRANSFER
- BOOK - HC VERMACHAPTER - HEAT AND TEMPERATUREEXERCISE - Exercise4videos
HEAT AND TEMPERATURE
- BOOK - HC VERMACHAPTER - INTRODUCTION TO PHYSICSEXERCISE - Exercises19videos
INTRODUCTION TO PHYSICS
Similar Questions
Knowledge Check
- Question 1 - Select One
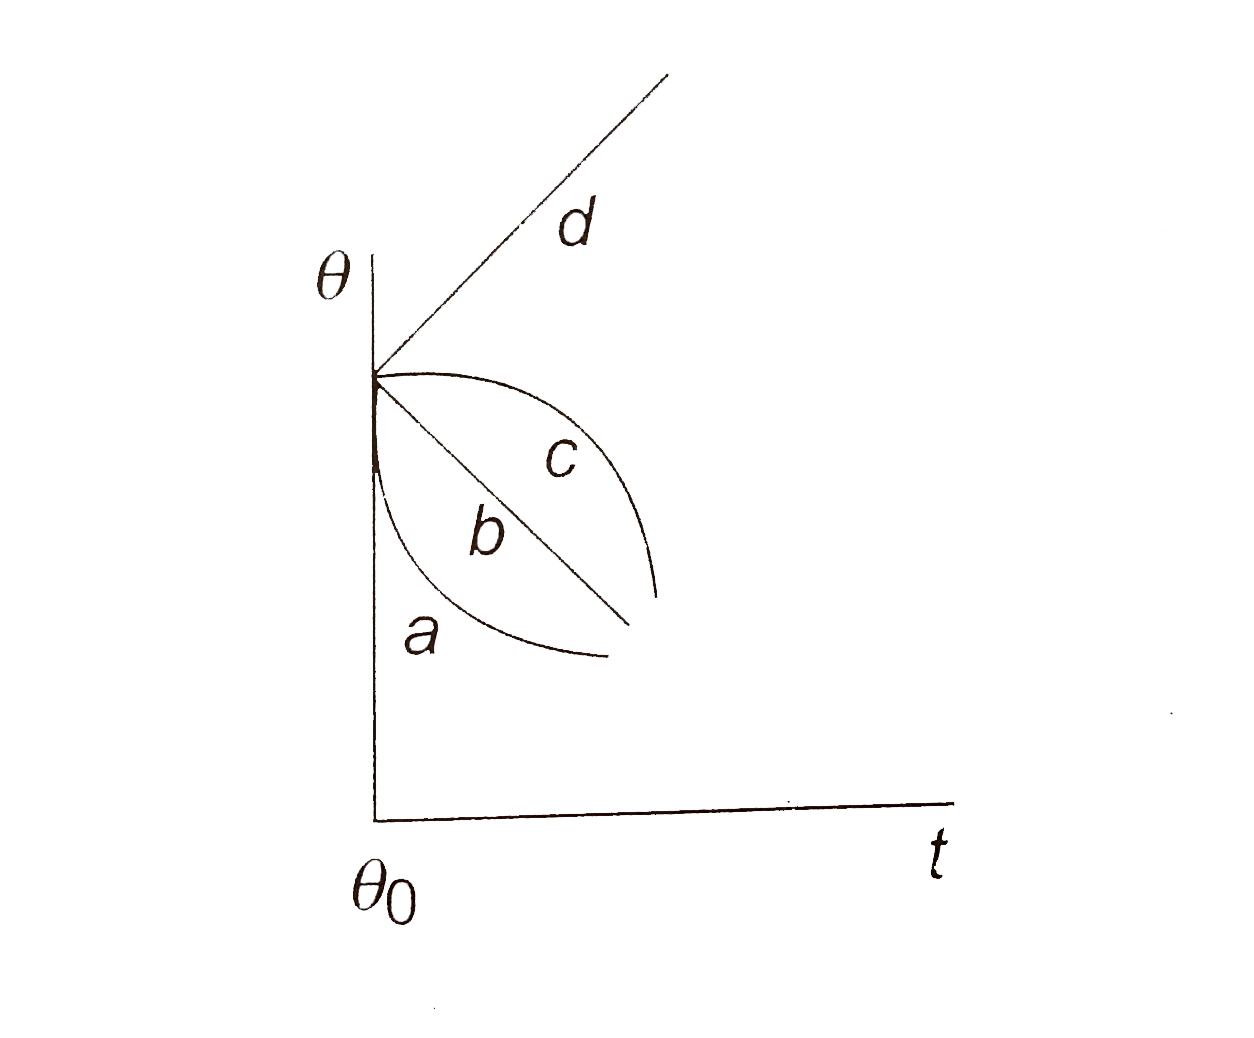
A hot liquid is kept in a big room. Its temperature is plotted as a function of time. Which of the following curves may present the plot ?
 AaBbCcDd
 - Question 2 - Select One
Which of the following plots does not represent Boyle's law?
A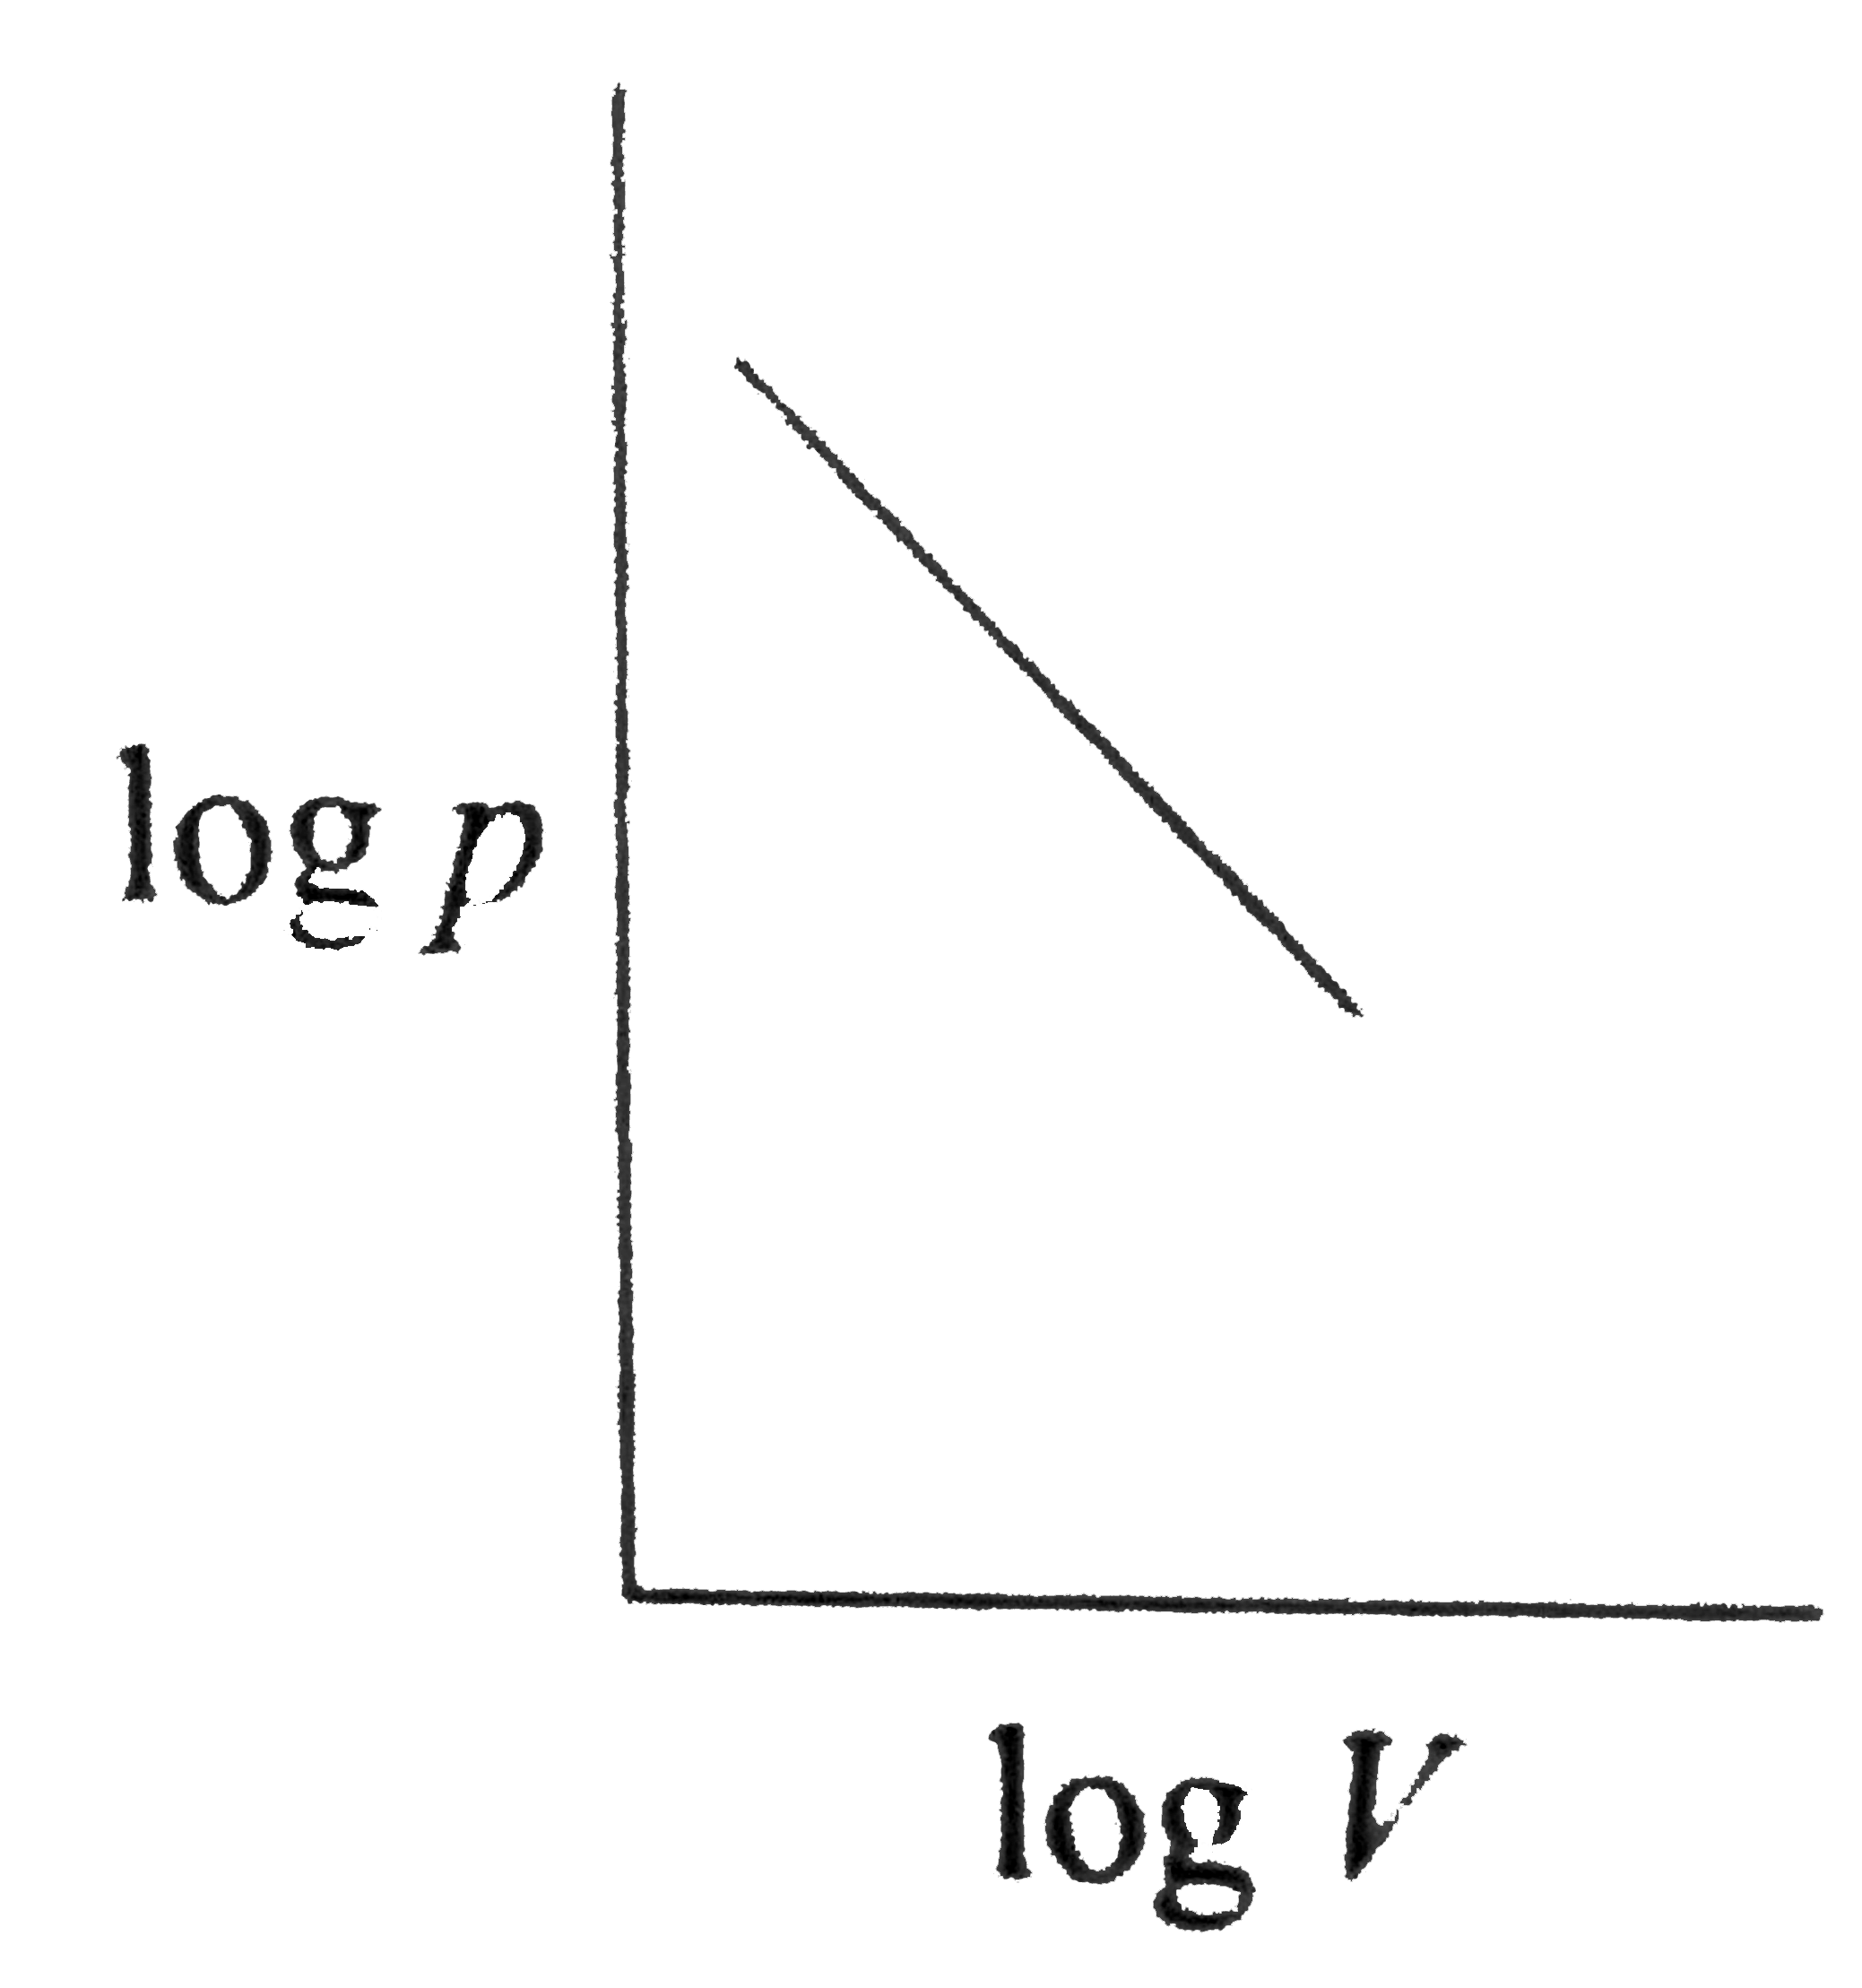 B
B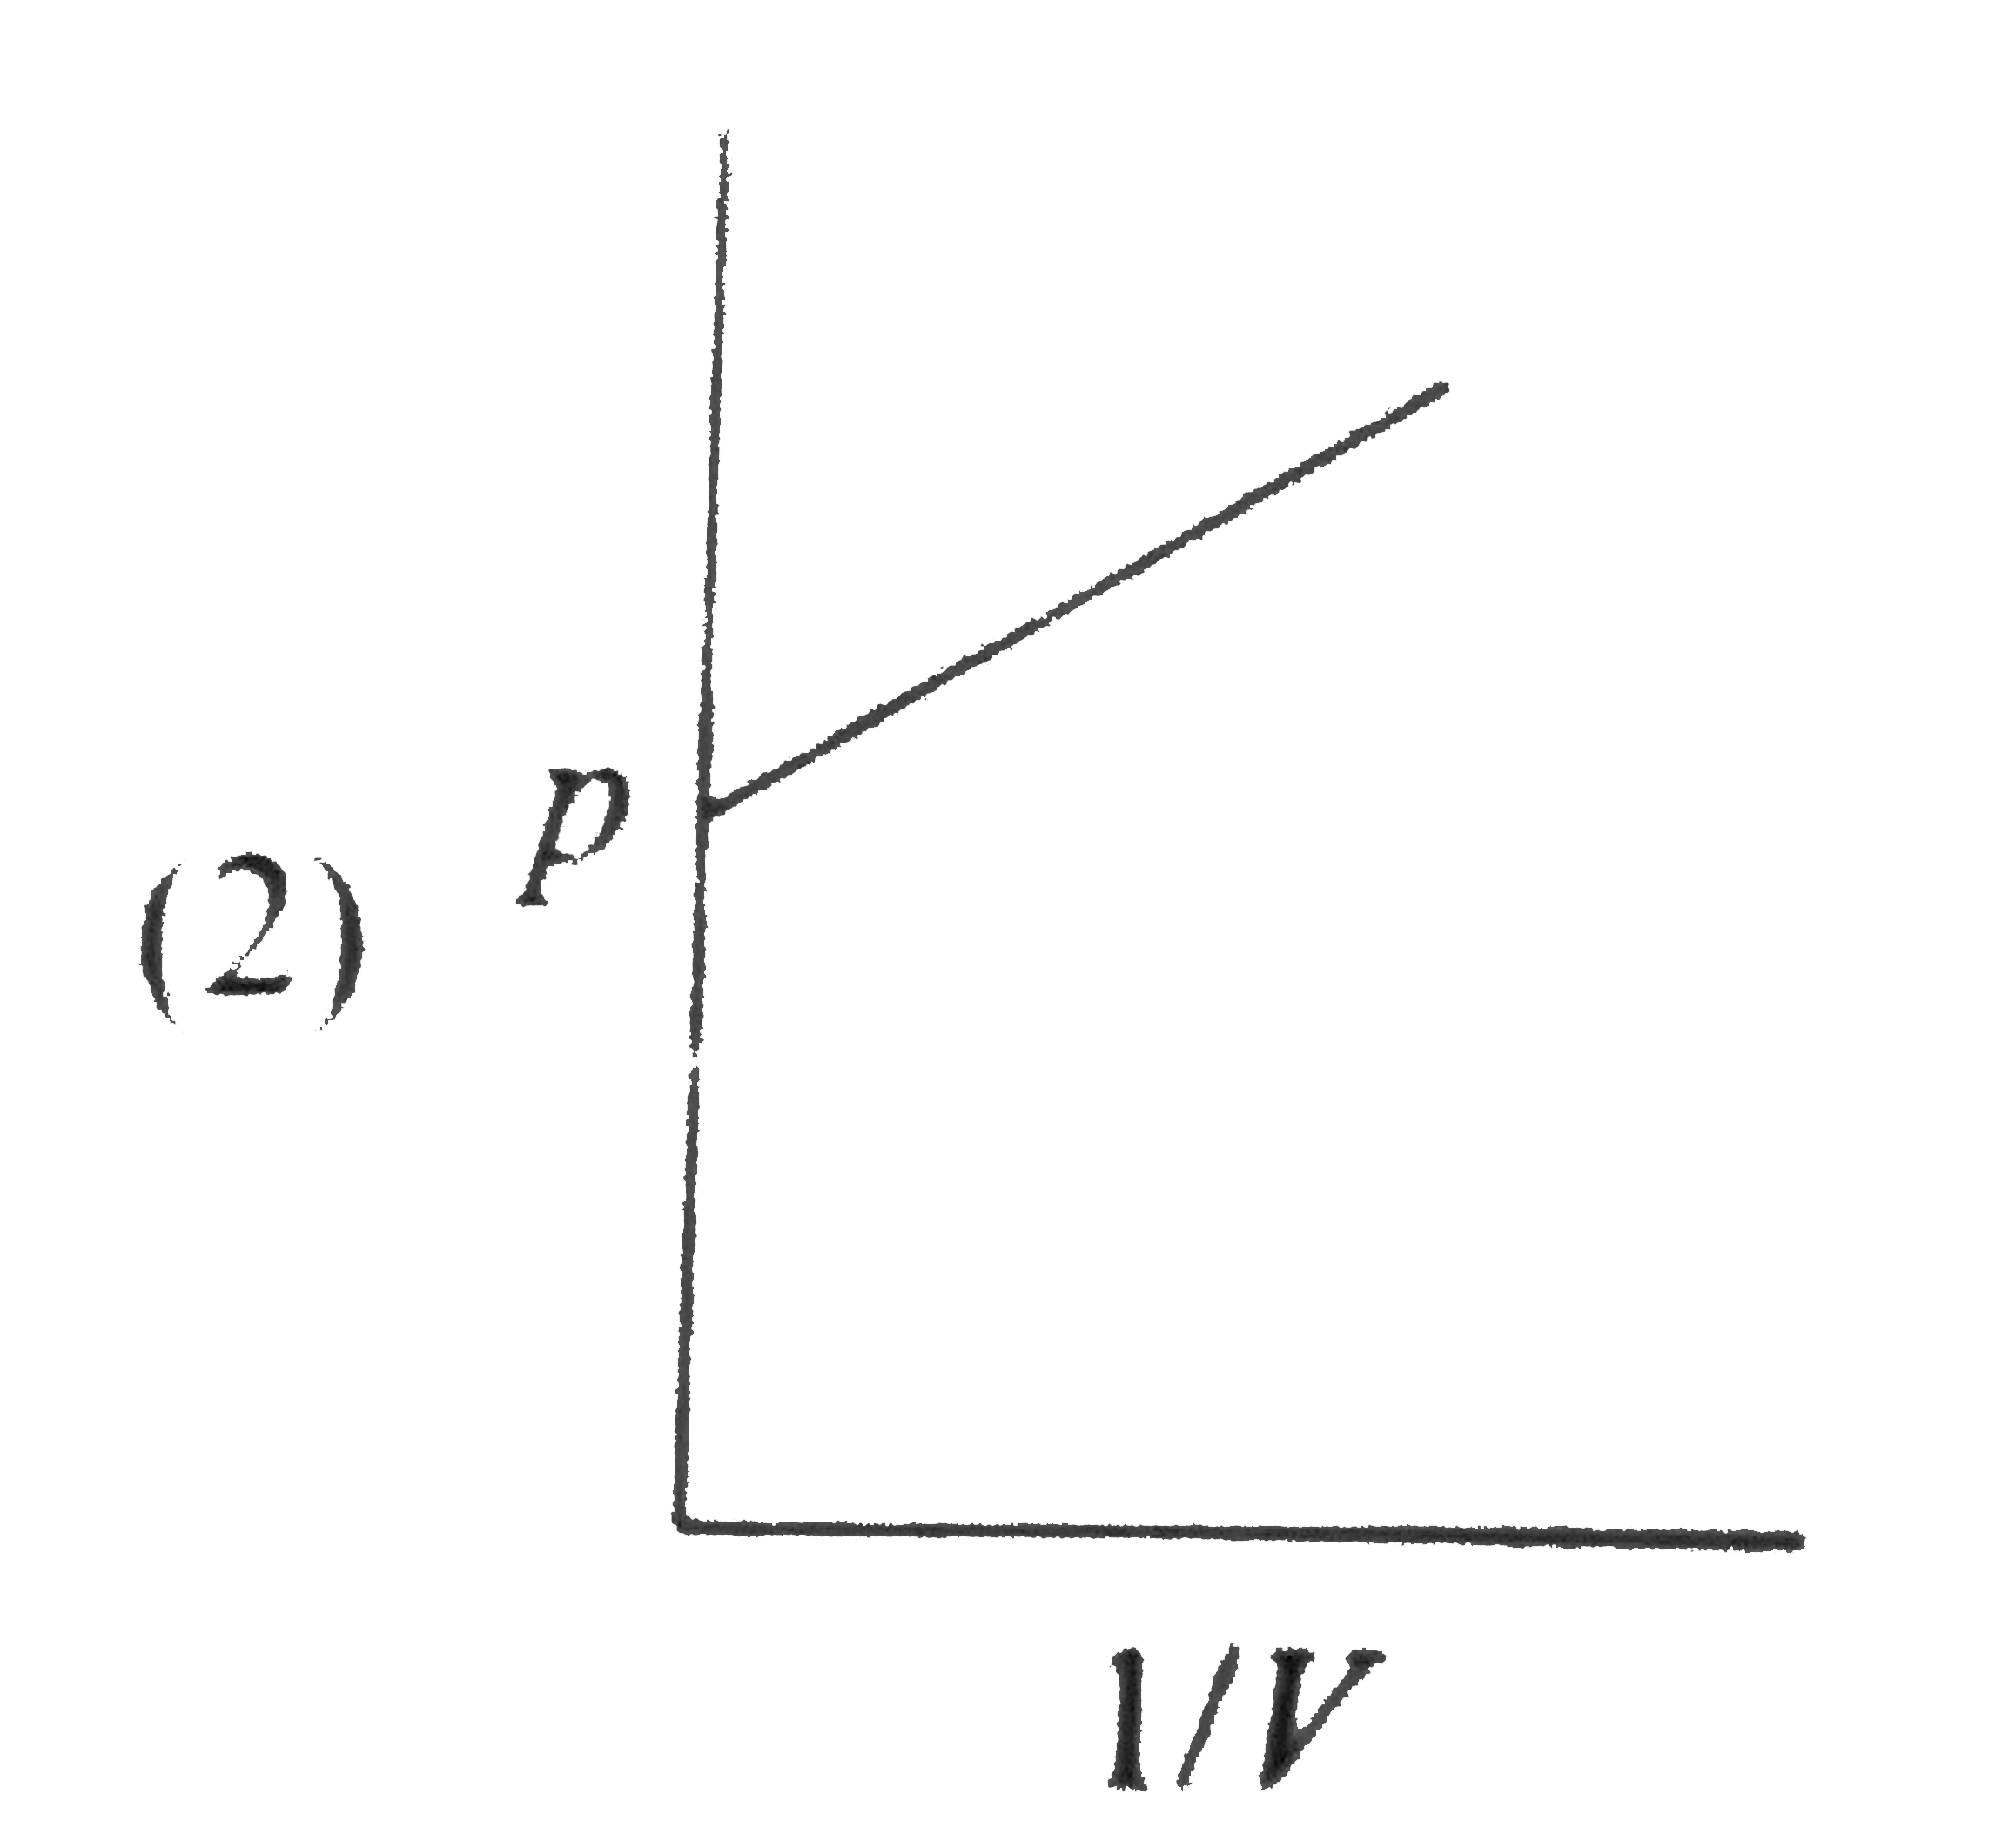 C
C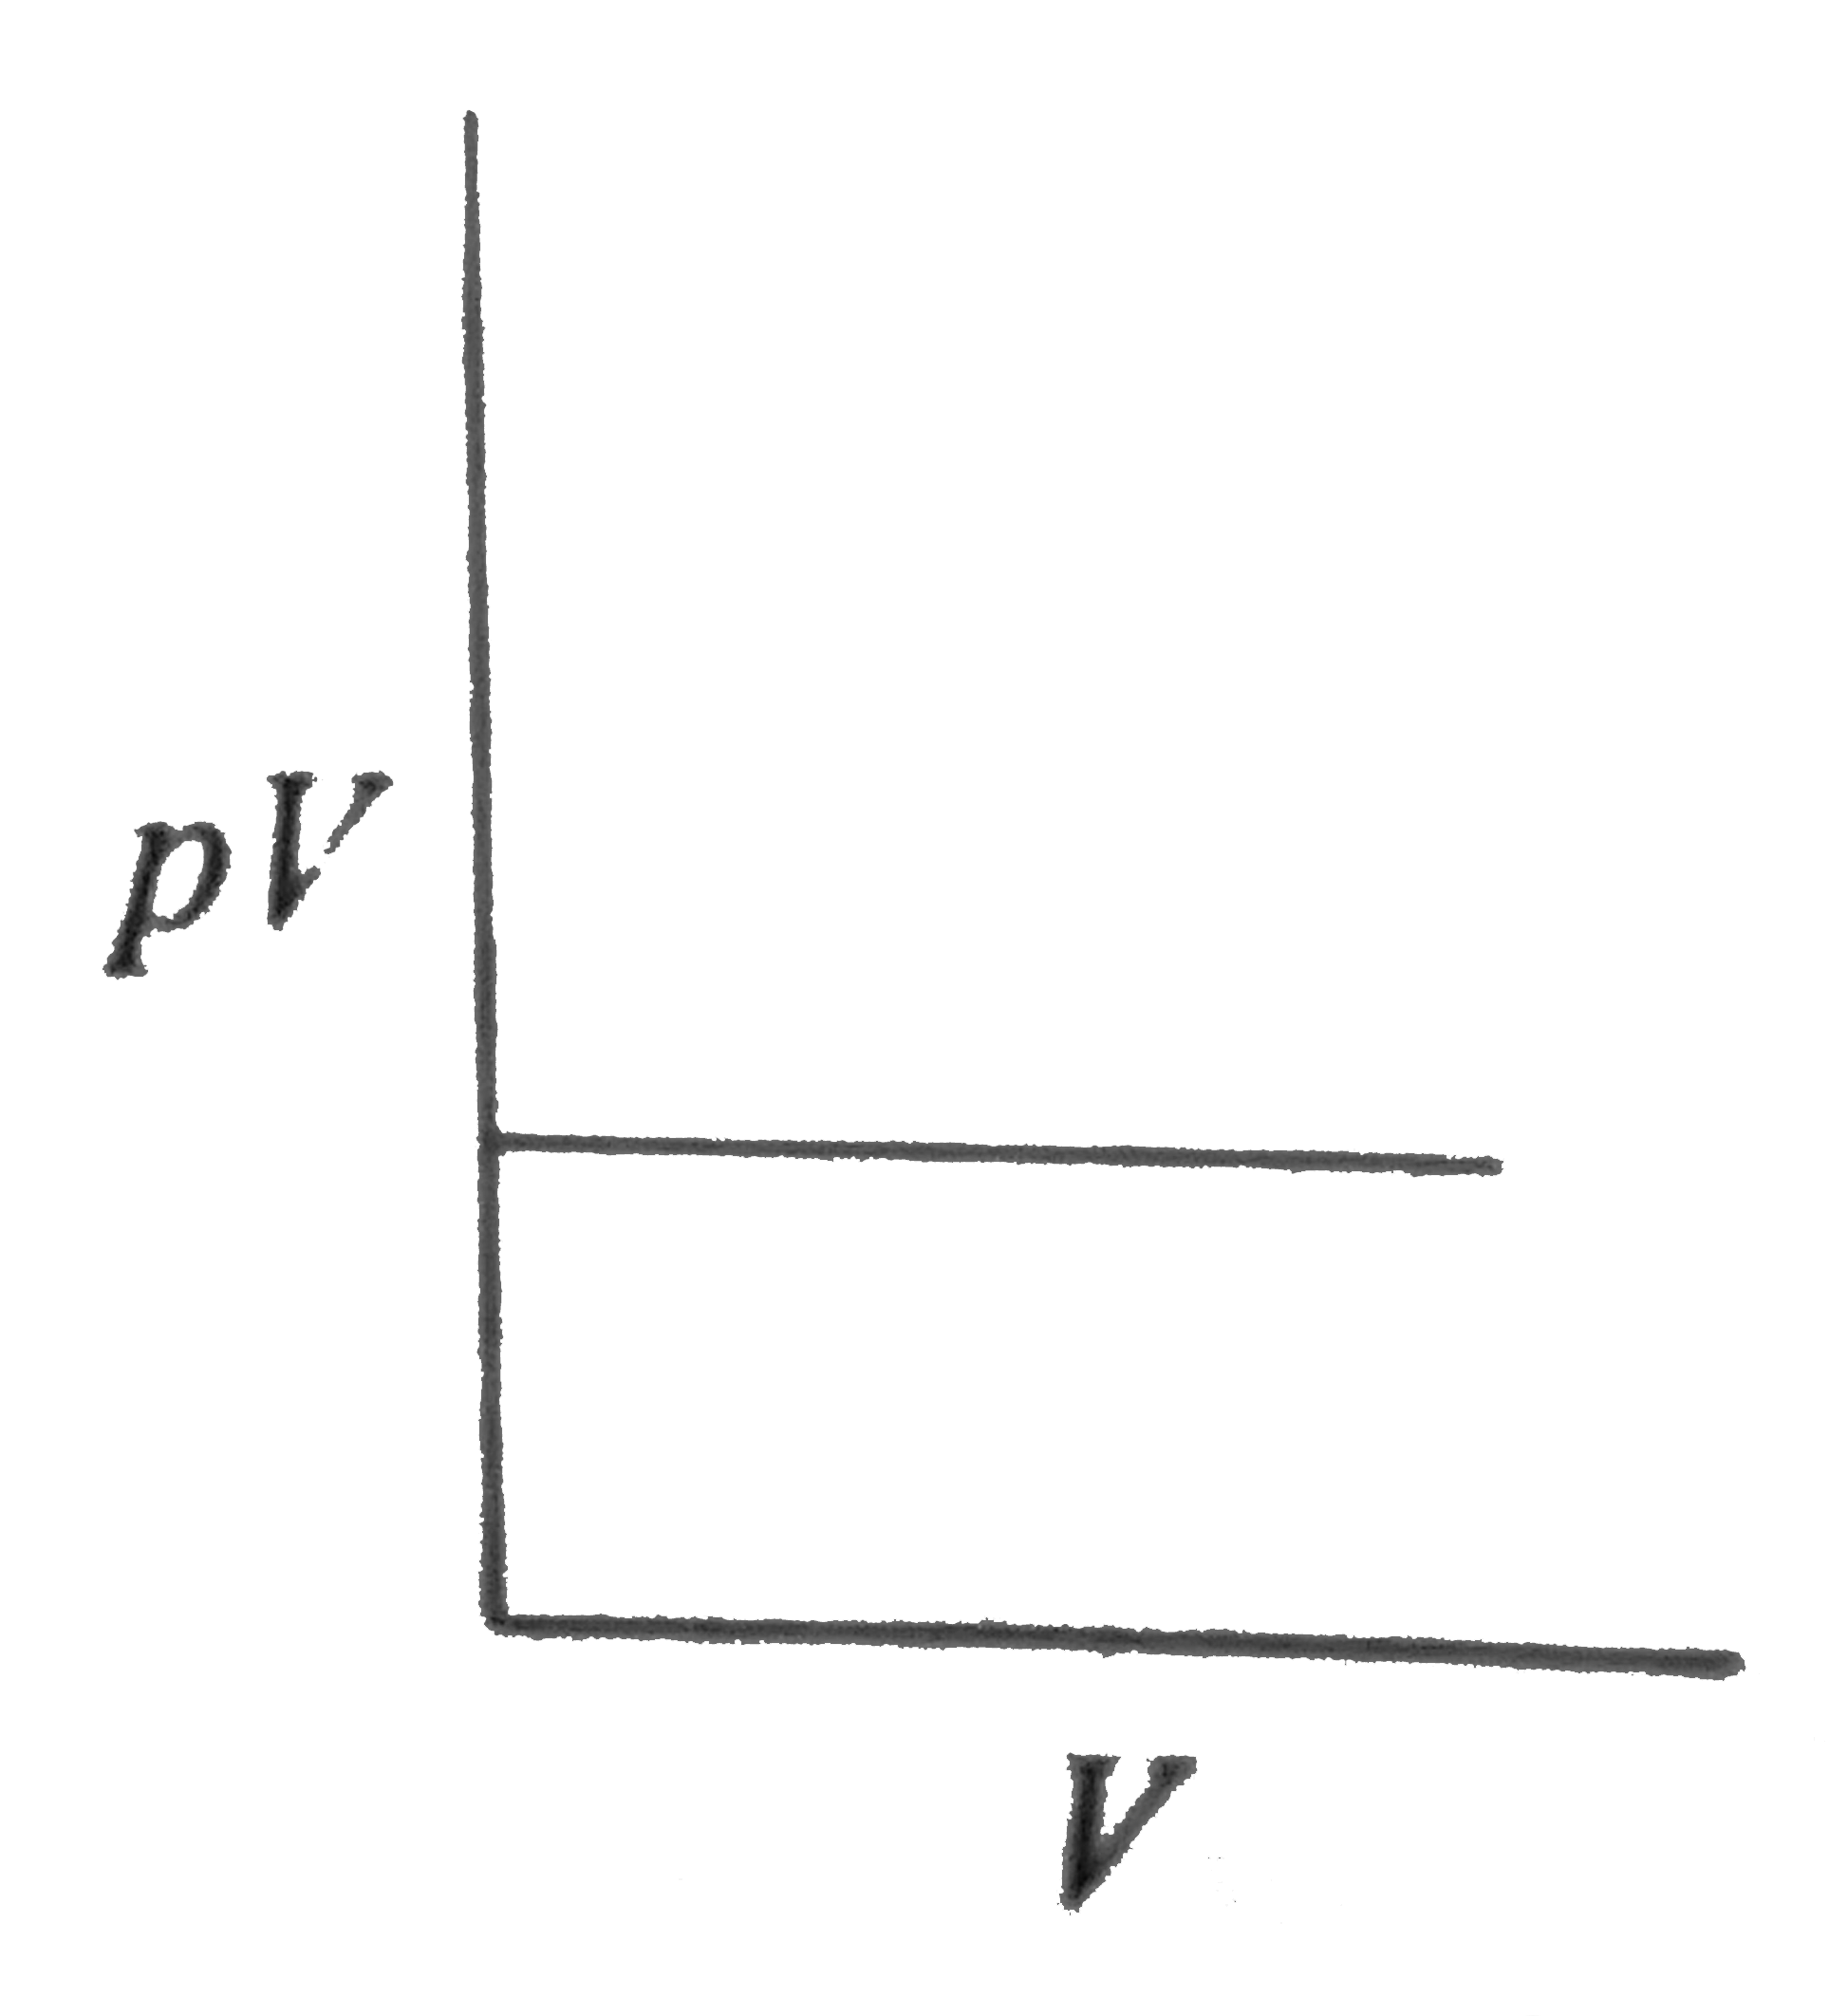 D
D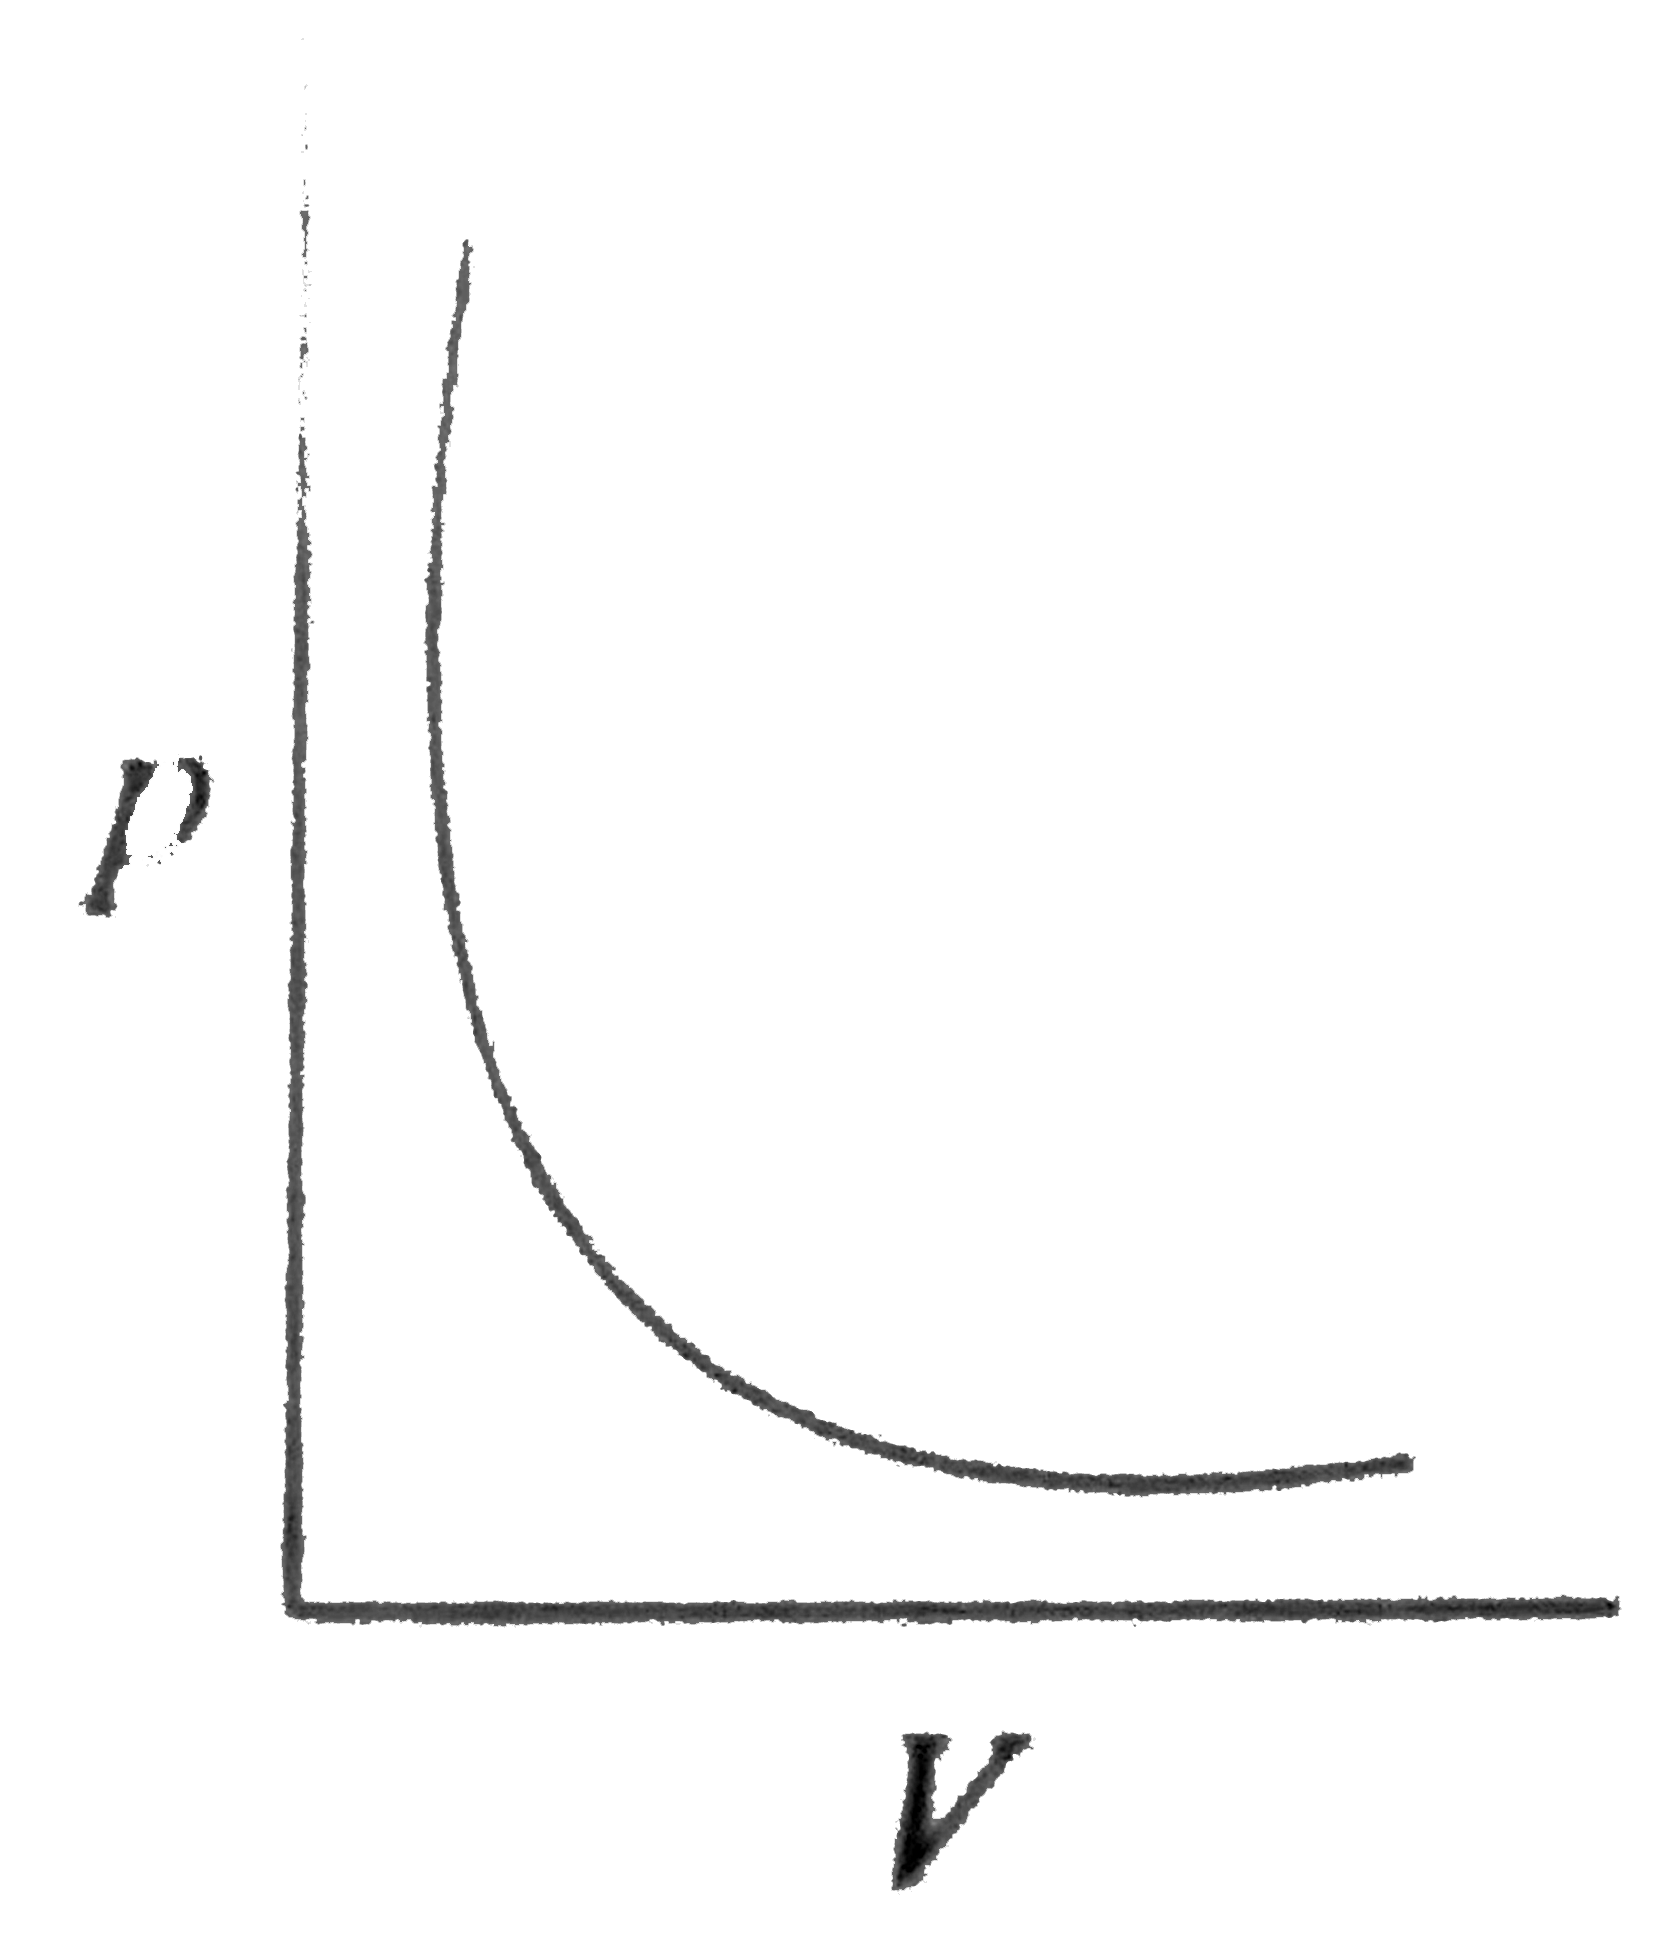
- Question 3 - Select One
A hot liquid is kept in a bog room. Accoding to Newton's law of cooling rate of cooling liquid (represented as y) is plotted against its temperature T. Which of the following curves may represent the plot?
A B
B C
C D
D
The potential as a function of x is plotted in figure. Which of the following is / are correct?
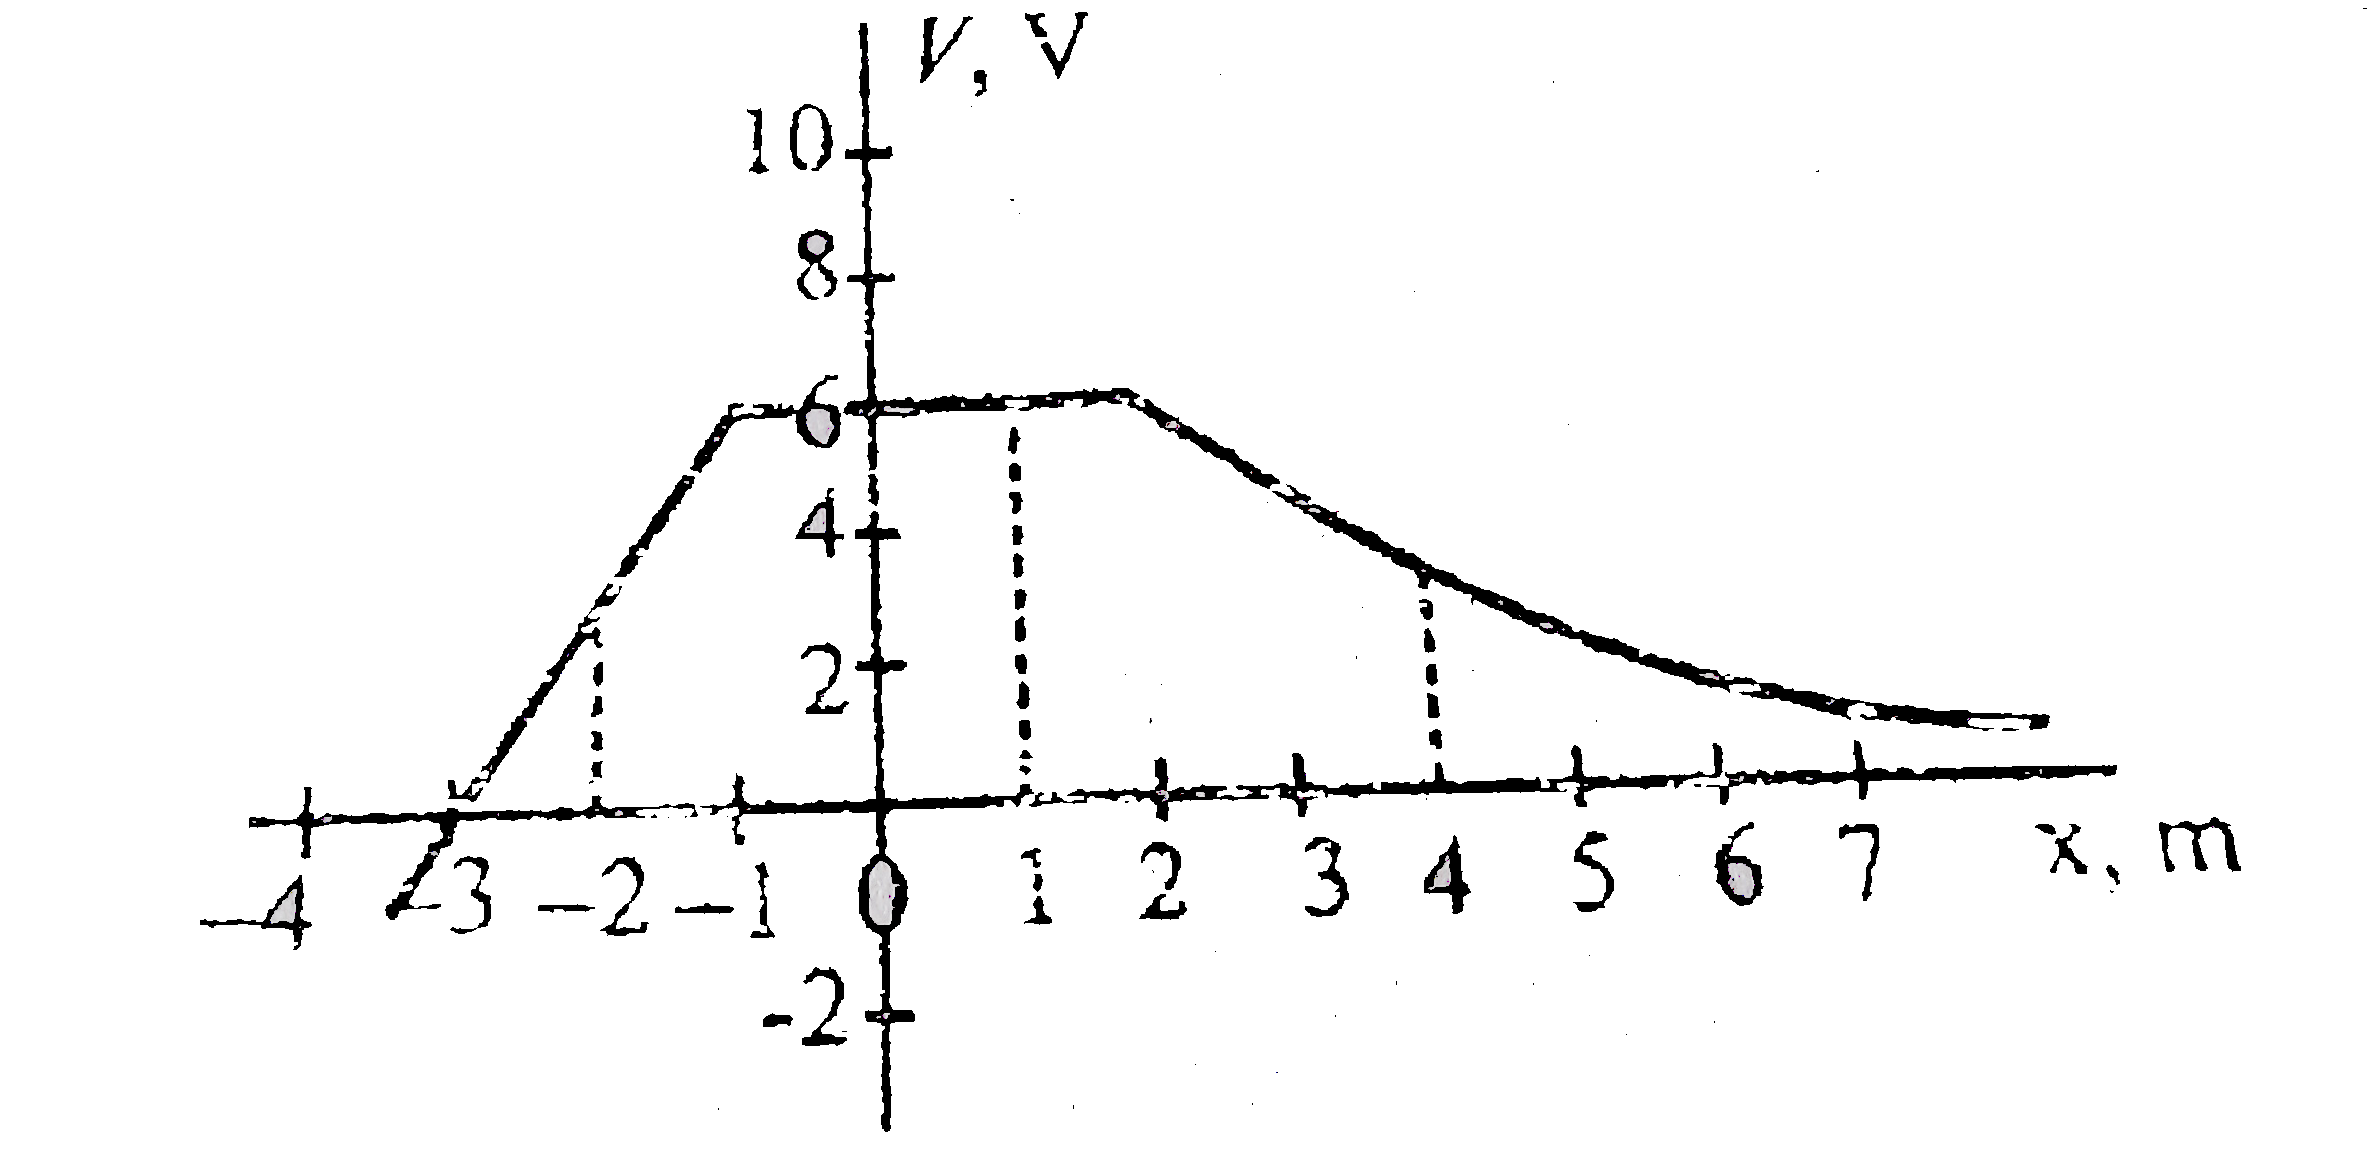 View Solution
Which of the following plots represents an exothermic reaction?
View SolutionWhich of the following plots represents an exothermic reaction?
View SolutionWhich of the following is liquid at room temperature
View SolutionWhich of the following is liquid at room temperature ?
View Solution


