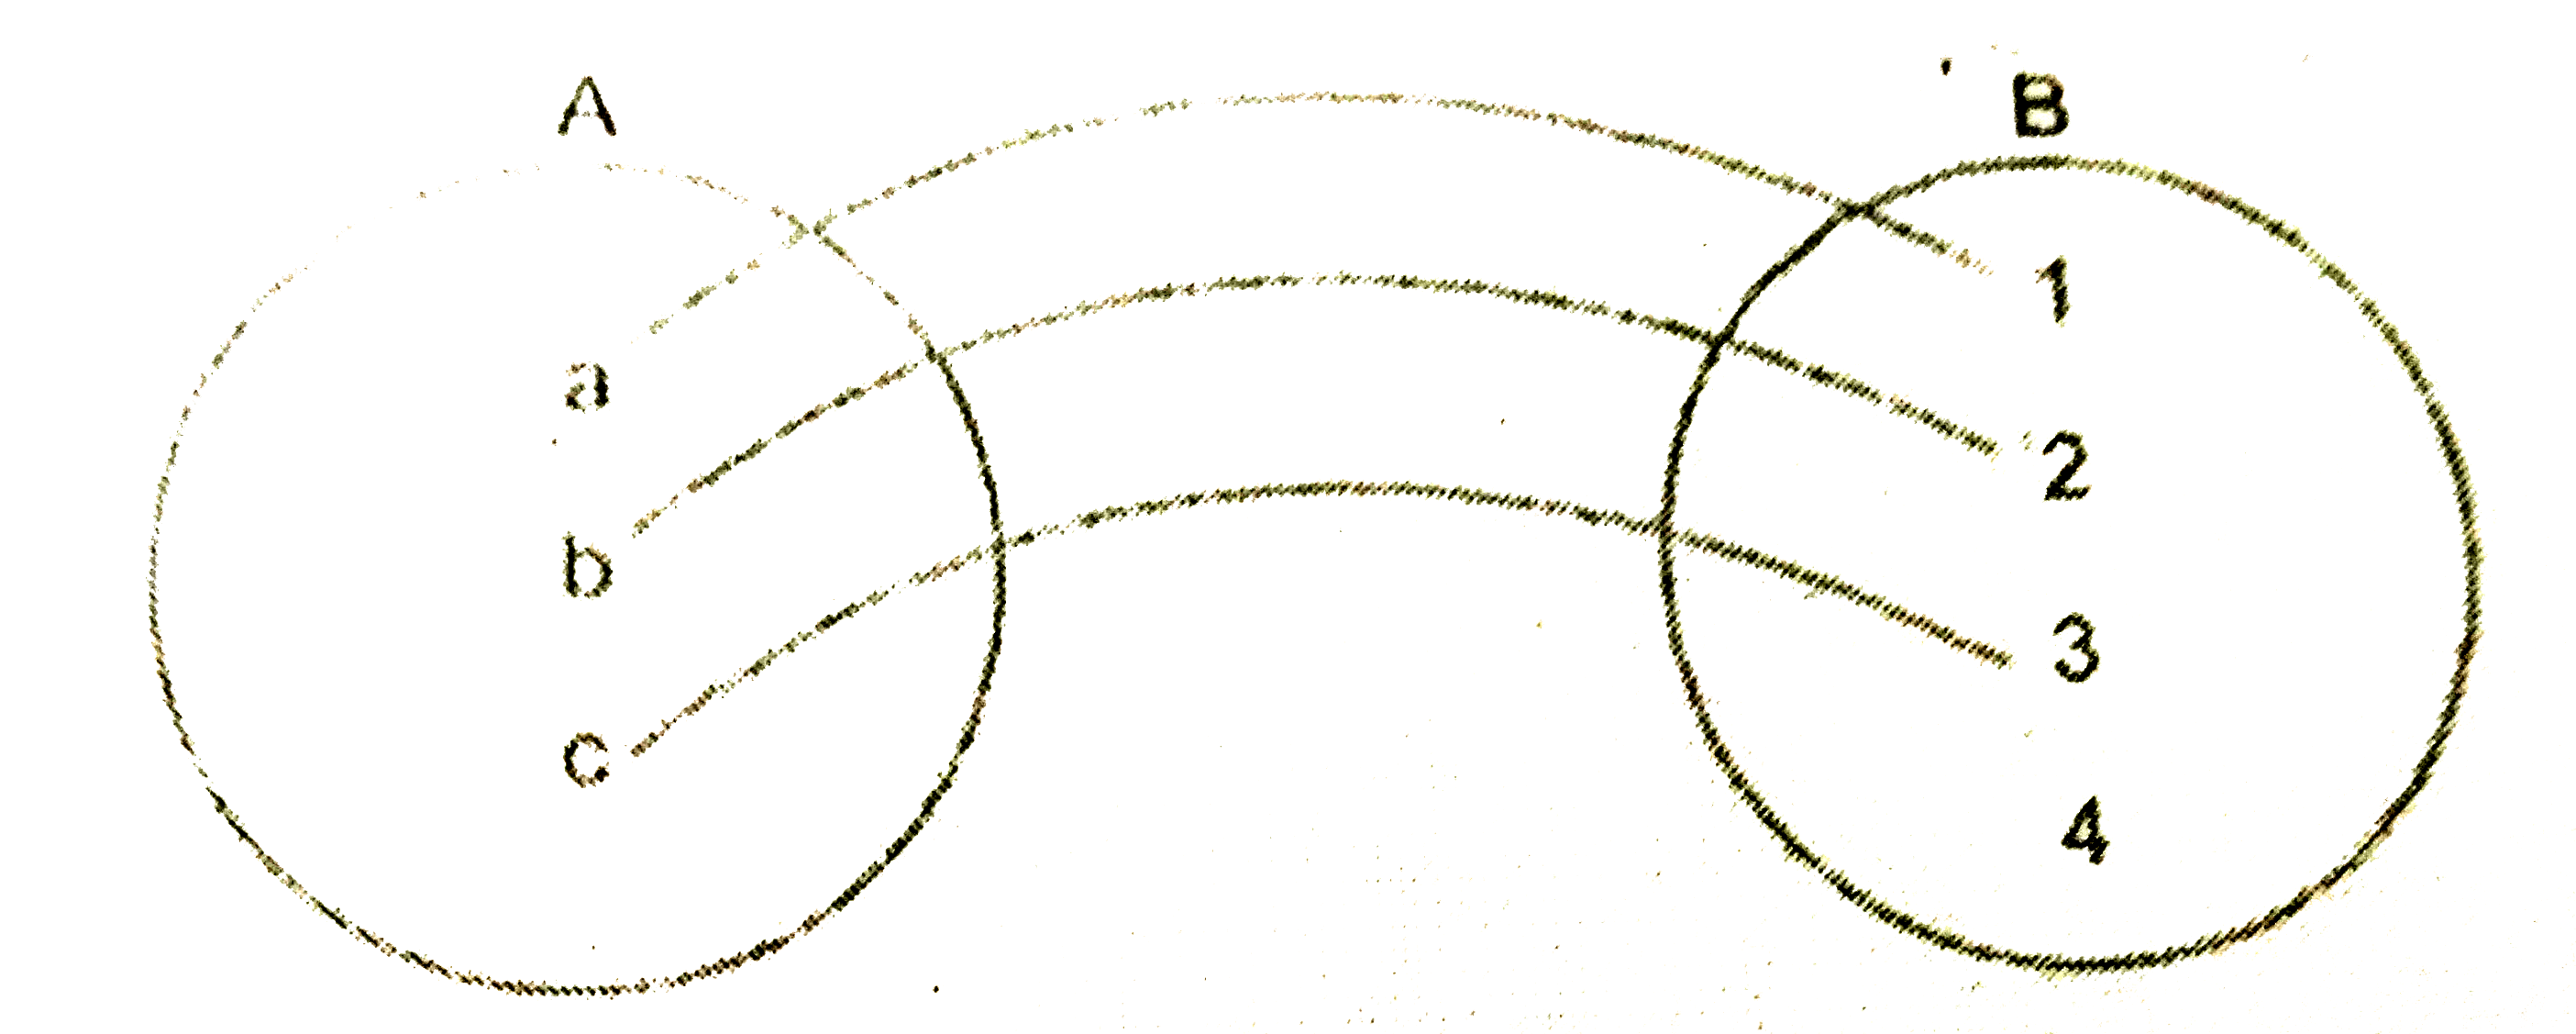
A=(a,b,c), B={1,2,3,4}

यहाँ f(a)=1,f(b)=2,f(c)=3
तो f:A→B एकाकी अंतर्पेक्स प्रतिचित्रण है।
Step by step video & image solution for A=(a,b,c), B={1,2,3,4} यहाँ f(a)=1, f(b)=2, f(c)=3 तो f:A to B एकाकी अंतर्पेक्स प्रतिचित्रण है। by Maths experts to help you in doubts & scoring excellent marks in Class 12 exams.
Updated on:21/07/2023Topper's Solved these Questions
- सम्बन्ध एवं फलनBook:MANOHAR RAYChapter:सम्बन्ध एवं फलनExercise:प्रशनावली 1(A)
Explore 3 Videos
- सम्बन्ध एवं फलनBook:MANOHAR RAYChapter:सम्बन्ध एवं फलनExercise:प्रश्नावली 1(A)
Explore 7 Videos
- समाकलनों के अनुप्रयोग Book:MANOHAR RAYChapter:समाकलनों के अनुप्रयोग Exercise:प्रश्नावली 8 (C)
Explore 16 Videos
- सारणिक Book:MANOHAR RAYChapter:सारणिक Exercise:प्रश्नावली 4(F)
Explore 26 Videos
Similar Questions
पूणांको में संबंध R इस प्रकार परिभाषित है-
xRy⇔,x,y का वर्ग है।
बताओ निम्न्लिखित में से कौन-सा कथन सत्य है-
View Solutionयदि x={1,2,3,4}, और y=4={0,2,4,6), तब ( x, y) के ऐसे क्रमित युग्मों को ज्ञात करो कि x>y.
View Solutionसरल रेखा y=x+1 का x=2 तथा x=3 के बीच भाग x -अक्ष के परितः घुमाया जाता है| परिक्रमण से बने पिण्ड का वक्रपृष्ठ है :
View Solutionप्रश्नो में दी गई समीकरण निकायों को सांगत अथवा असंगत के रूप में वर्गीकरण कीजिए।
x+2y=22x+3y=3
View SolutionIdentify A, B. C and Din Figure 19.15 respectively.
View SolutionIn the given figure (not to scale), O is the centre of the circle. A,B,C and D are concyclic and AB=CD . If /_MON =120^(@) , then find /_ OPN .
View SolutionHow many lines of symmetry does the above figure have ?
View SolutionWhich of the following are correct chain isomers of butane ? (i)
View SolutionDetermine the point of symmetry of a regular hexagon.
View SolutionDtermine the images of the following figure about the given line :
View SolutionMatch the following Column A to Column B

View SolutionMatch the following Column A to Column B

View SolutionMatch the following Column A to Column B

View SolutionThe inequation represented by the graph given below is :
View SolutionThe inequation that best describes the graph given below is _________
View SolutionThe inequation that best describes the following graph is _________
View Solution