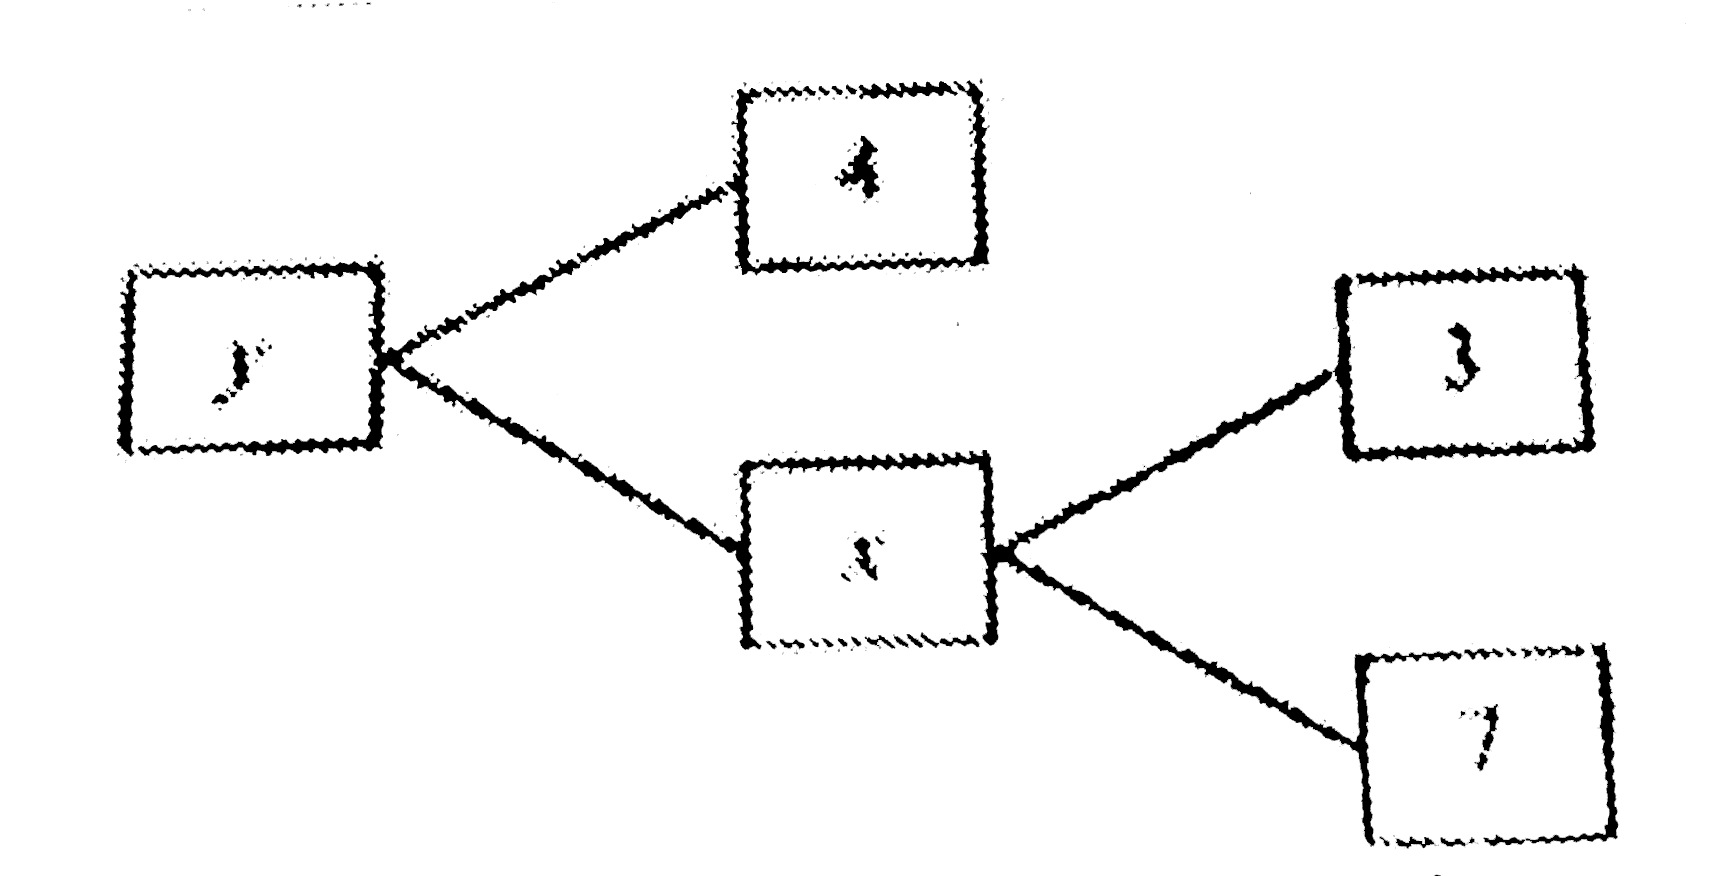
नीचे दी गई आकृति में x तथा y के मान ज्ञात कीजिए ::

Step by step video & image solution for नीचे दी गई आकृति में x तथा y के मान ज्ञात कीजिए :: by Maths experts to help you in doubts & scoring excellent marks in Class 10 exams.
Updated on:21/07/2023Topper's Solved these Questions
- वास्तविक संख्याएँ BOOK - MANOHAR RAYCHAPTER - वास्तविक संख्याएँ EXERCISE - प्रश्नावली 1(C)
9 Videos
- वास्तविक संख्याएँ BOOK - MANOHAR RAYCHAPTER - वास्तविक संख्याएँ EXERCISE - प्रश्नावली 1(D)
11 Videos
- वास्तविक संख्याएँ BOOK - MANOHAR RAYCHAPTER - वास्तविक संख्याएँ EXERCISE - प्रश्नावली 1(A)
15 Videos
- बहुपद BOOK - MANOHAR RAYCHAPTER - बहुपद EXERCISE - प्रश्नावली 2(L)
21 Videos
- वृत्तBOOK - MANOHAR RAYCHAPTER - वृत्तEXERCISE - प्रश्नावली 10(C)
12 Videos
Similar Questions
सिद्ध कीजिए कि 3√3 एक परिमेय संख्या नहीं है ।
View Solutionबिना लम्बी विभाजन प्रक्रिया किए बताइए कि निम्नलिखित परिमेय संख्याओं के दशमलव प्रसार सांत है या असांत आवर्ती है-
(i)178 (ii)151600 (iii)232352 (iv)3550 (v)615 (vi)129225775 (vii)77210 (viii)133125 64455 (x)29343
View Solutionनिम्नलिखित संख्याओं का H.C.F ज्ञात करने के लिए यूक्लिड विभाजन एल्गोरिथम का प्रयोग कीजिए -
(A) 135 और 225,
(B) 196 और 38220,
(C) 867 और 255
View Solutionउपयुक्त सर्वसमिकाओं को प्रयोग करके निम्नलिखित गुणनफल ज्ञात कीजिए :
(i) (x+4)(x+10)
(ii) (x+8)(x−10)
(iii) (3x+4)(3x−5)
(iv) (y2+32)(y2−32)
(v) (3−2x)(3+2x)
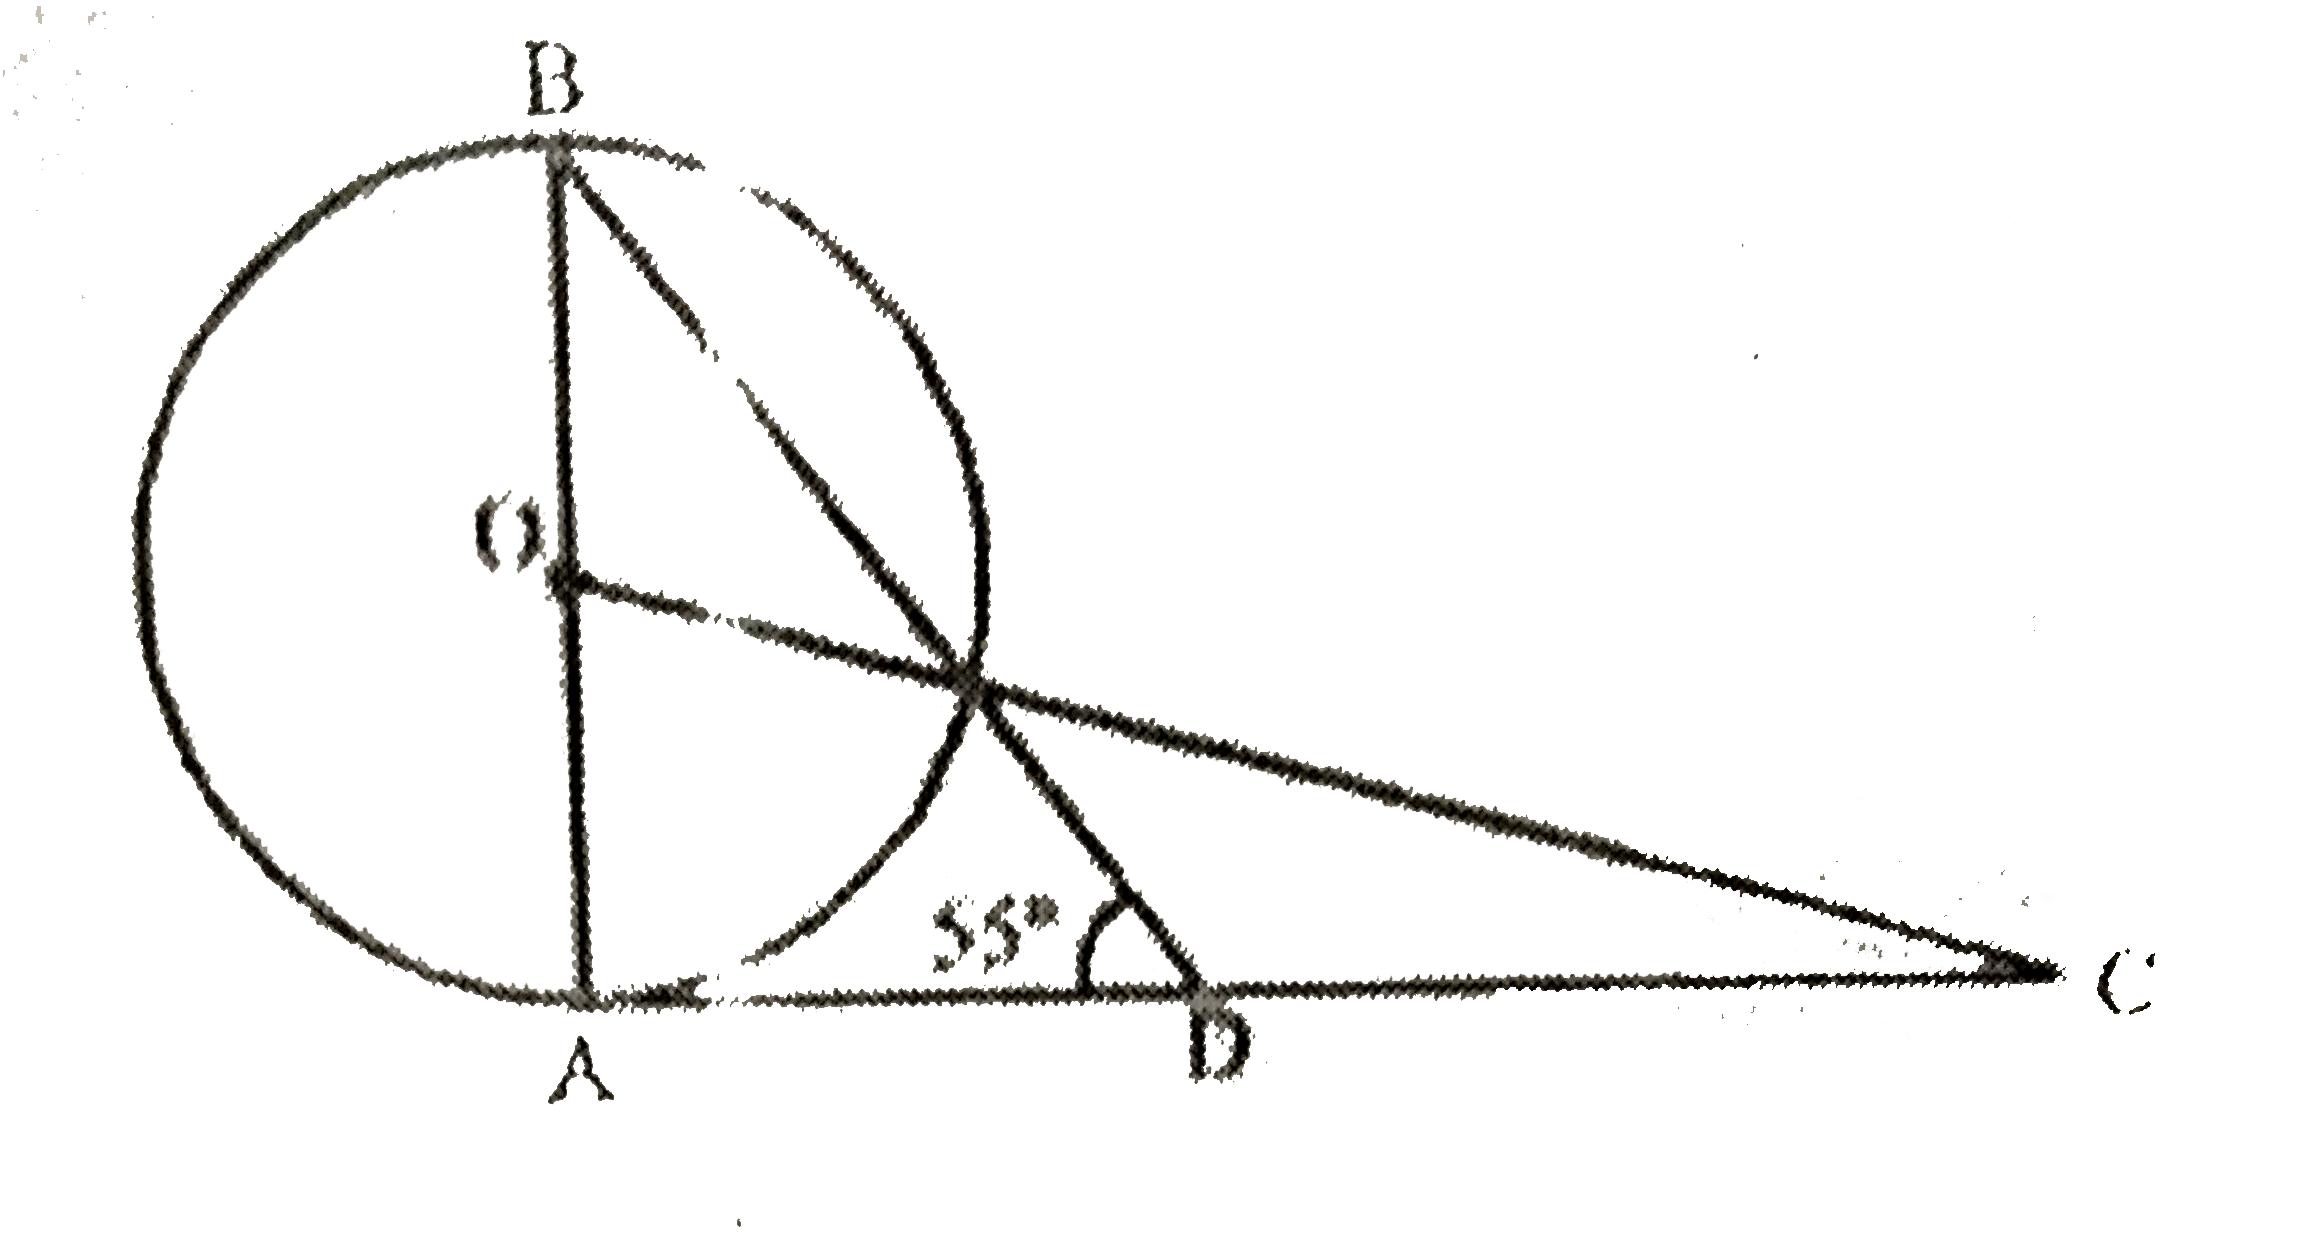
View Solutionचित्र में, वृत्त का केन्द्र O है और AC वृत्त की स्पर्श रेखा है। यदि ∠ADB=55∘,तो ∠ACO की माप होगी :

View SolutionIdentify the cell organelle 'A' :-
ltimg src="https://d10lpgp6xz60nq.cloudfront.net/physics_images/ALN_BIO_C10_E08_018_Q01.png" width="80%"gt
View SolutionHow many lines of symmetry does the above figure have ?
View SolutionWhich of the following are correct chain isomers of butane ? (i)
View SolutionDetermine the point of symmetry of a regular hexagon.
View SolutionDtermine the images of the following figure about the given line :
View SolutionMatch the following Column A to Column B

View SolutionMatch the following Column A to Column B

View SolutionMatch the following Column A to Column B

View SolutionThe inequation represented by the graph given below is :
View SolutionThe inequation that best describes the graph given below is _________
View SolutionThe inequation that best describes the following graph is _________
View Solution
