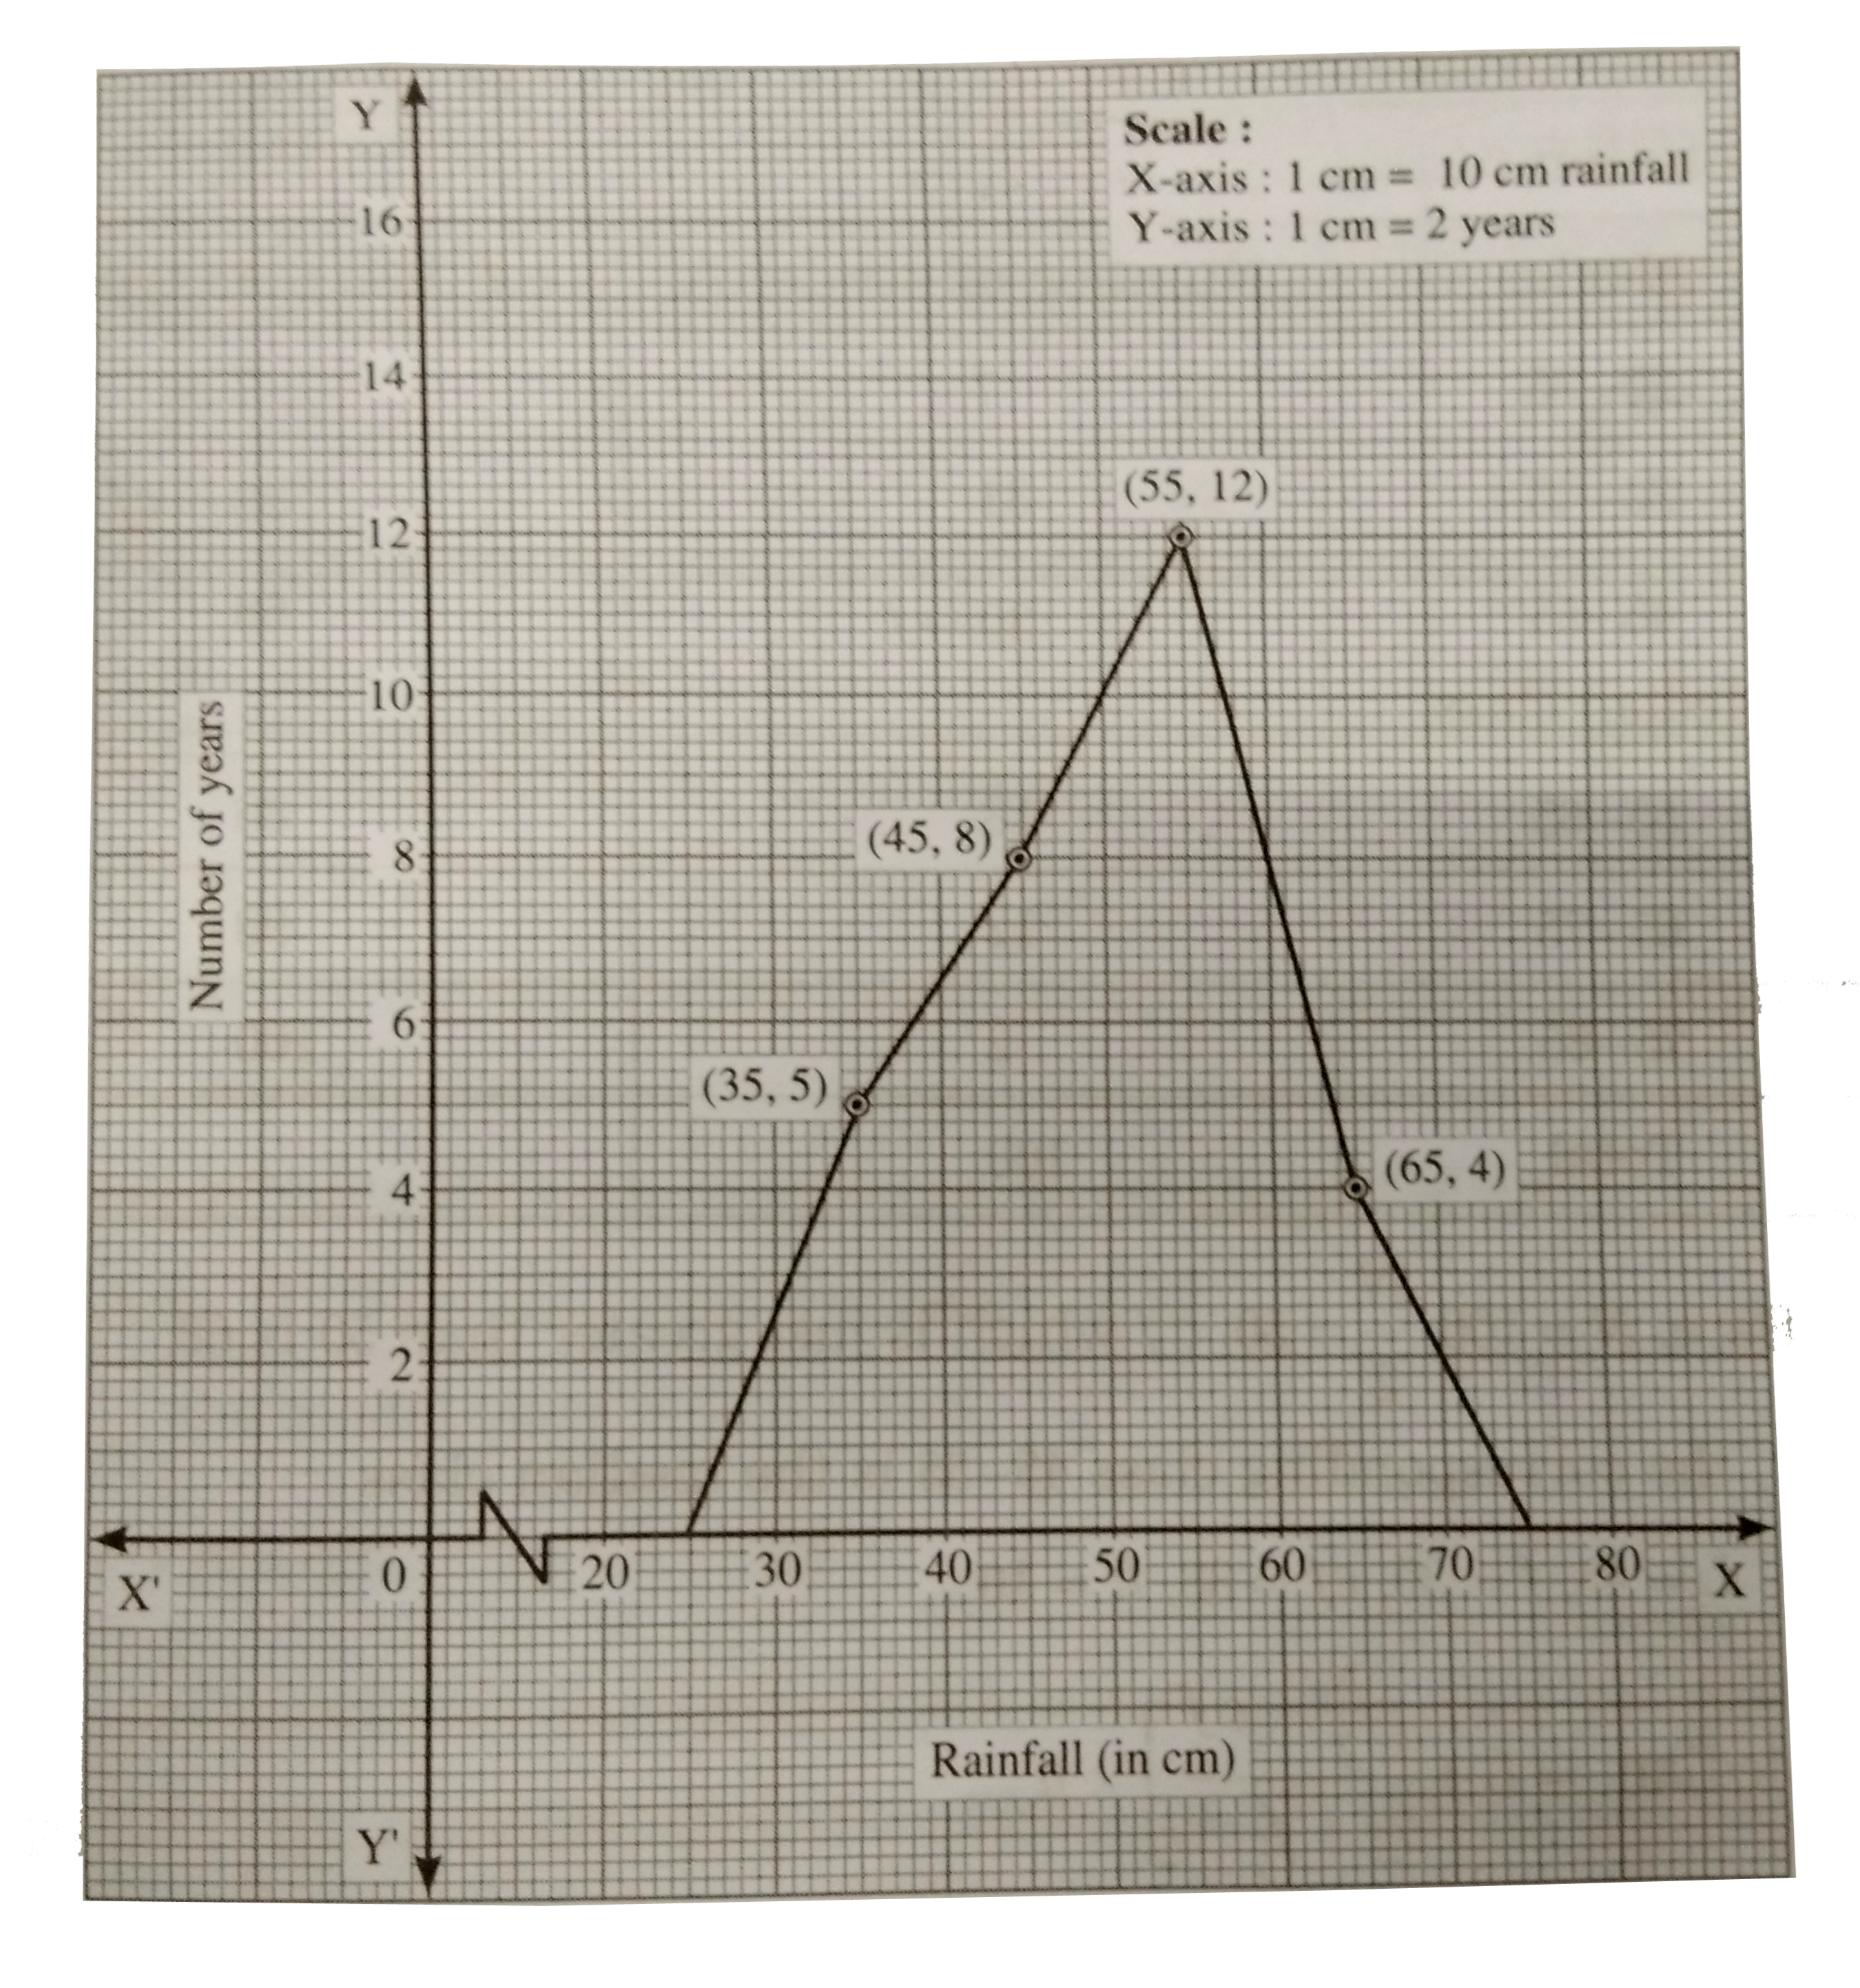
Observe the following frequency polygon and answer following questions :

(1) For how many years was the rainfall maximum?
(2) For how many years was the rainfall minimum?
(3) What was the rainfall for 12 years?
(4) For how many years was the rainfall 35 cm?
(5) What is the difference between the maximum and minimum rainfall?
(6) Which classes have frequency zero?
The correct Answer is:(1) 4 years (2) 5 years (3) 50-60 cm
(4) 5 years (5) 30 cm (6) 20-30 and 70-80.
Step by step video & image solution for Observe the following frequency polygon and answer following questions : (1) For how many years was the rainfall maximum? (2) For how many years was the rainfall minimum? (3) What was the rainfall for 12 years? (4) For how many years was the rainfall 35 cm? (5) What is the difference between the maximum and minimum rainfall? (6) Which classes have frequency zero? by Maths experts to help you in doubts & scoring excellent marks in Class 10 exams.
Updated on:21/07/2023Topper's Solved these Questions
- STATISTICSBOOK - NAVNEET PUBLICATION - MAHARASHTRA BOARDCHAPTER - STATISTICSEXERCISE - Assignment 6.1
4 Videos
- STATISTICSBOOK - NAVNEET PUBLICATION - MAHARASHTRA BOARDCHAPTER - STATISTICSEXERCISE - Assignment 6.2
5 Videos
- SIMILARITYBOOK - NAVNEET PUBLICATION - MAHARASHTRA BOARDCHAPTER - SIMILARITYEXERCISE - SUBJECTIVE TYPE
20 Videos
- THEOREMS BOOK - NAVNEET PUBLICATION - MAHARASHTRA BOARDCHAPTER - THEOREMS EXERCISE - CIRCLE
15 Videos
Similar Questions
Knowledge Check
The rainfall in Jaisalmer is:
A9 cm.B8 cm.C10 cm.D12 cm.In India, maximum amount of rainfall is received from
AWestern DisturbancesBNorth-east MonsoonCSouth-west MonsoonDRetreating MonsoonMonsoon forests annual rainfall is
A50-150 cmB150-200 cmC70-200 cmD70-100 cm
The rainfall (in mm) in a city on 7 days of a certain week was recorded as follows:(i) Find the range of the rainfall in the above data.(ii) Find the mean rainfall for the week.(iii) On how many days was the rainfall less than the mean rainfall.
View SolutionRead the following bar graph and answer the following question: What information is given by the bar graph? In which year the export is minimum? In which year the import is maximum? In which year the difference of the values of export and import is maximum?
View SolutionHighest rainfall occurs in Mawsynram
View SolutionThe area with annual rainfall less than 50 cm in a year is
View SolutionThe area with annual rainfall less than 50 cm in a year is
View Solution
