Energy profile diagram.
The graph of the potential energy of species in the reaction verses reaction coordinate during the course of the reaction is called an energy profile diagram.
Similar Questions
Niki, Nita and Nitu study in the 9th standard. They were carrying out three different reversible reactions. When the reaction attained their state of equilibrium, they measured the concentration of each gas present in the equilibrium mixture and calculated the Kc value of each reaction. They were provided with the energy profile diagrams of each reaction. From this information, they prepared the following table.
From the data given in the table, calculate which reaction will take the maximum time to reach equilibrium and which one will give the maximum yield.
 View Solution
Define : : Explain, with energy profile díagram, the mechanísm of alkaline hydrolysis of methyl bromide or Bromomethane
View Solution
Knowledge Check
- Question 1 - Select One
Substances which alter the velocity of a reaction by mere presence, without undergoing any change in mass and compossition are termed catalyst and the phenomenon is known as catalysis
For the reaction (A→B+C) , the energy profile diagram is given in the figure below.
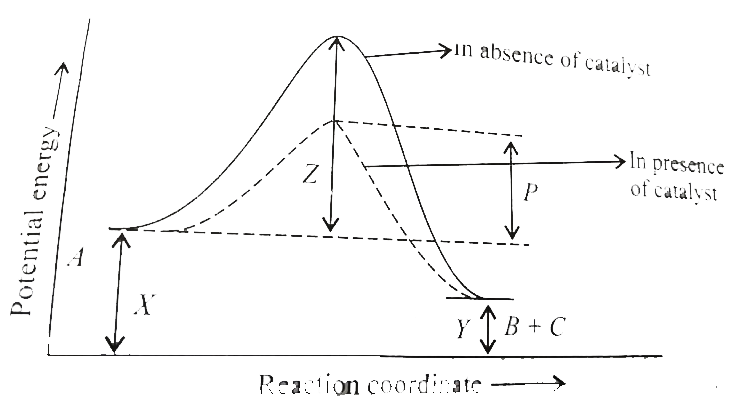
The decrease in ht eenergy of activation in hte presence of catalyst isAZBZ−PCY−ZDZ−X - Question 2 - Select One
Energy profile digaram for an exothermic reaction A1−−→B2−−→C3−−→D, is given below .
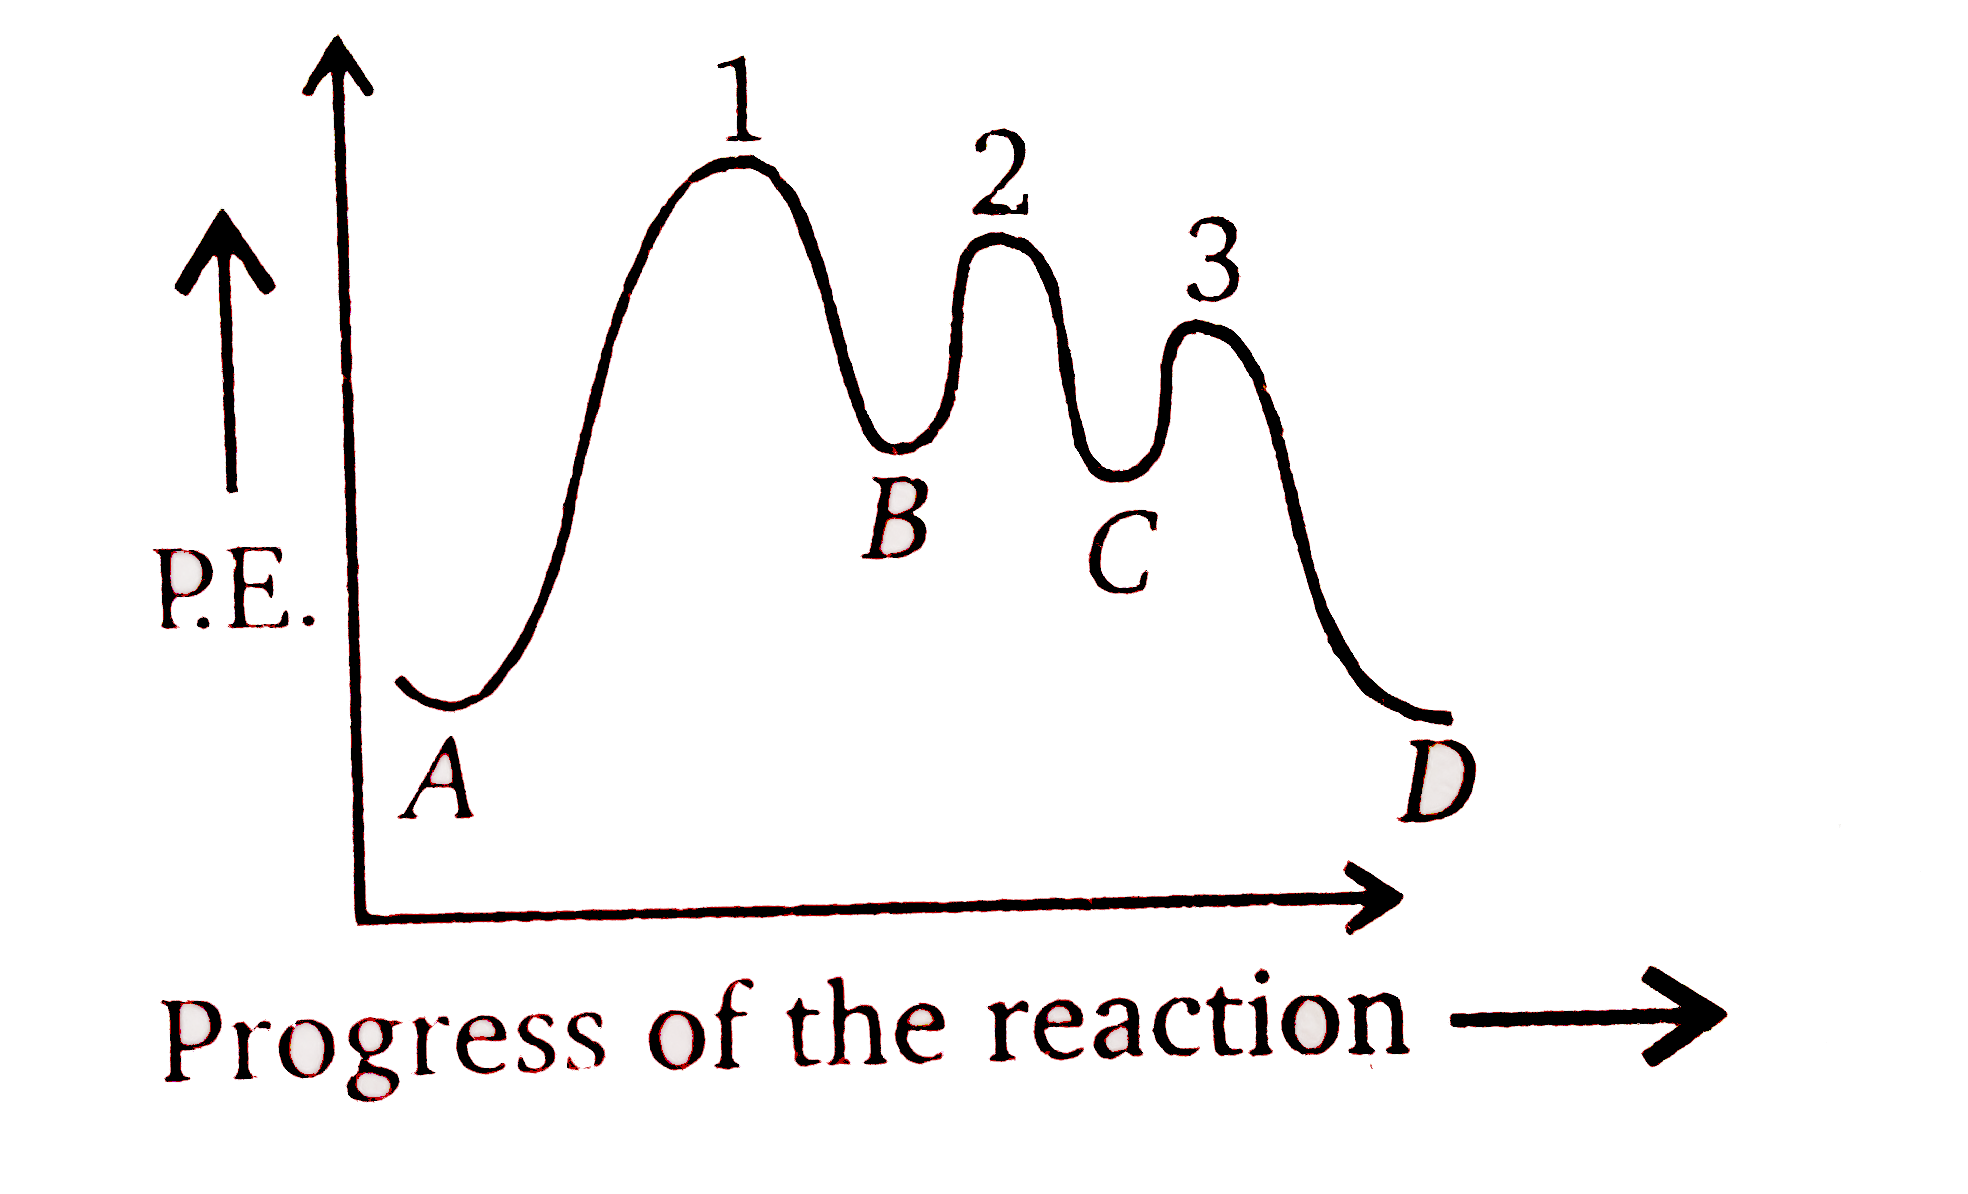
the rate determining step of the reaction is:AA→BBB→CCC→DDCan not predict - Question 3 - Select One
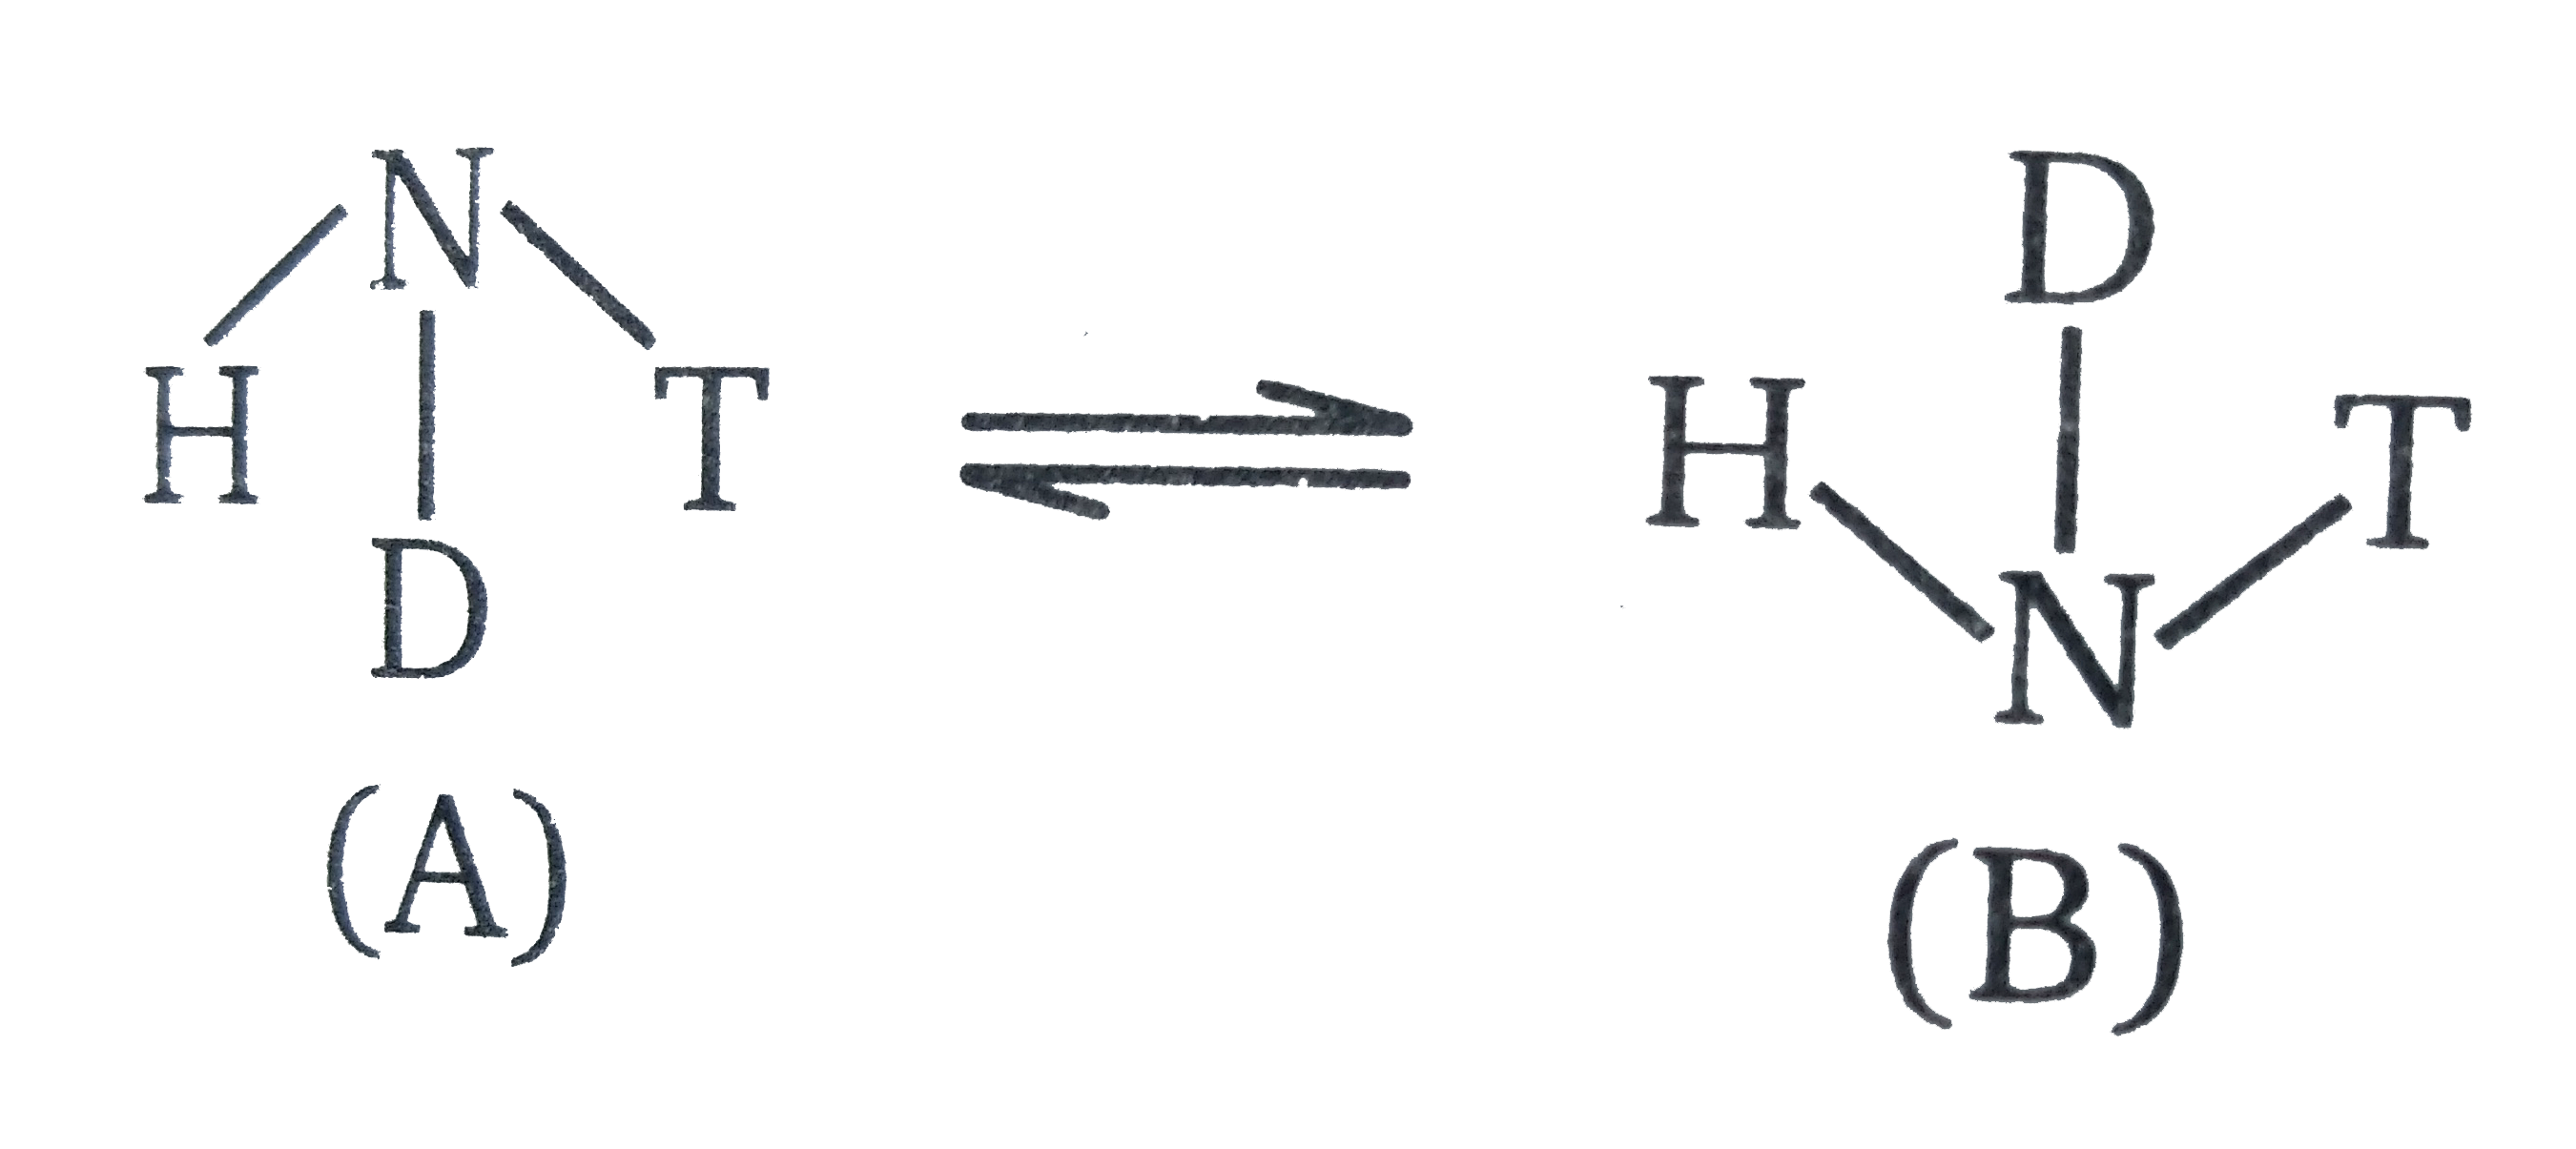
Correct energy profile for amine inversion and hybridization of nitrogen in transition state is
 A
A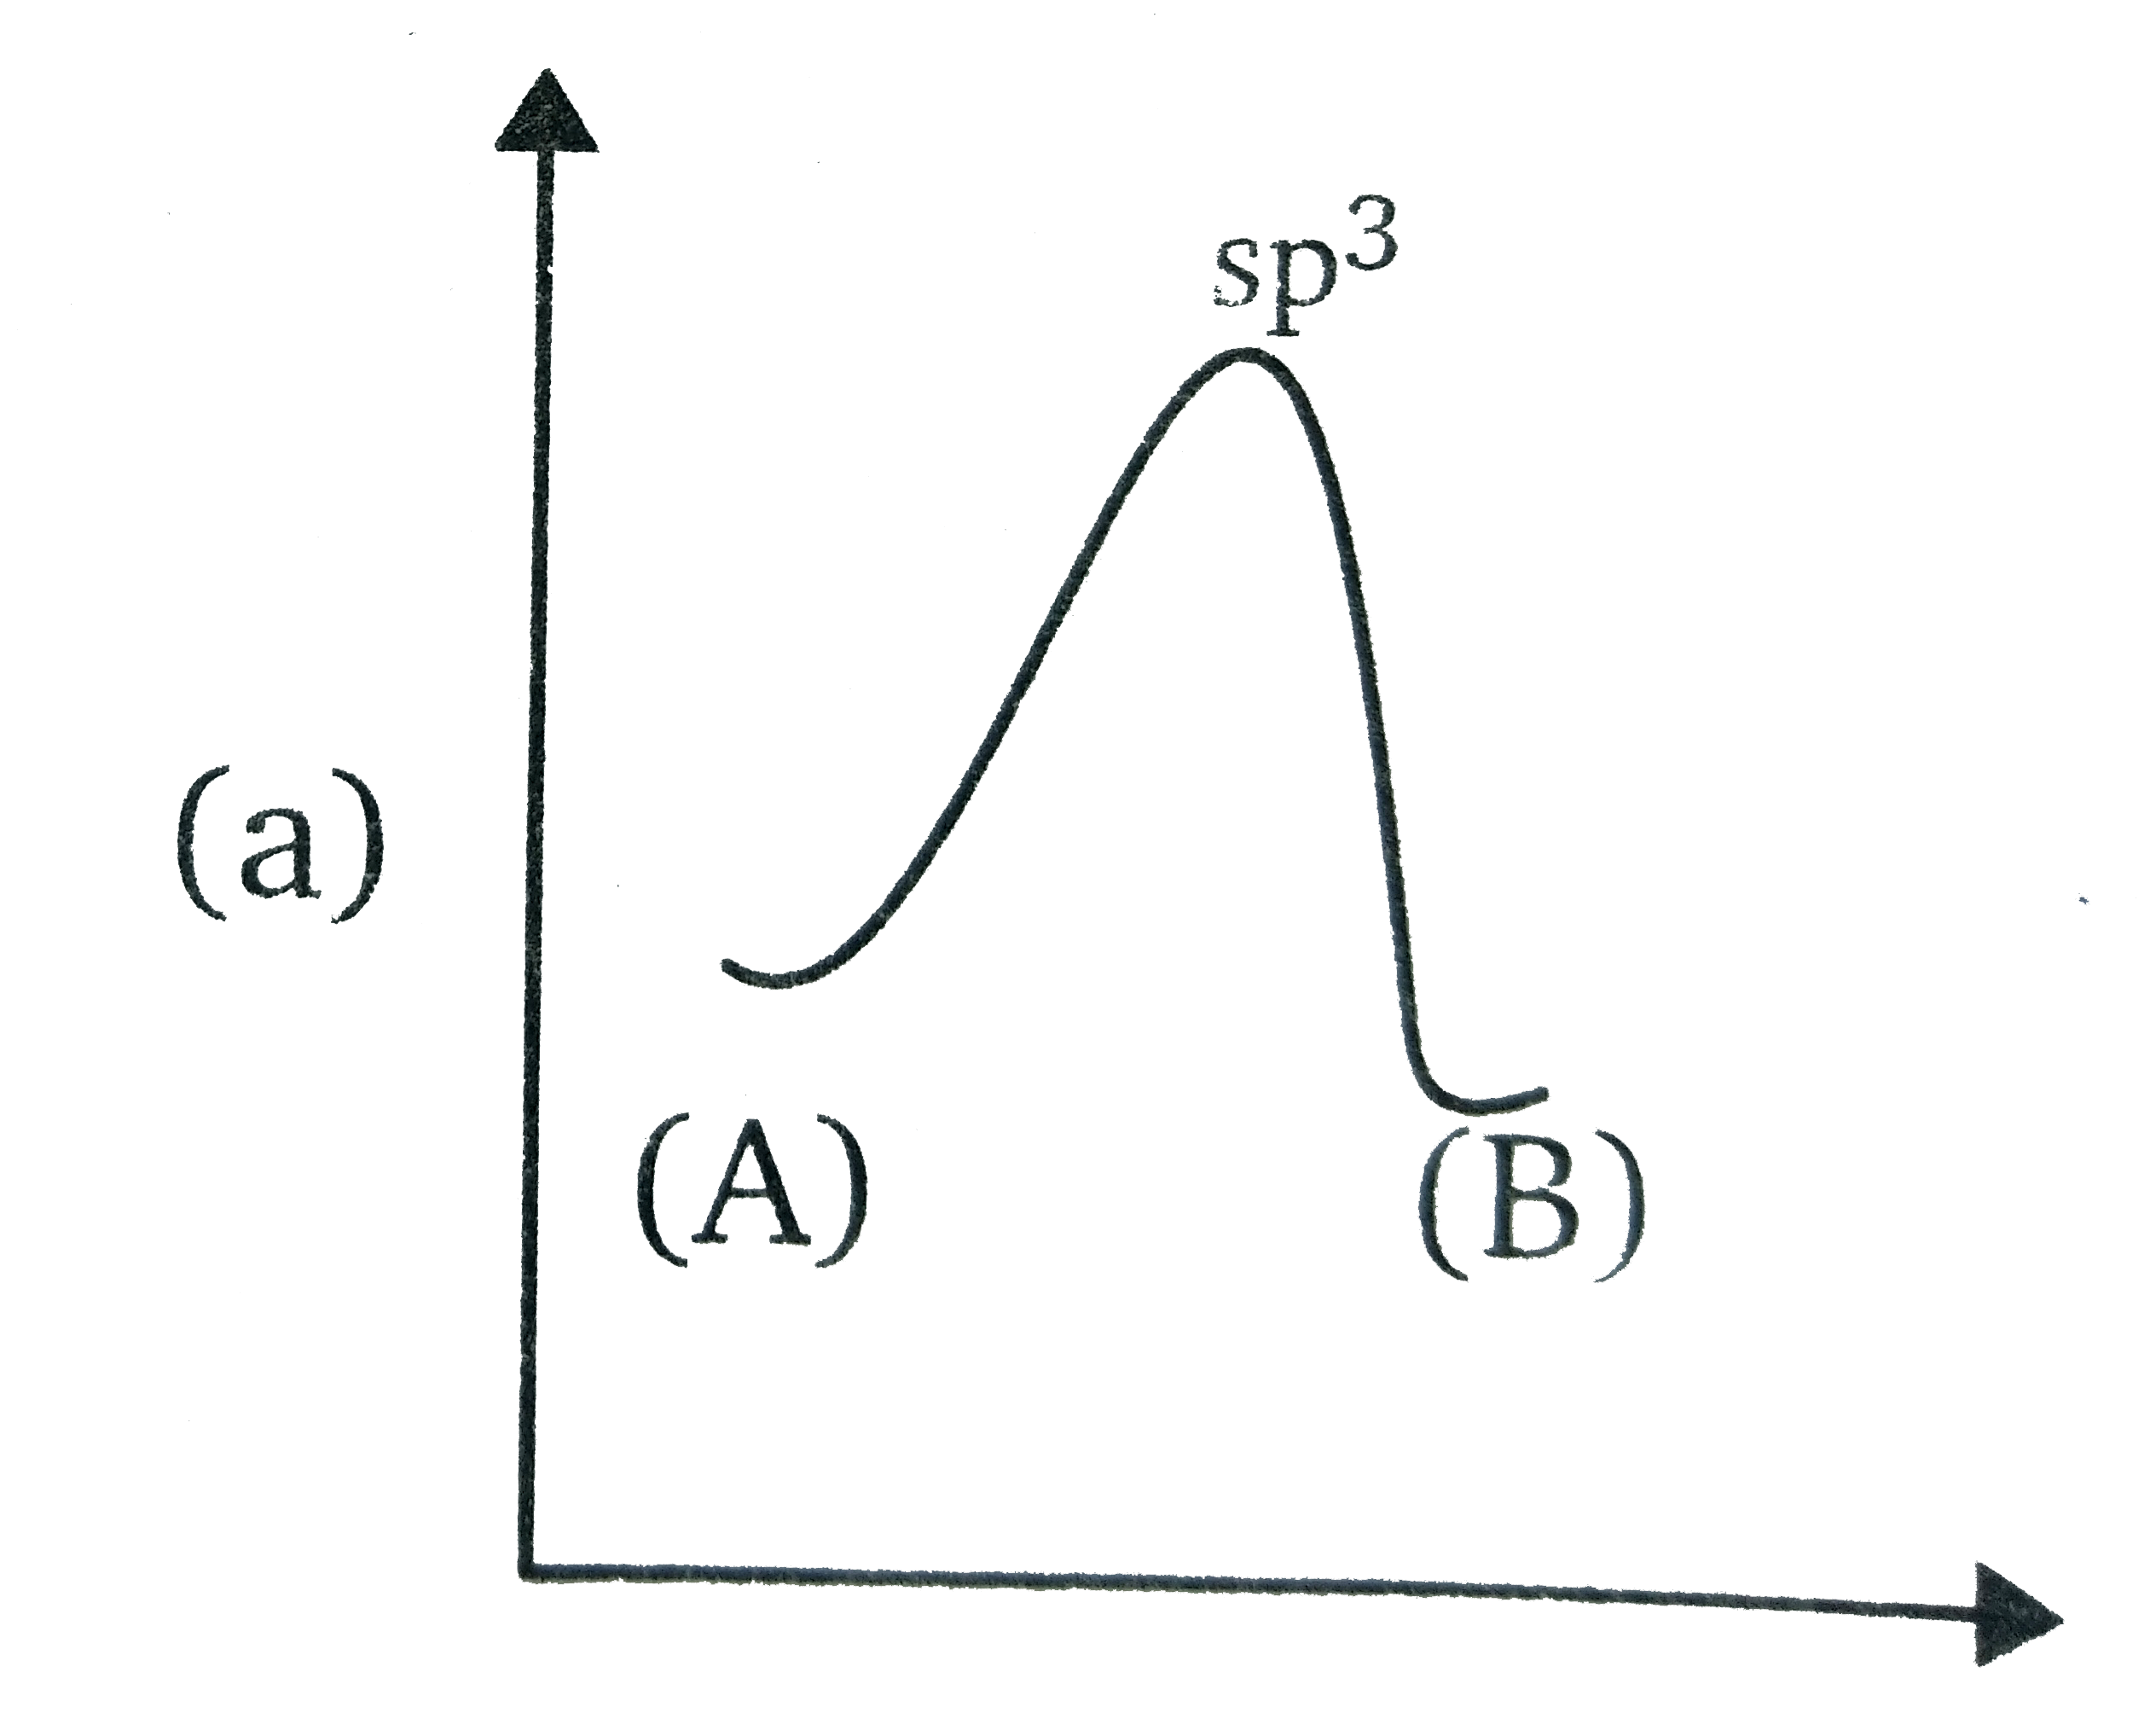 B
B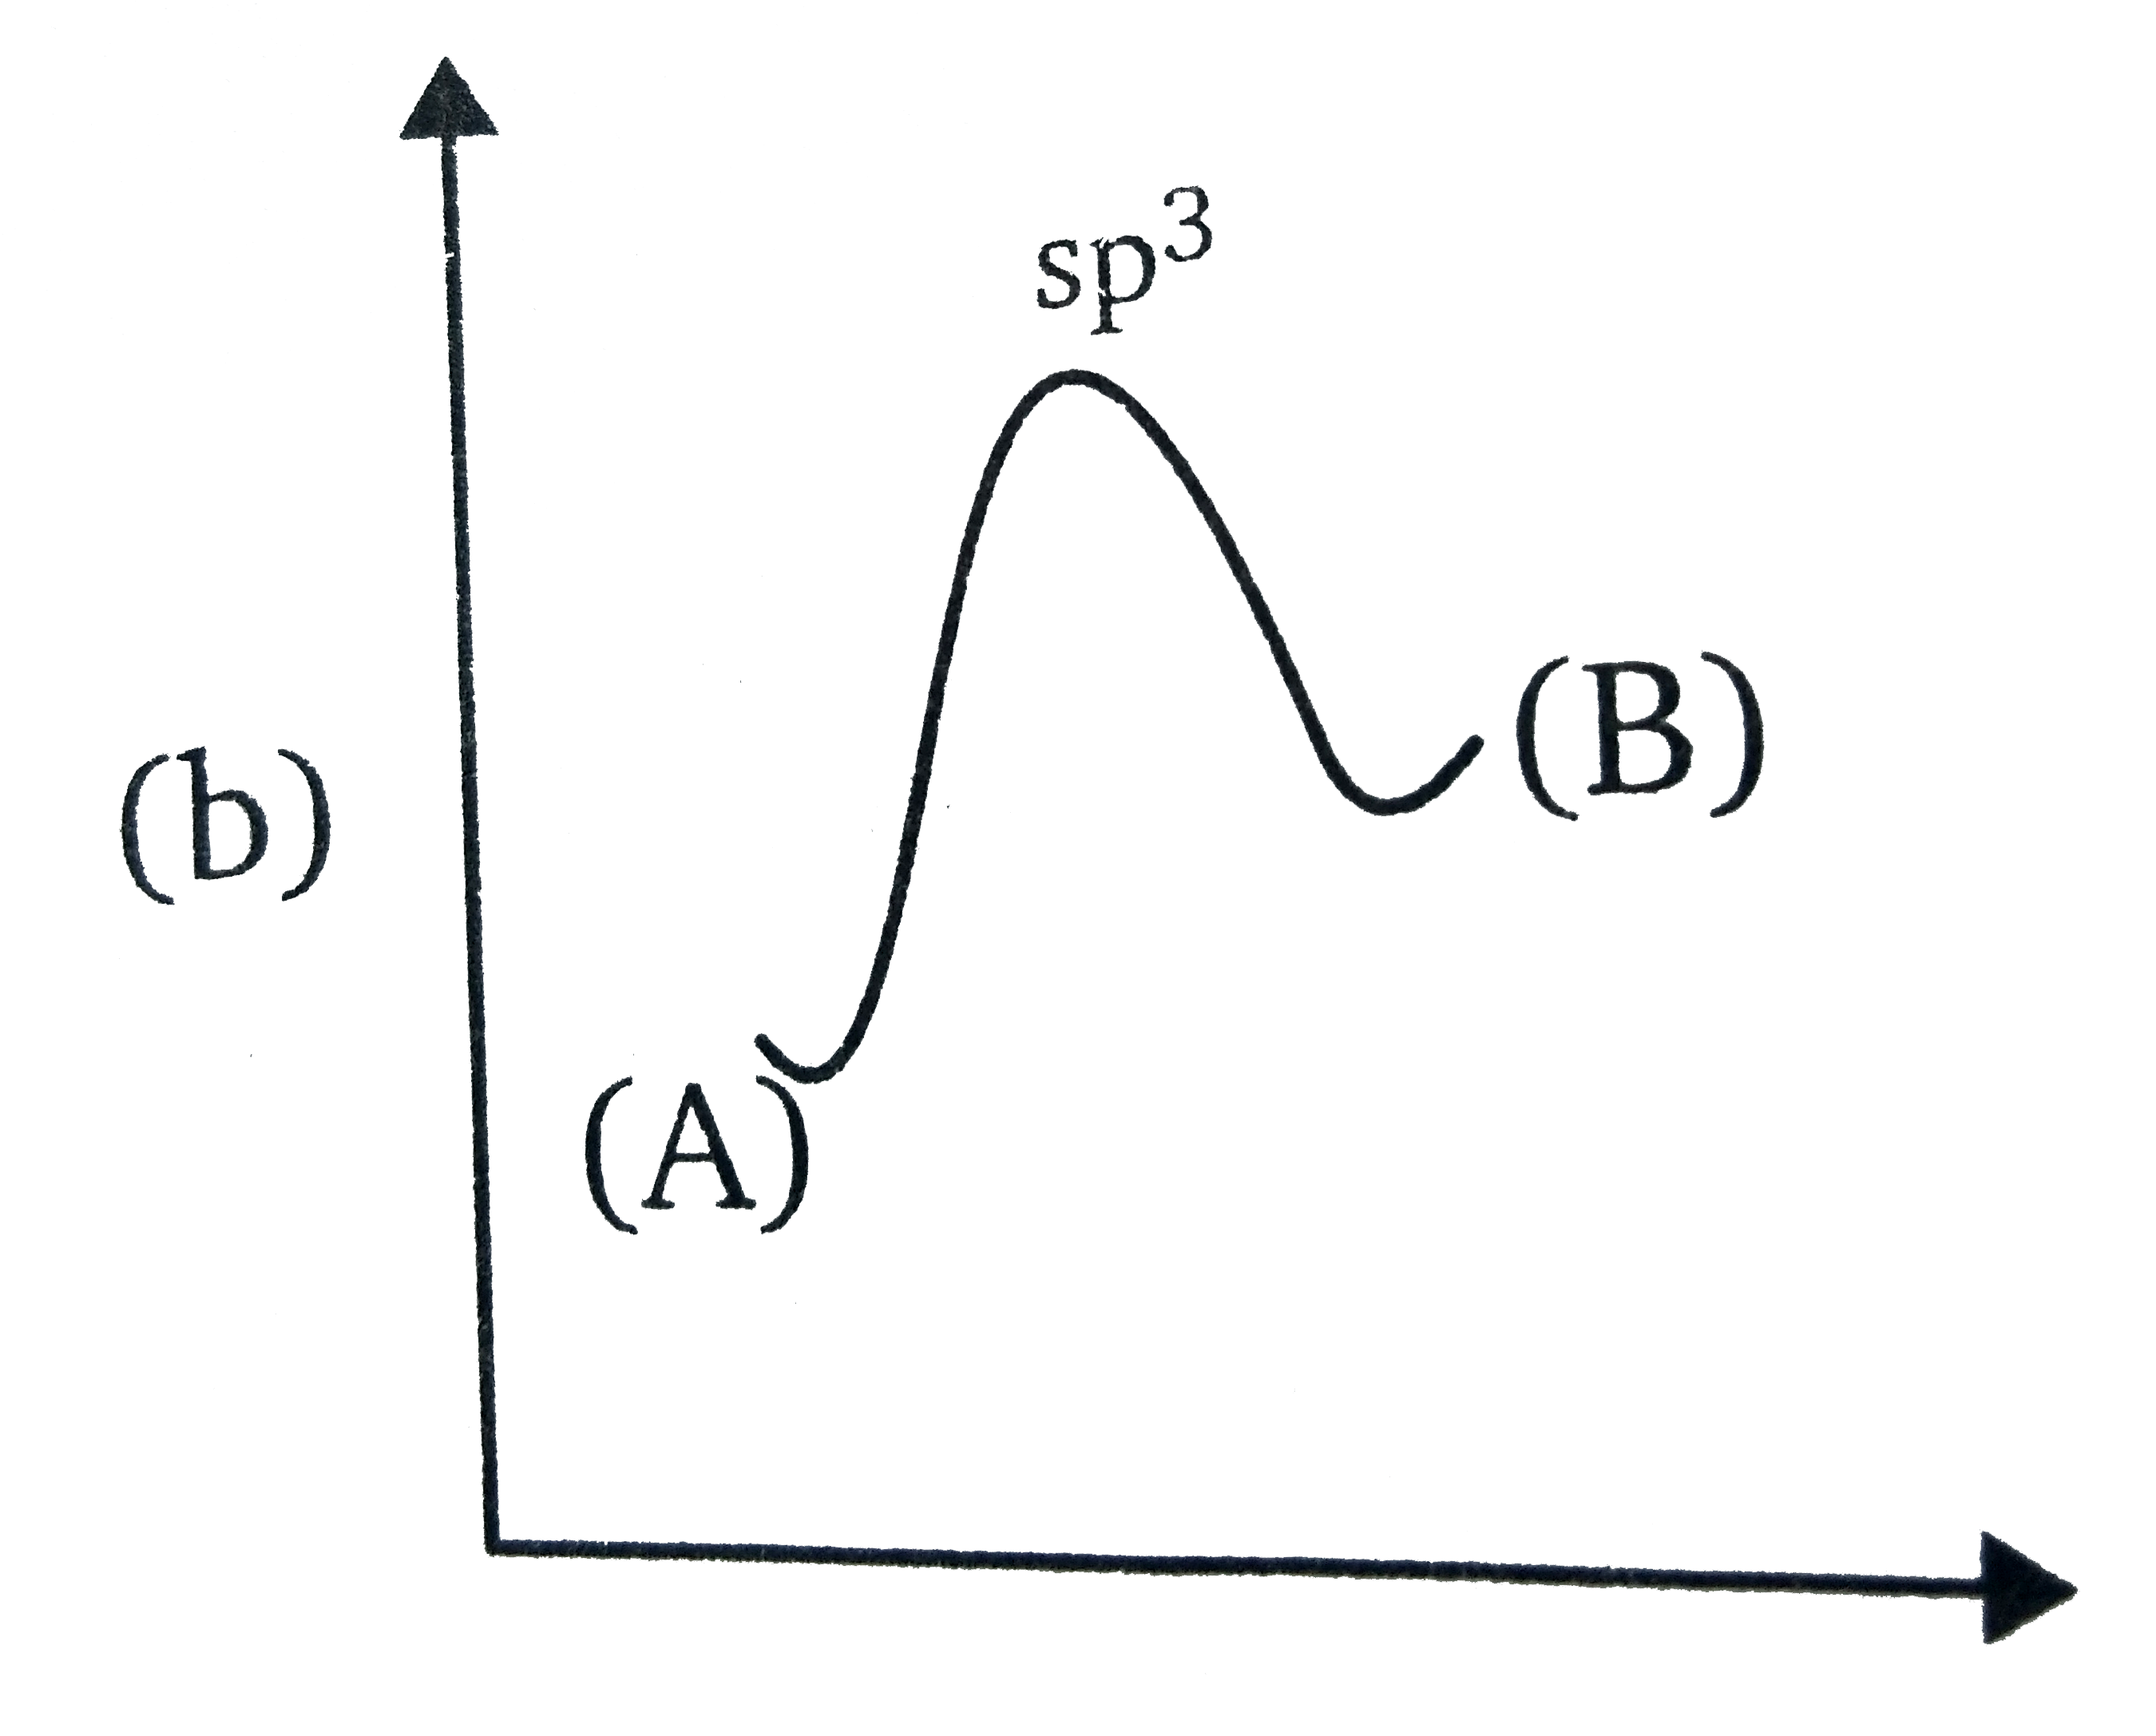 C
C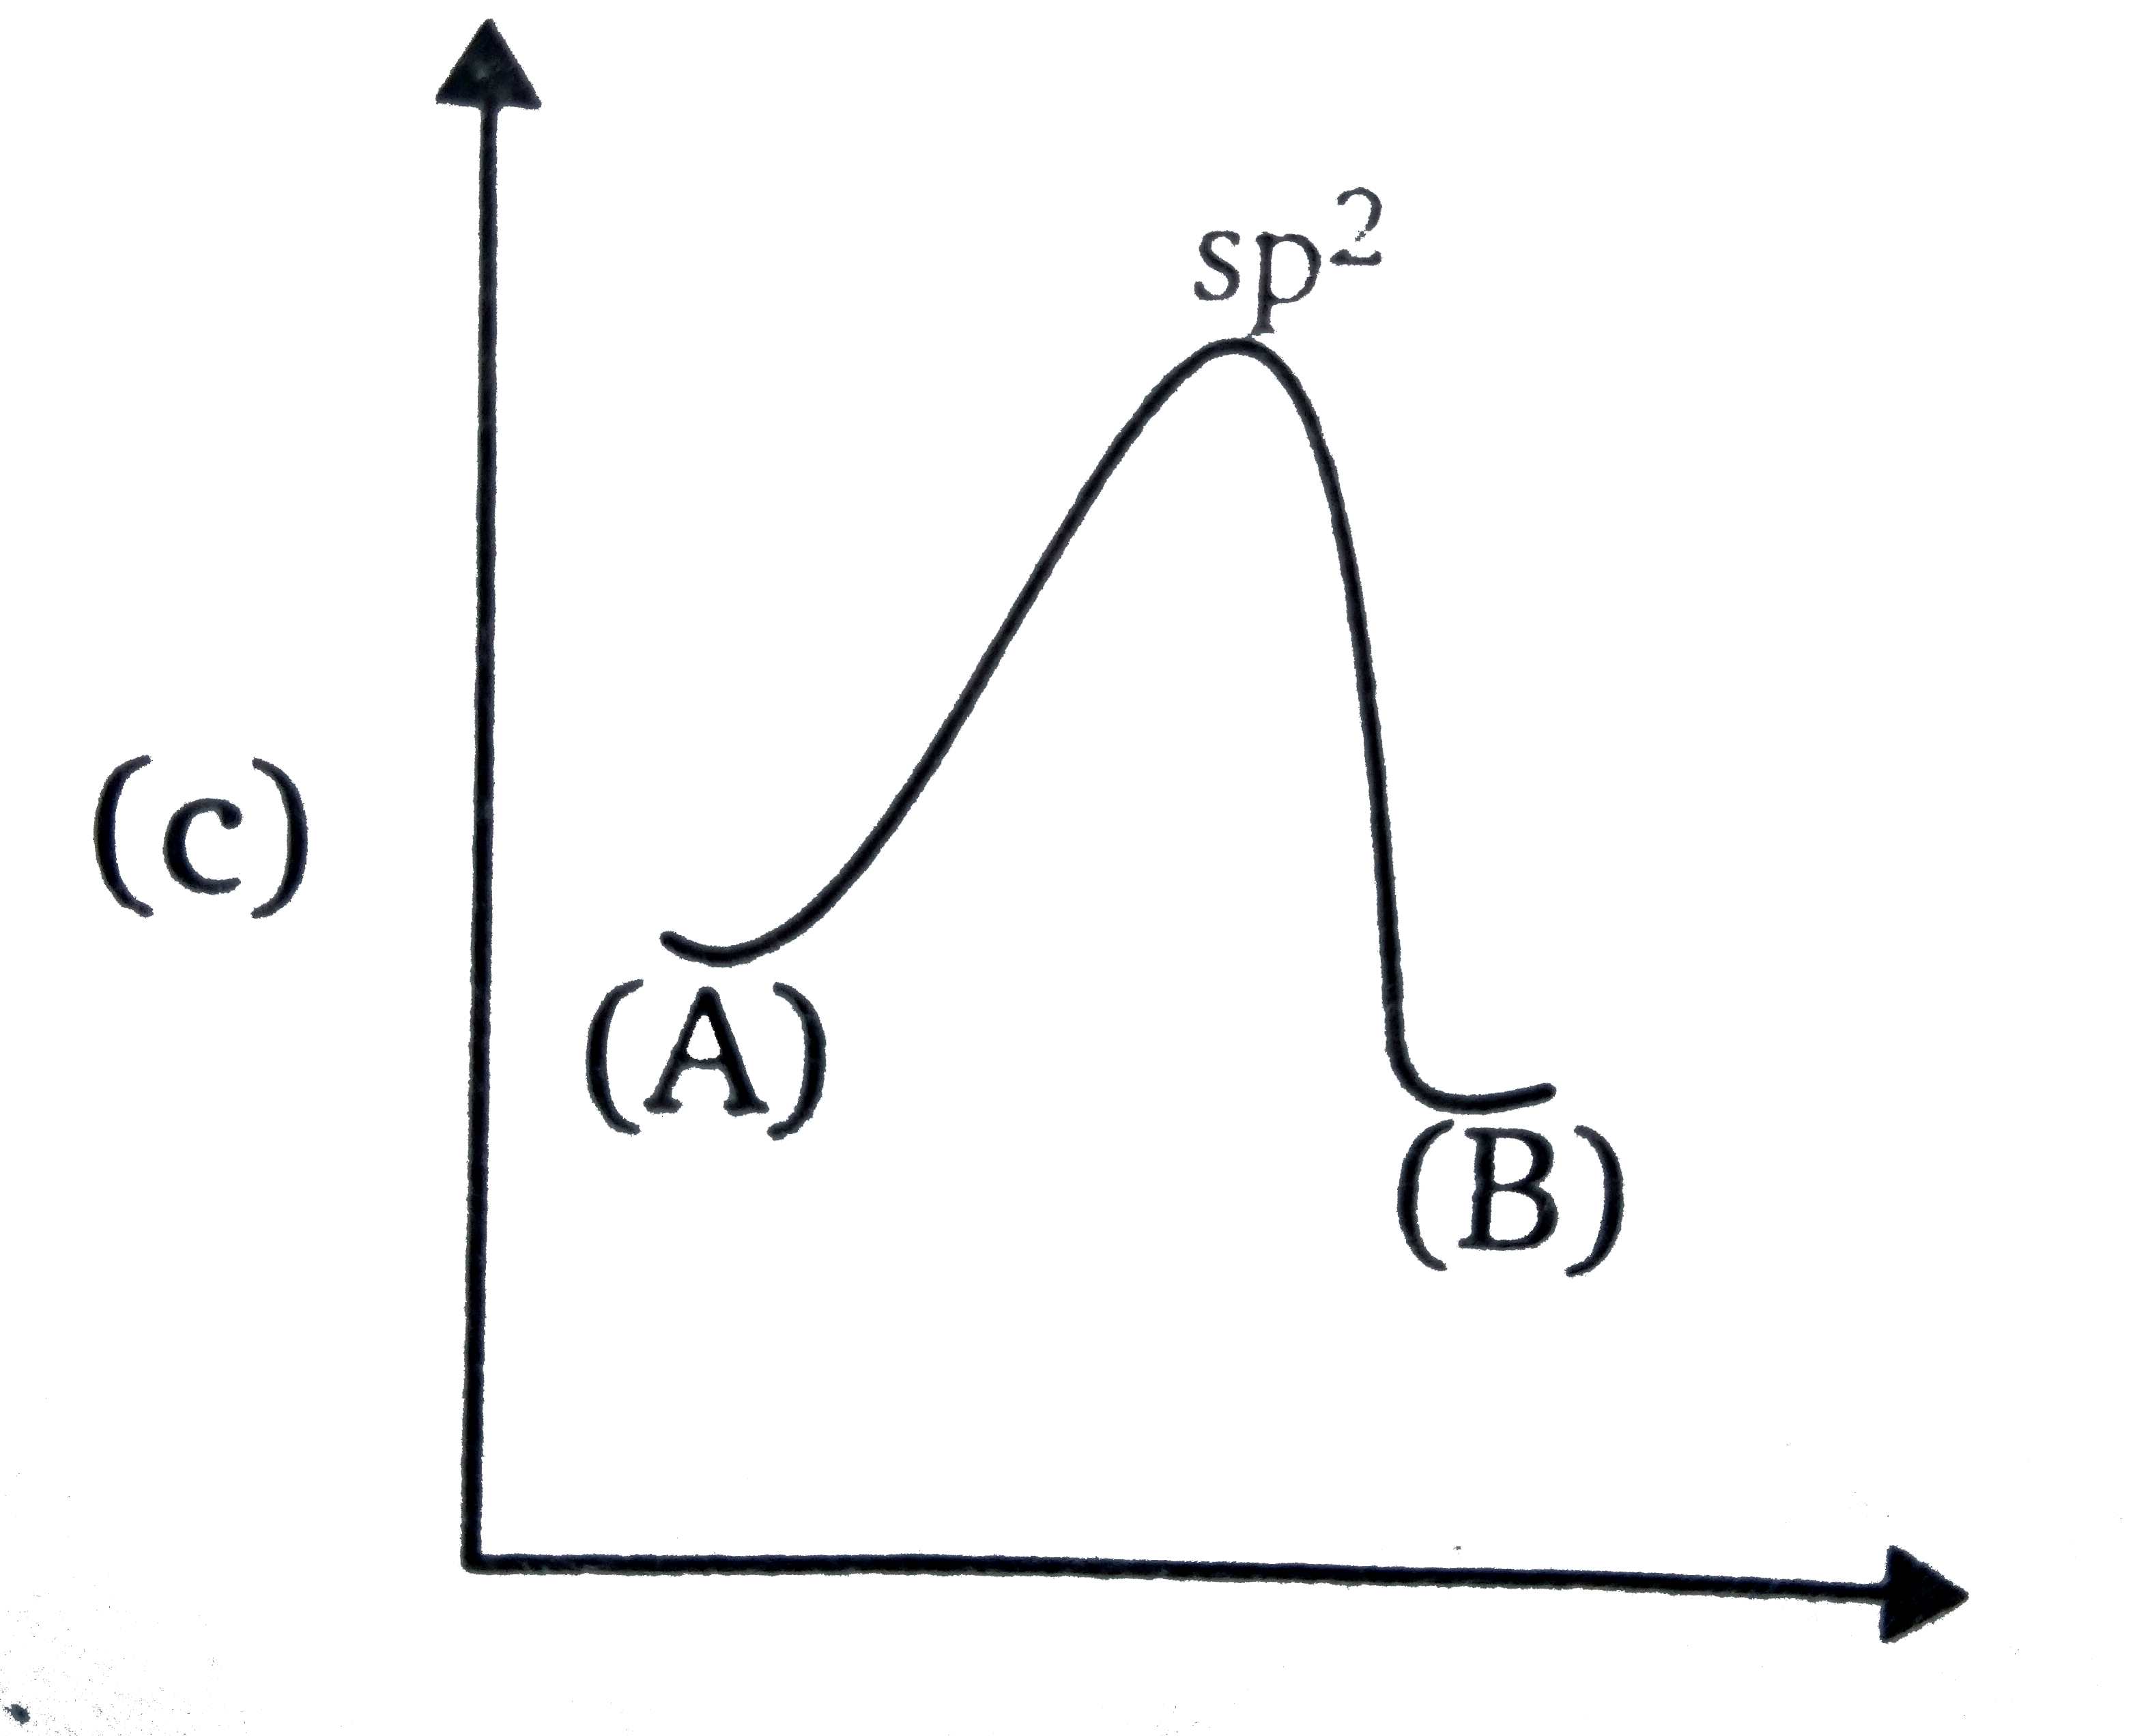 D
D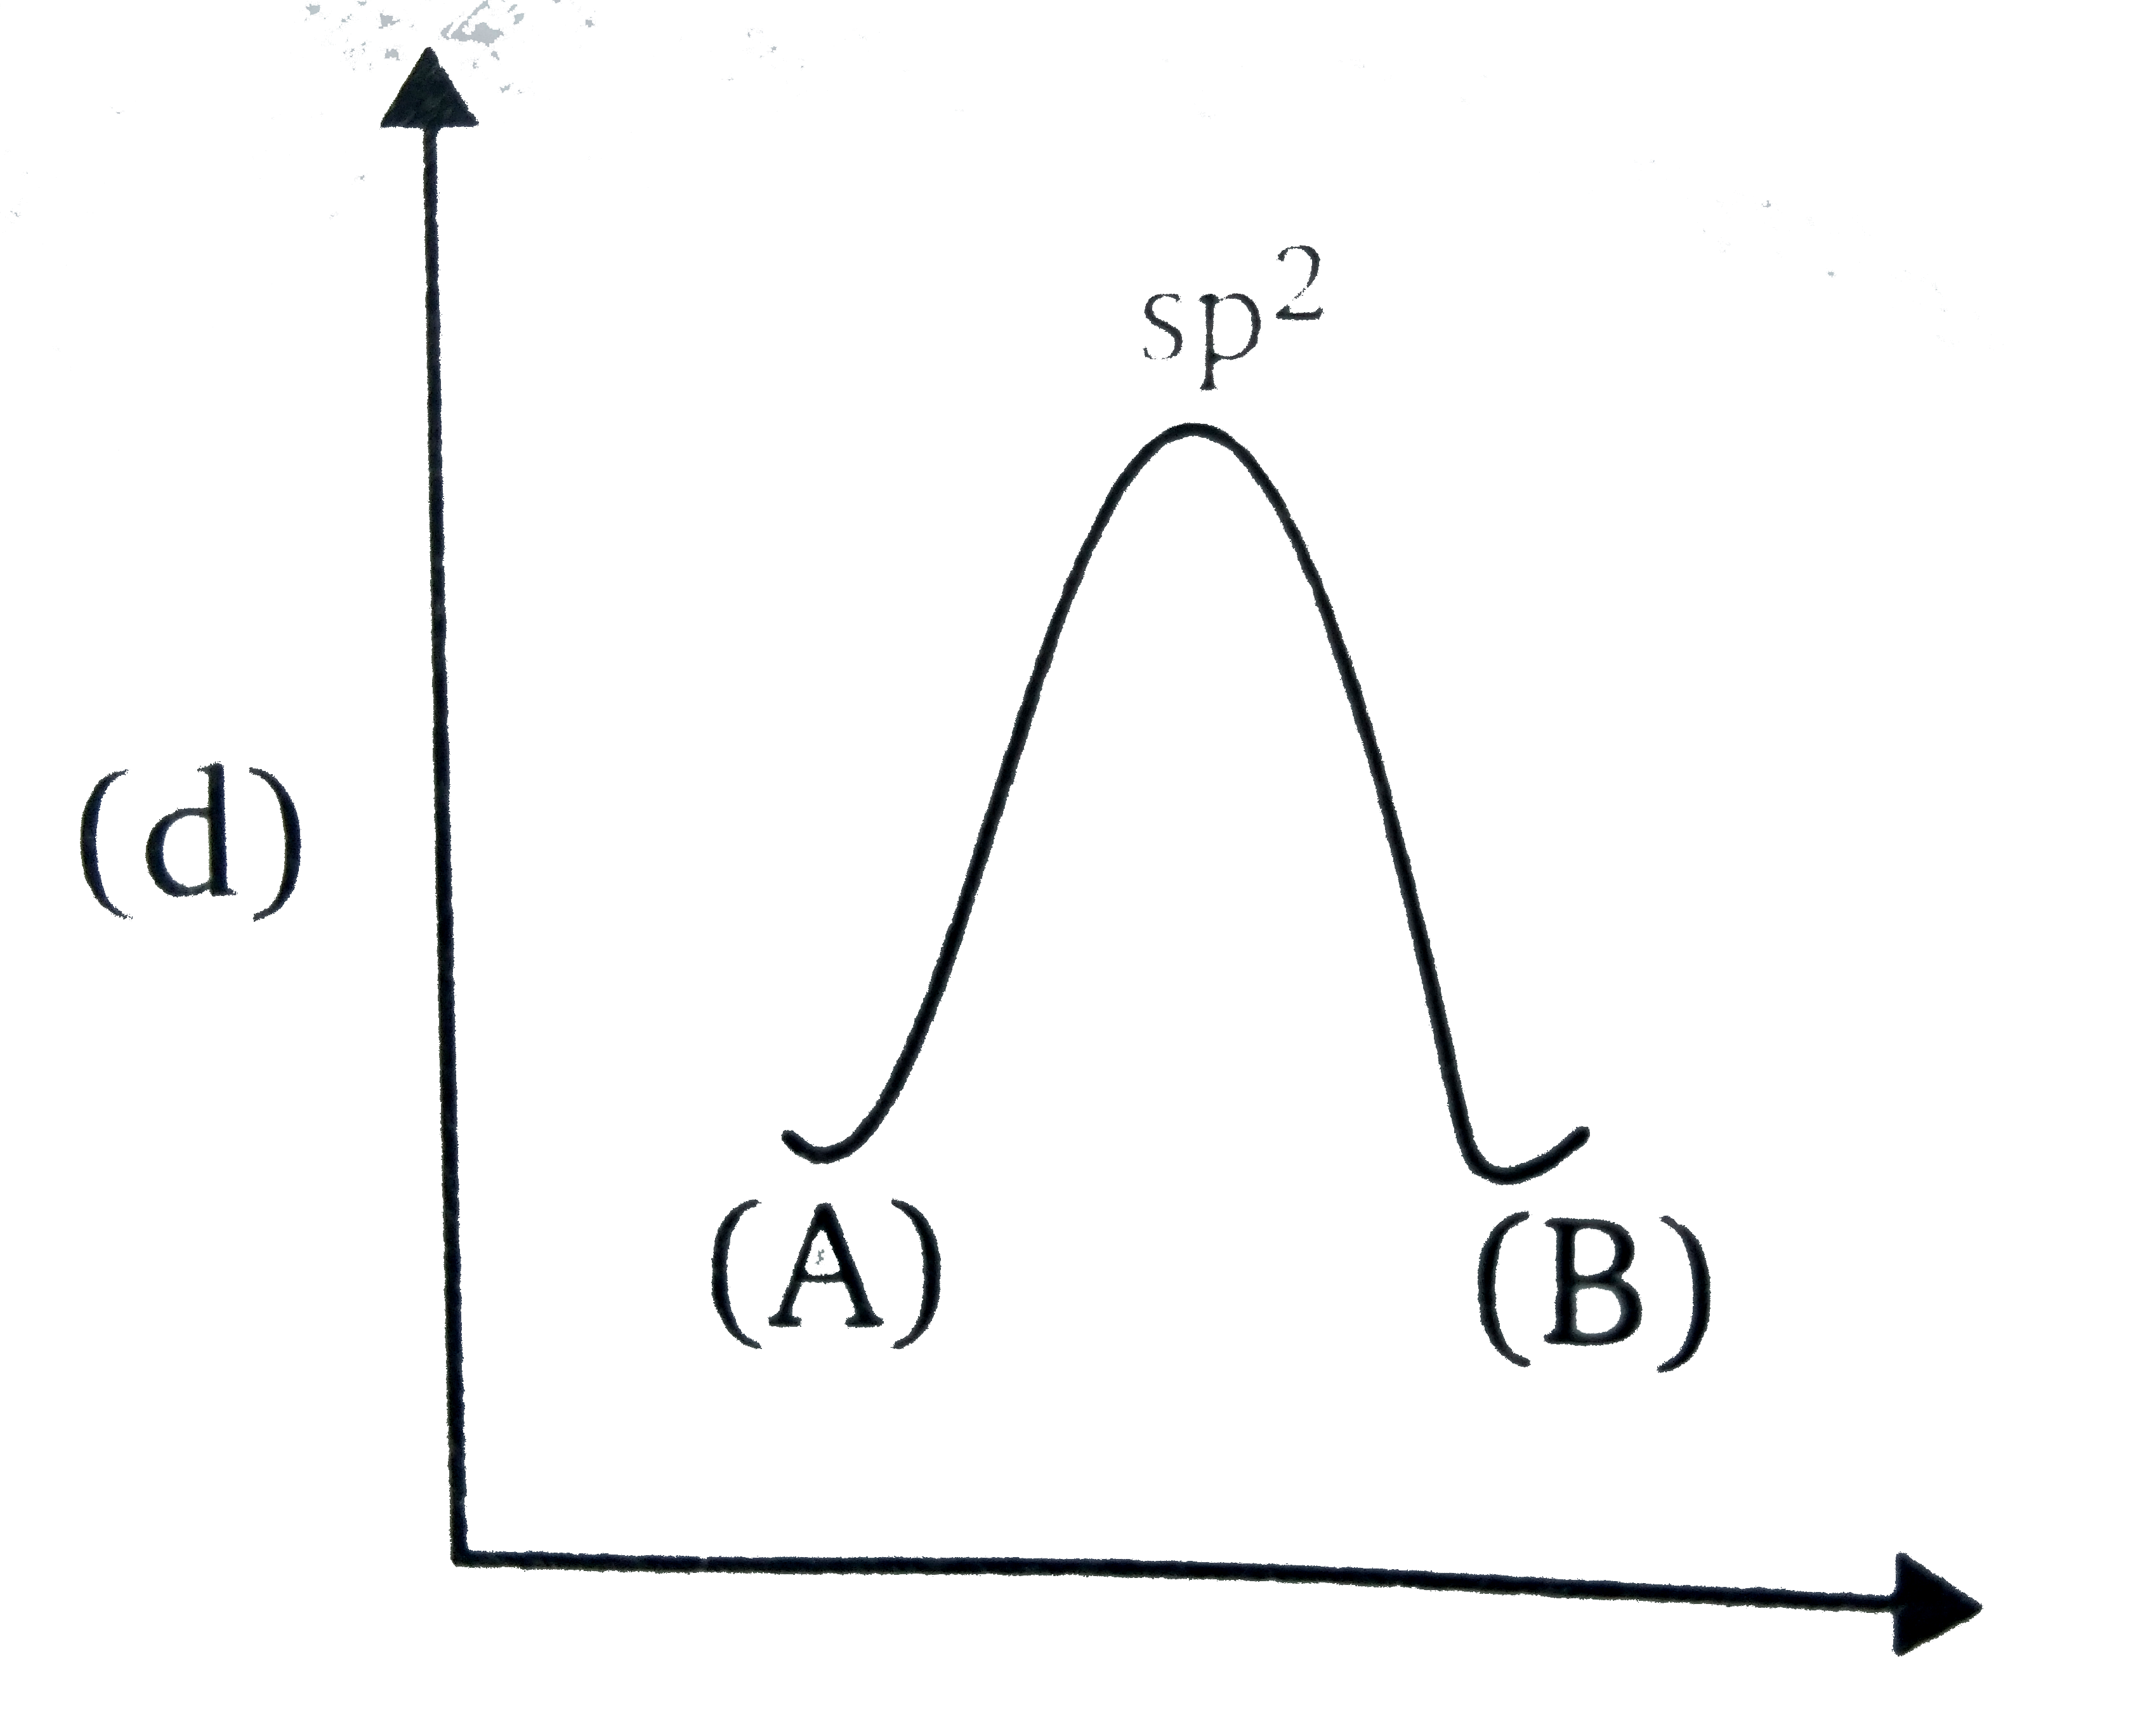
Study Of Energy Flow Diagram
View SolutionEnergies Of Orbitals And Energy Level Diagram
View SolutionFrom Energy Band Diagram
View SolutionEnergy profile for the following reaction will be
NH3+CH3−I→CH3−+NH3View SolutionAdjoining diagram, represents the energy profile for the reaction : A+B→C+D. What is the valye of the activation energy for the reaction ? C+D→A+B ?
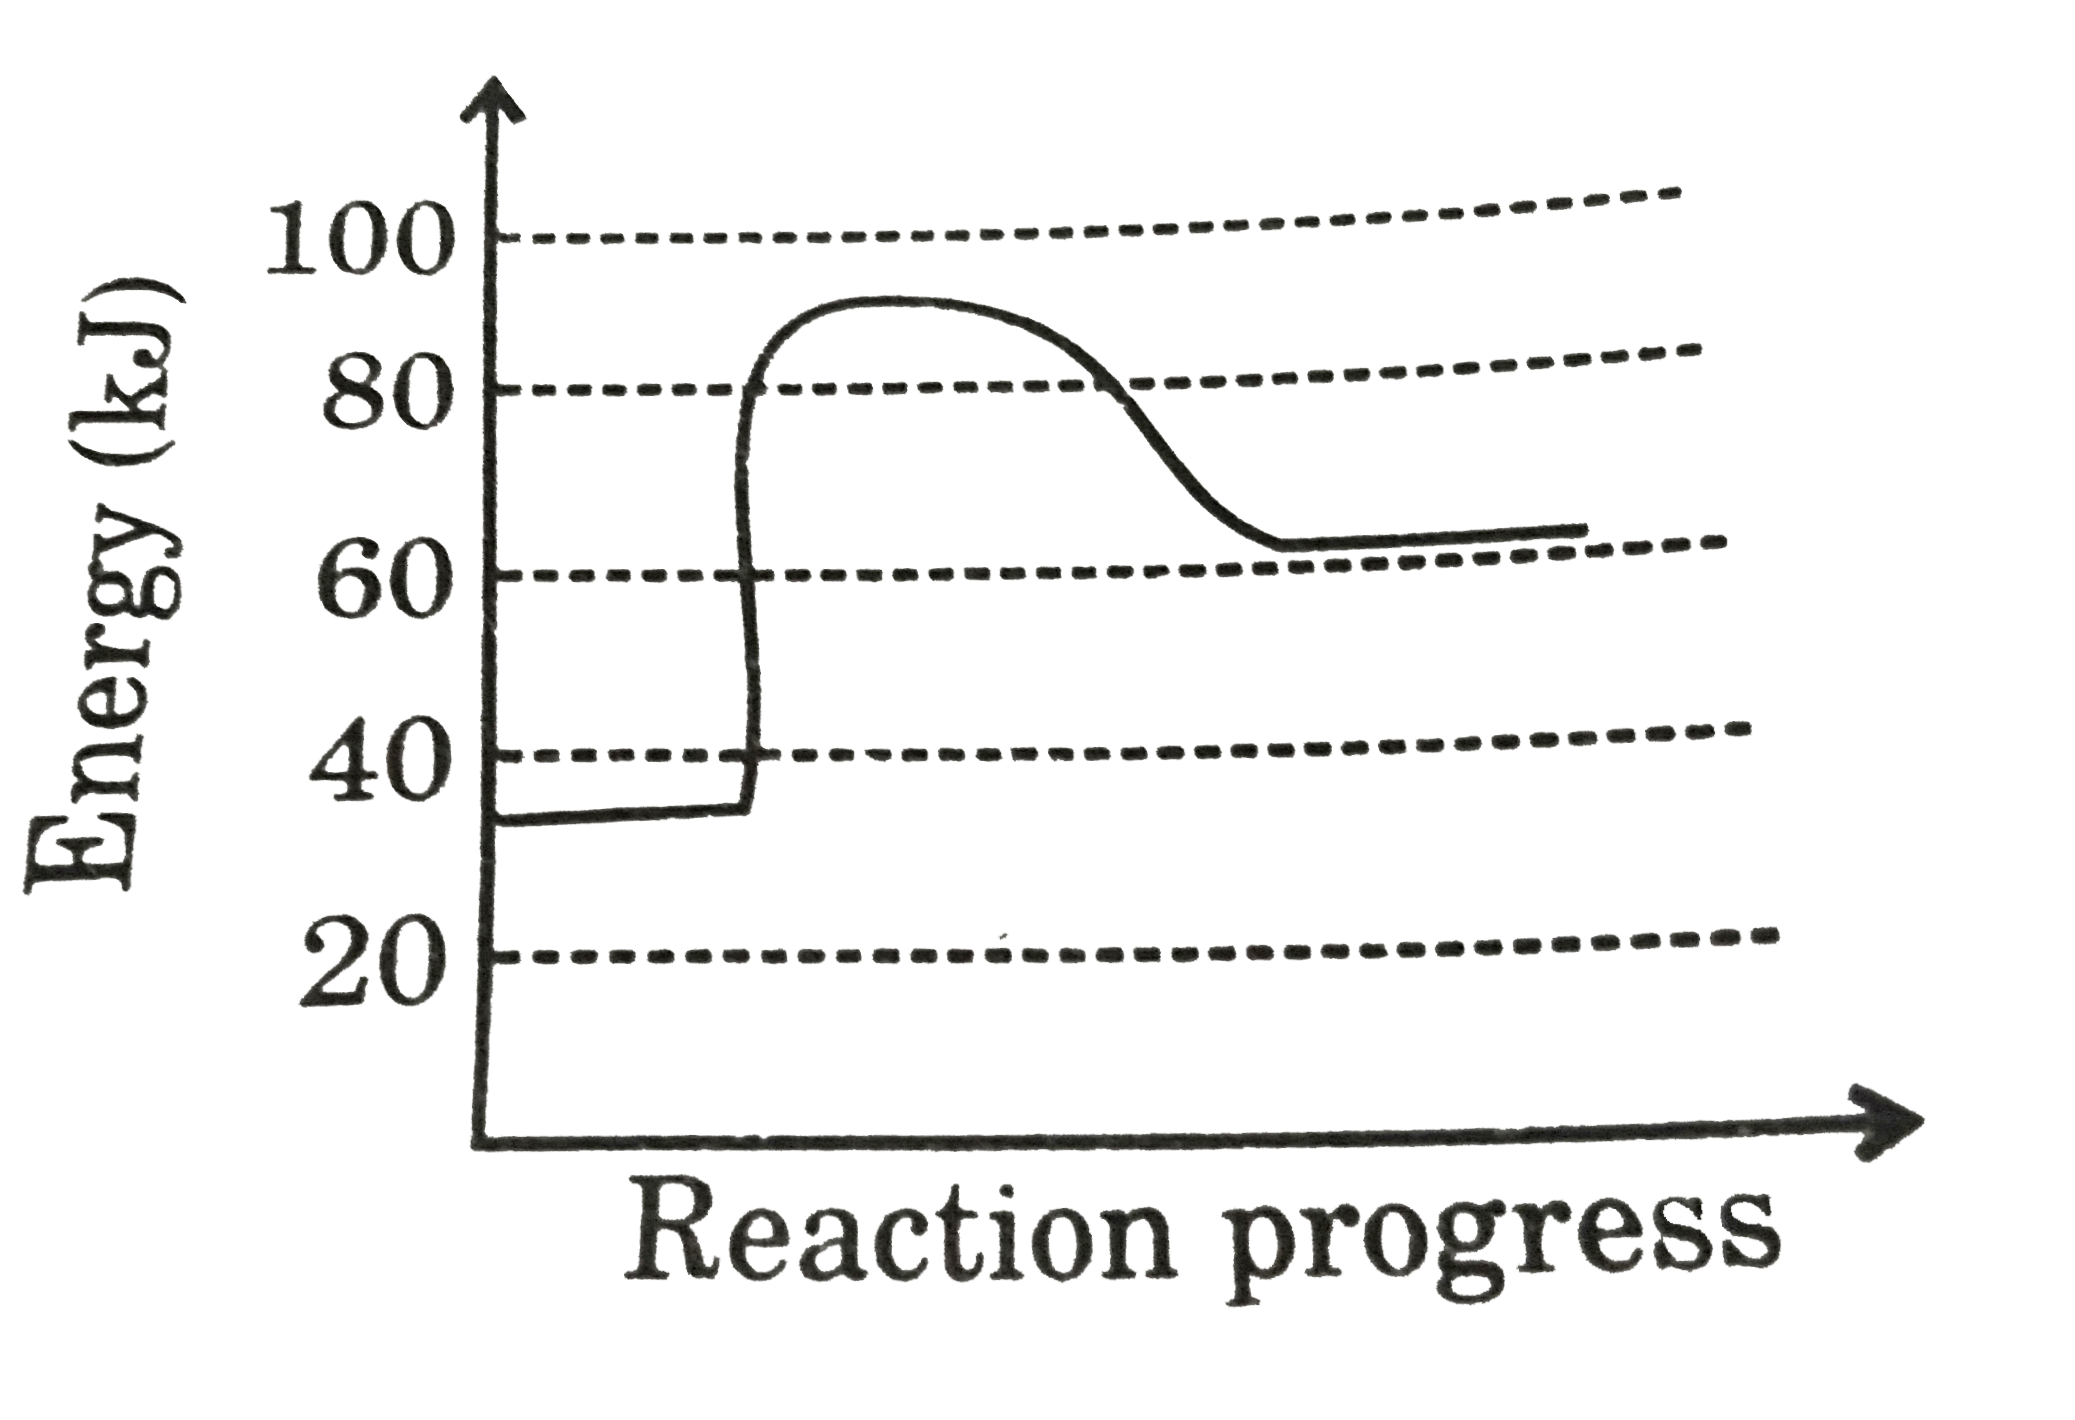 View Solution

