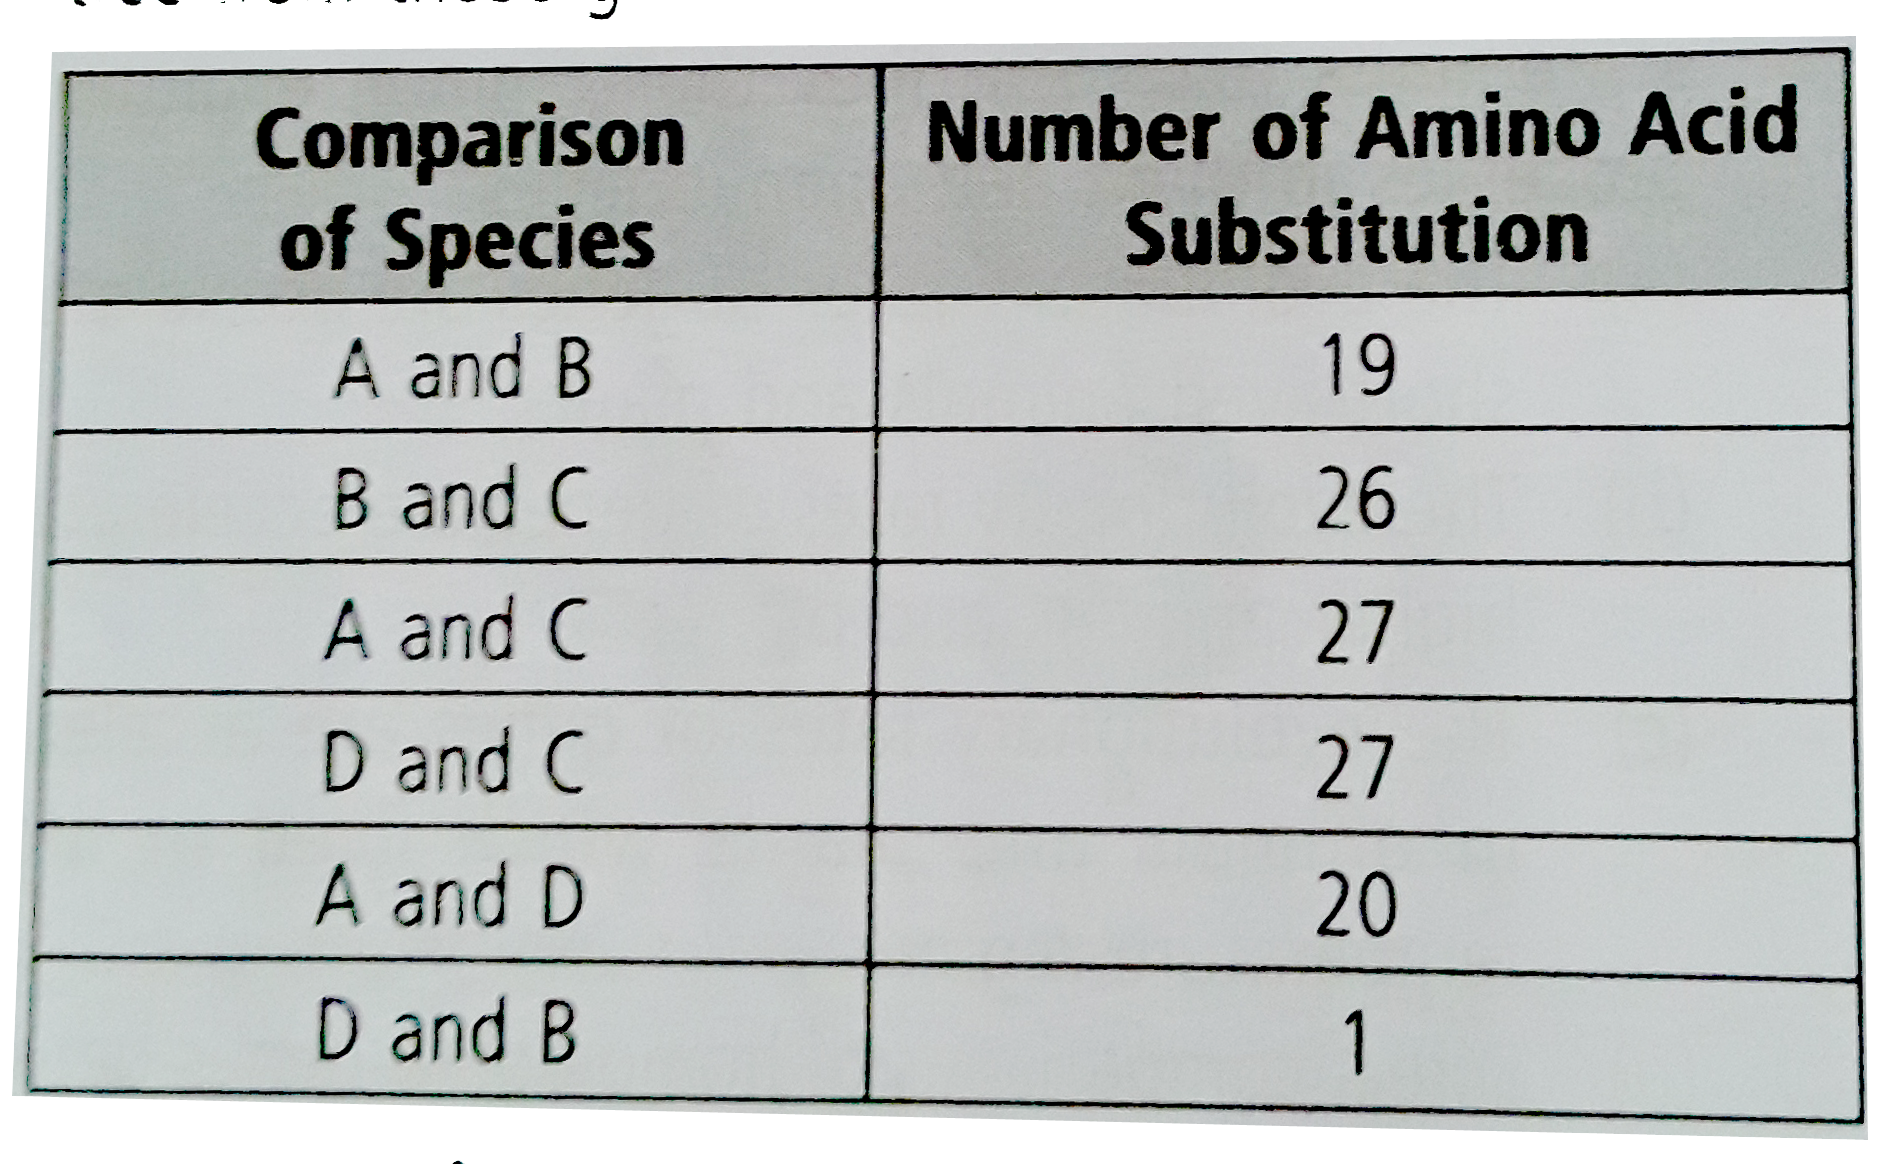
Following table shows data on amino acid substitution in the α chain of haemoglobin in four different mammalian species A,B,C and D on the basis of the data shown in the table. Choose the most appropriate evolutionary tree from those given below.


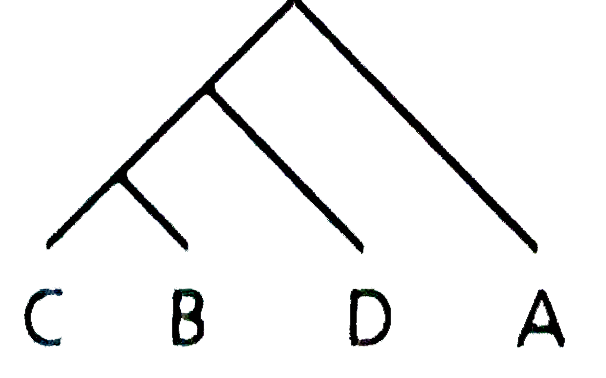
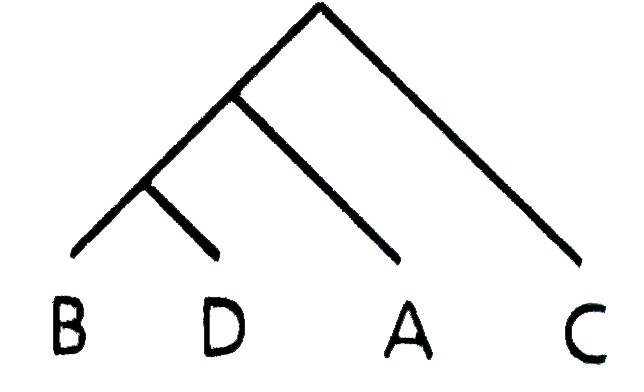
The correct Answer is:D
The molecular clock is the concept that during evolution the number of subsitutions in the nucleotides or nucleic acids (DNA or RNA) and hence in the protein encoded by nucleic acid, is proportional to time. The molecular clock uses fossil constraints and rates of molecular change to deduce the time in geologicv history when two species or other taxa diverged. It is used to estimate the time of occurrence of evetns called speciationor radiation.
Topper's Solved these Questions
Similar Questions
Given below is the representation of amino acid composition of the relevant translated portion of β-chain of haemoglobin, related to the shape of human red blood cells.
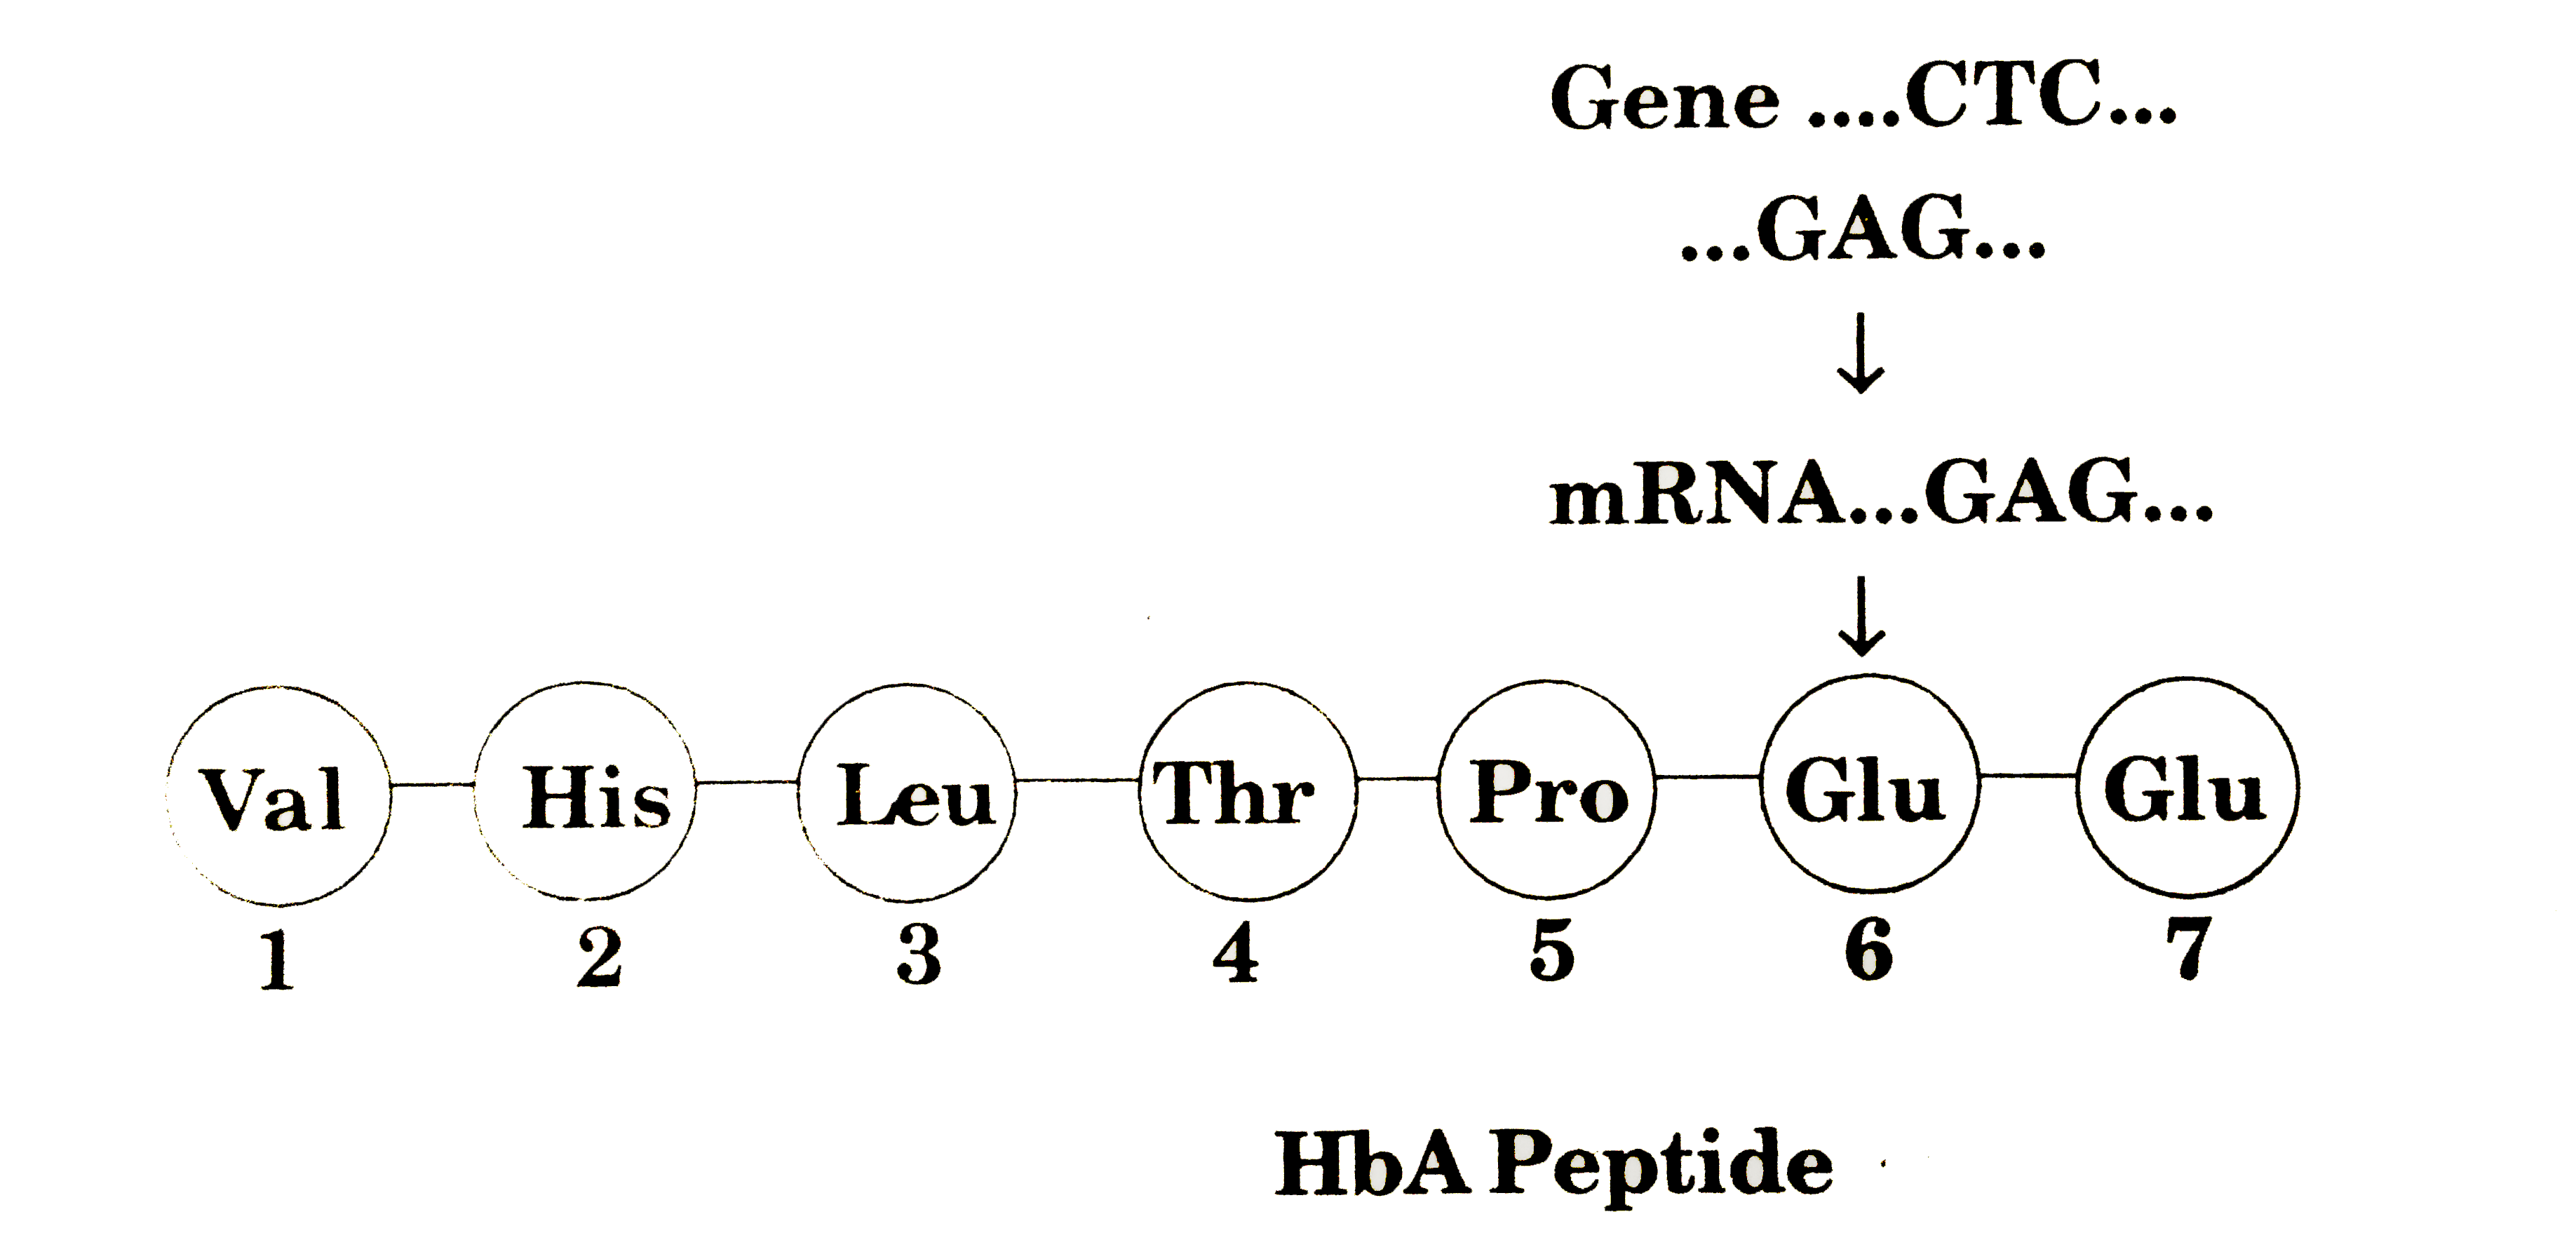
(a) Is this representation indicating a normal human or a sufferer from certain related genetic disease? Give reason in support of your answer.
(b) What difference would be noticed in the phenotype of the normal and the sufferer related to this gene?
(c) Who are likely to suffer more from the defect related to the gene represented the males, the females or both males and females equally? And why?View SolutionGiven below is the representation of amino acid composition of the relevant translated portion of β-chain of haemoglobin, related to the shape of human red blood cells.

(a) Is this representation indicating a normal human or a sufferer from certain related genetic disease? Give reason in support of your answer.
(b) What difference would be noticed in the phenotype of the normal and the sufferer related to this gene?
(c) Who are likely to suffer more from the defect related to the gene represented the males, the females or both males and females equally? And why?View Solution
Knowledge Check
- Question 1 - Select One
he flu shot for a flu seaons is created four strains of the flu virus, named Strain A,B,C and D, respectively. Medical researchers use the following data to determine the effectiveness of the vacine over the flu season. Table 1 shows the effectiveness of the vaccine against each of these strains individually. The graph below the table shows the prevalence of each of these strains during each month of the flu season, represented as a percentage of the overall cases of flu that month.
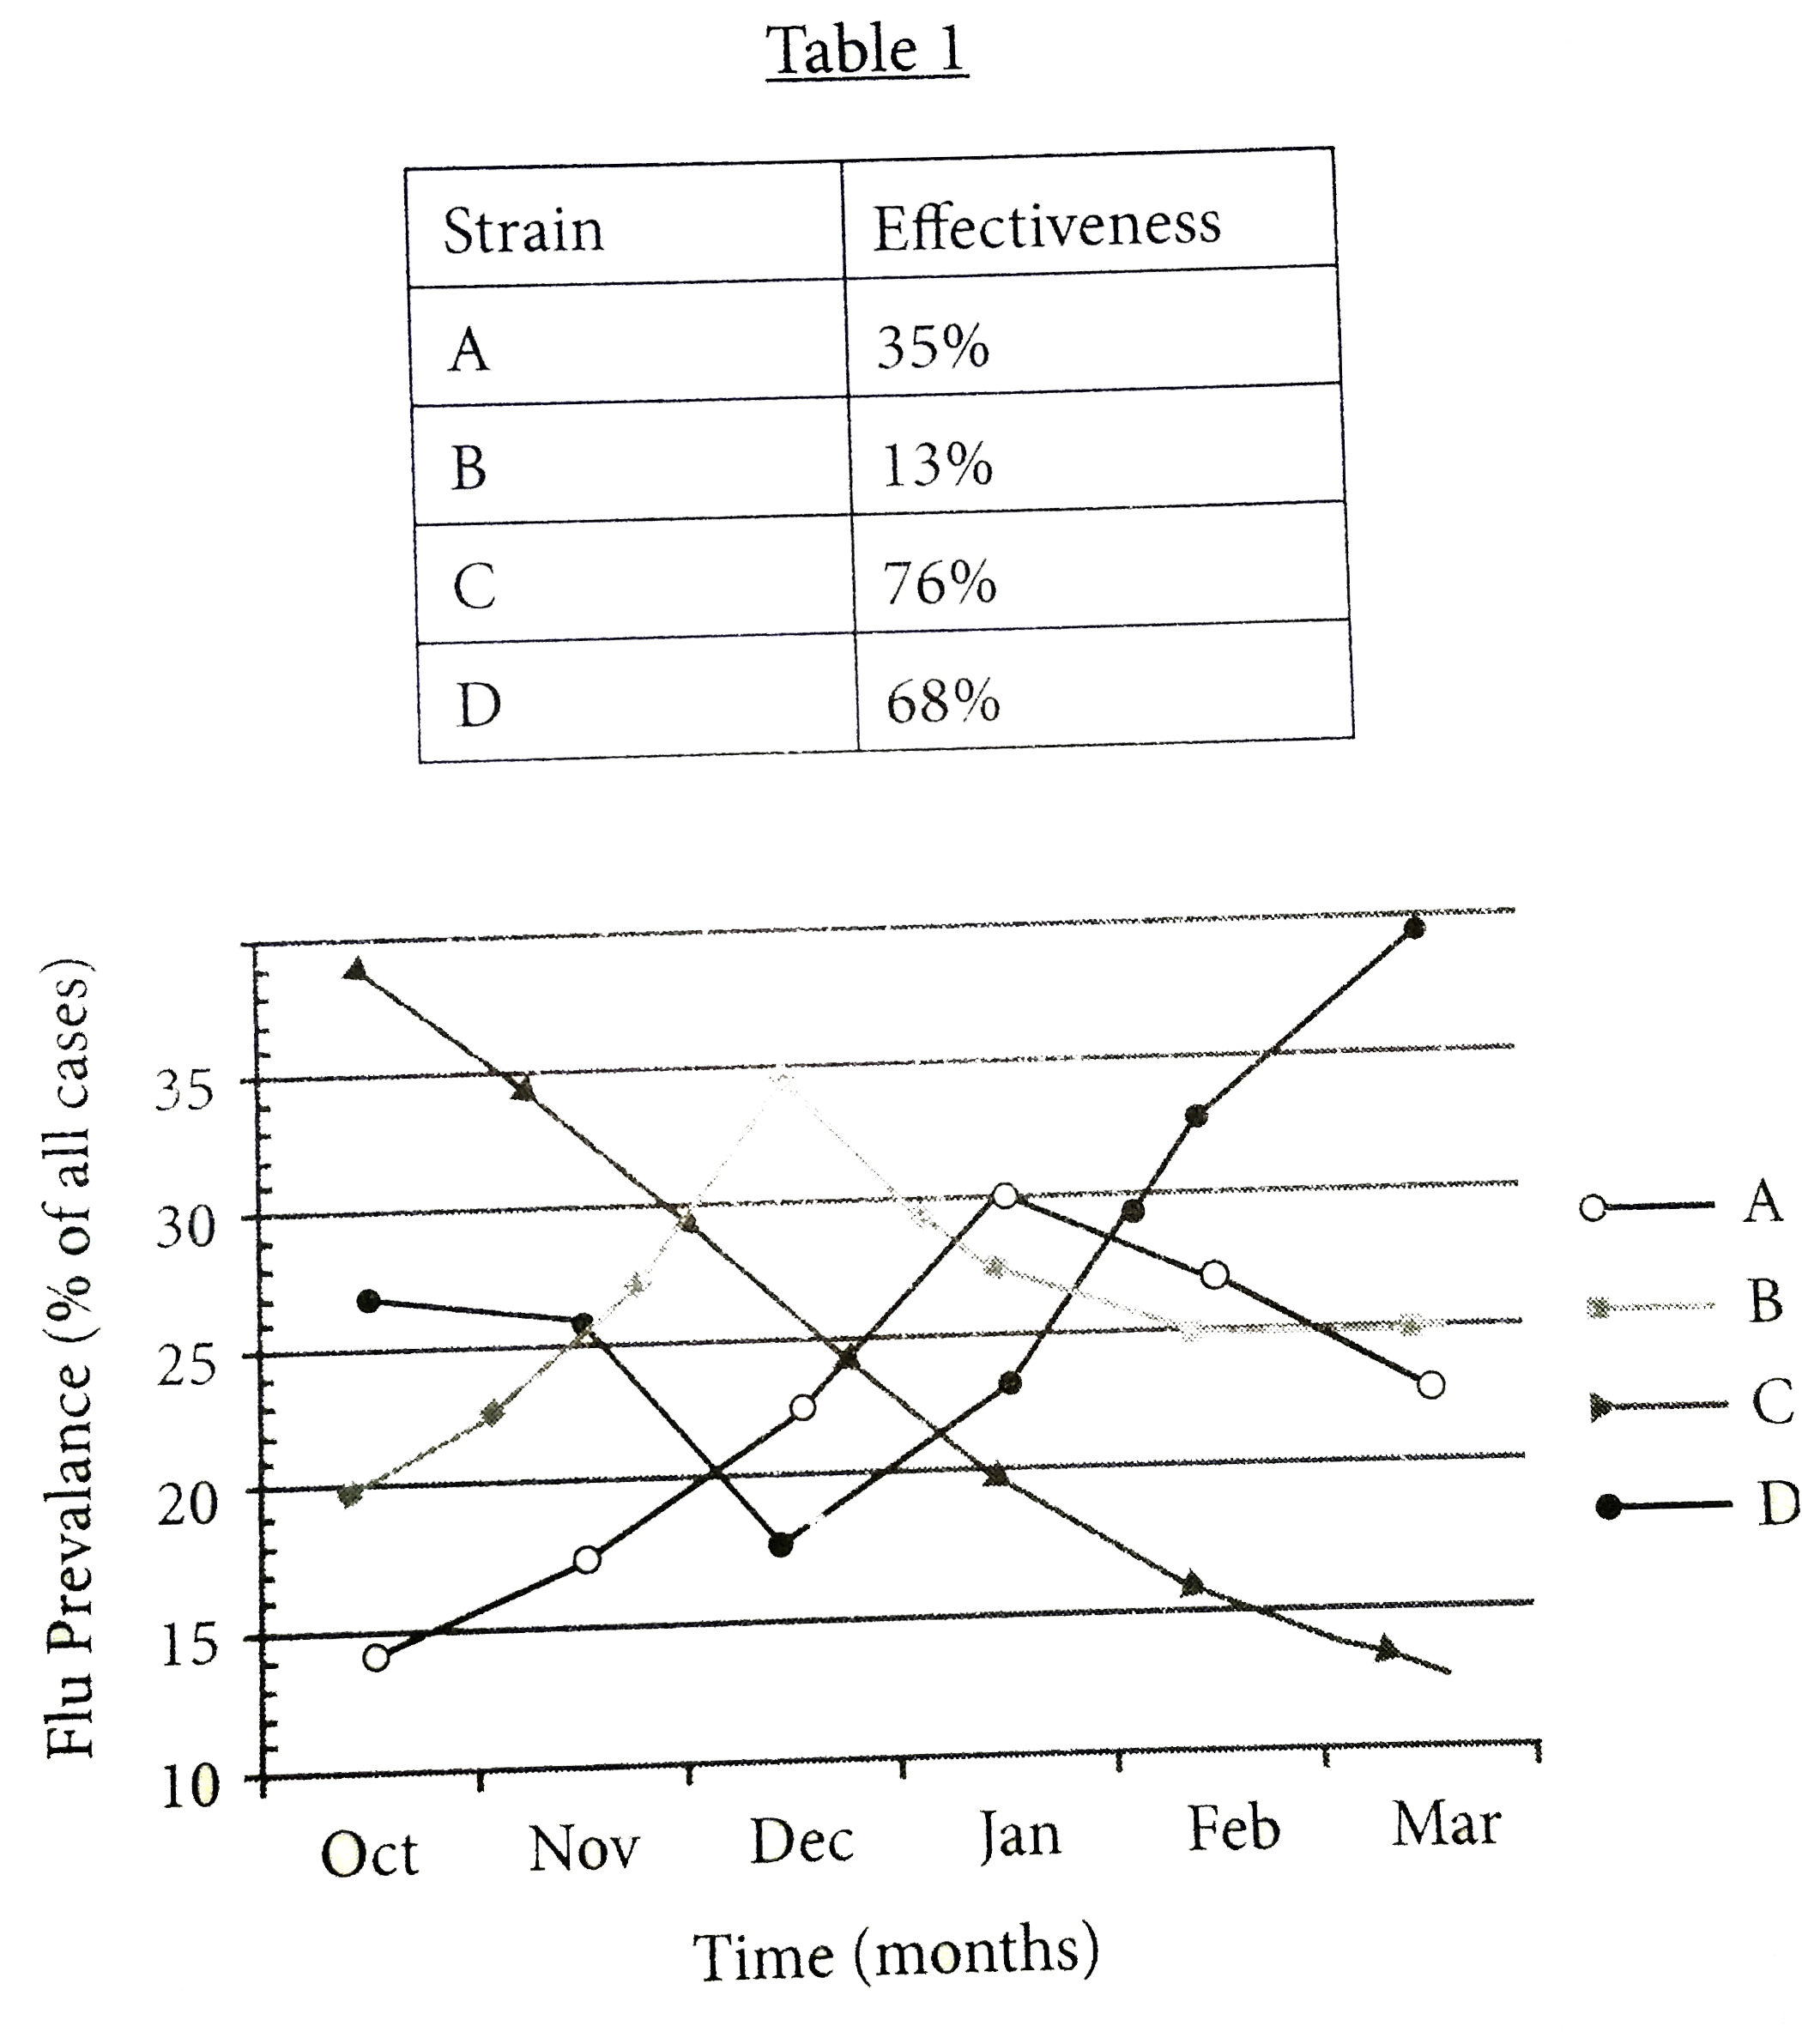
For the strain against which the flu shot was the most effective. approximately how effective was the shot overall during the month that strain was least prevalent?A0.13B0.2C0.27D0.48
The following is a scheme showing the fate of carbohydrates during digestion in the human alimentary canal. Identify the enzymes acting at stages indicated as A, B, C, and D. Choose the correct option from those given.
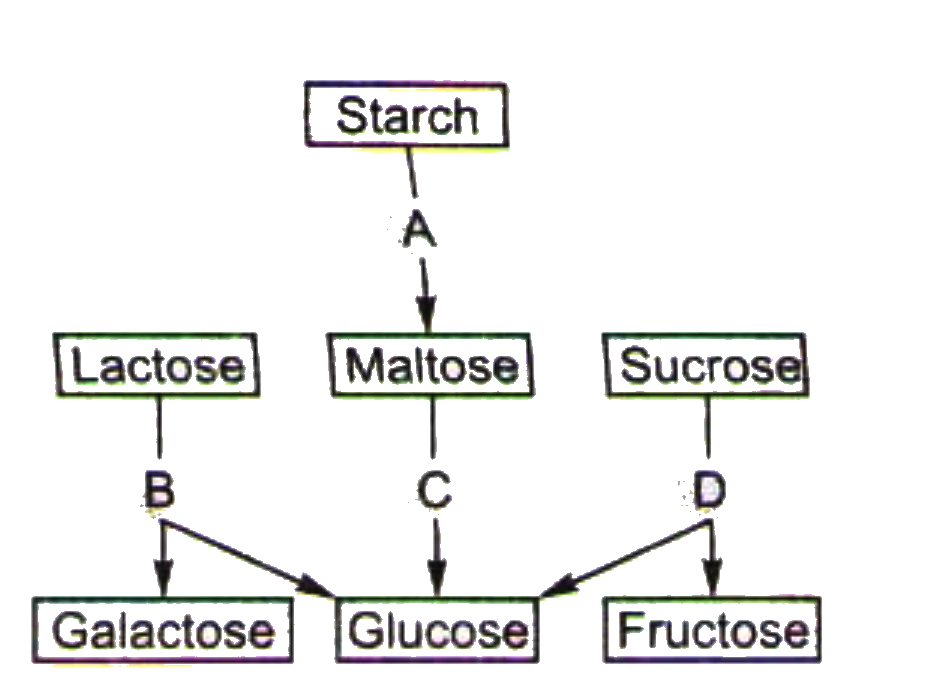 View Solution
The following is a simplified scheme showing the fate of glucose during aerobic and annaerobic respiration. Identify the end products that are formed at stages indicated as A,B, C and D. Identify the correct option from those given below.
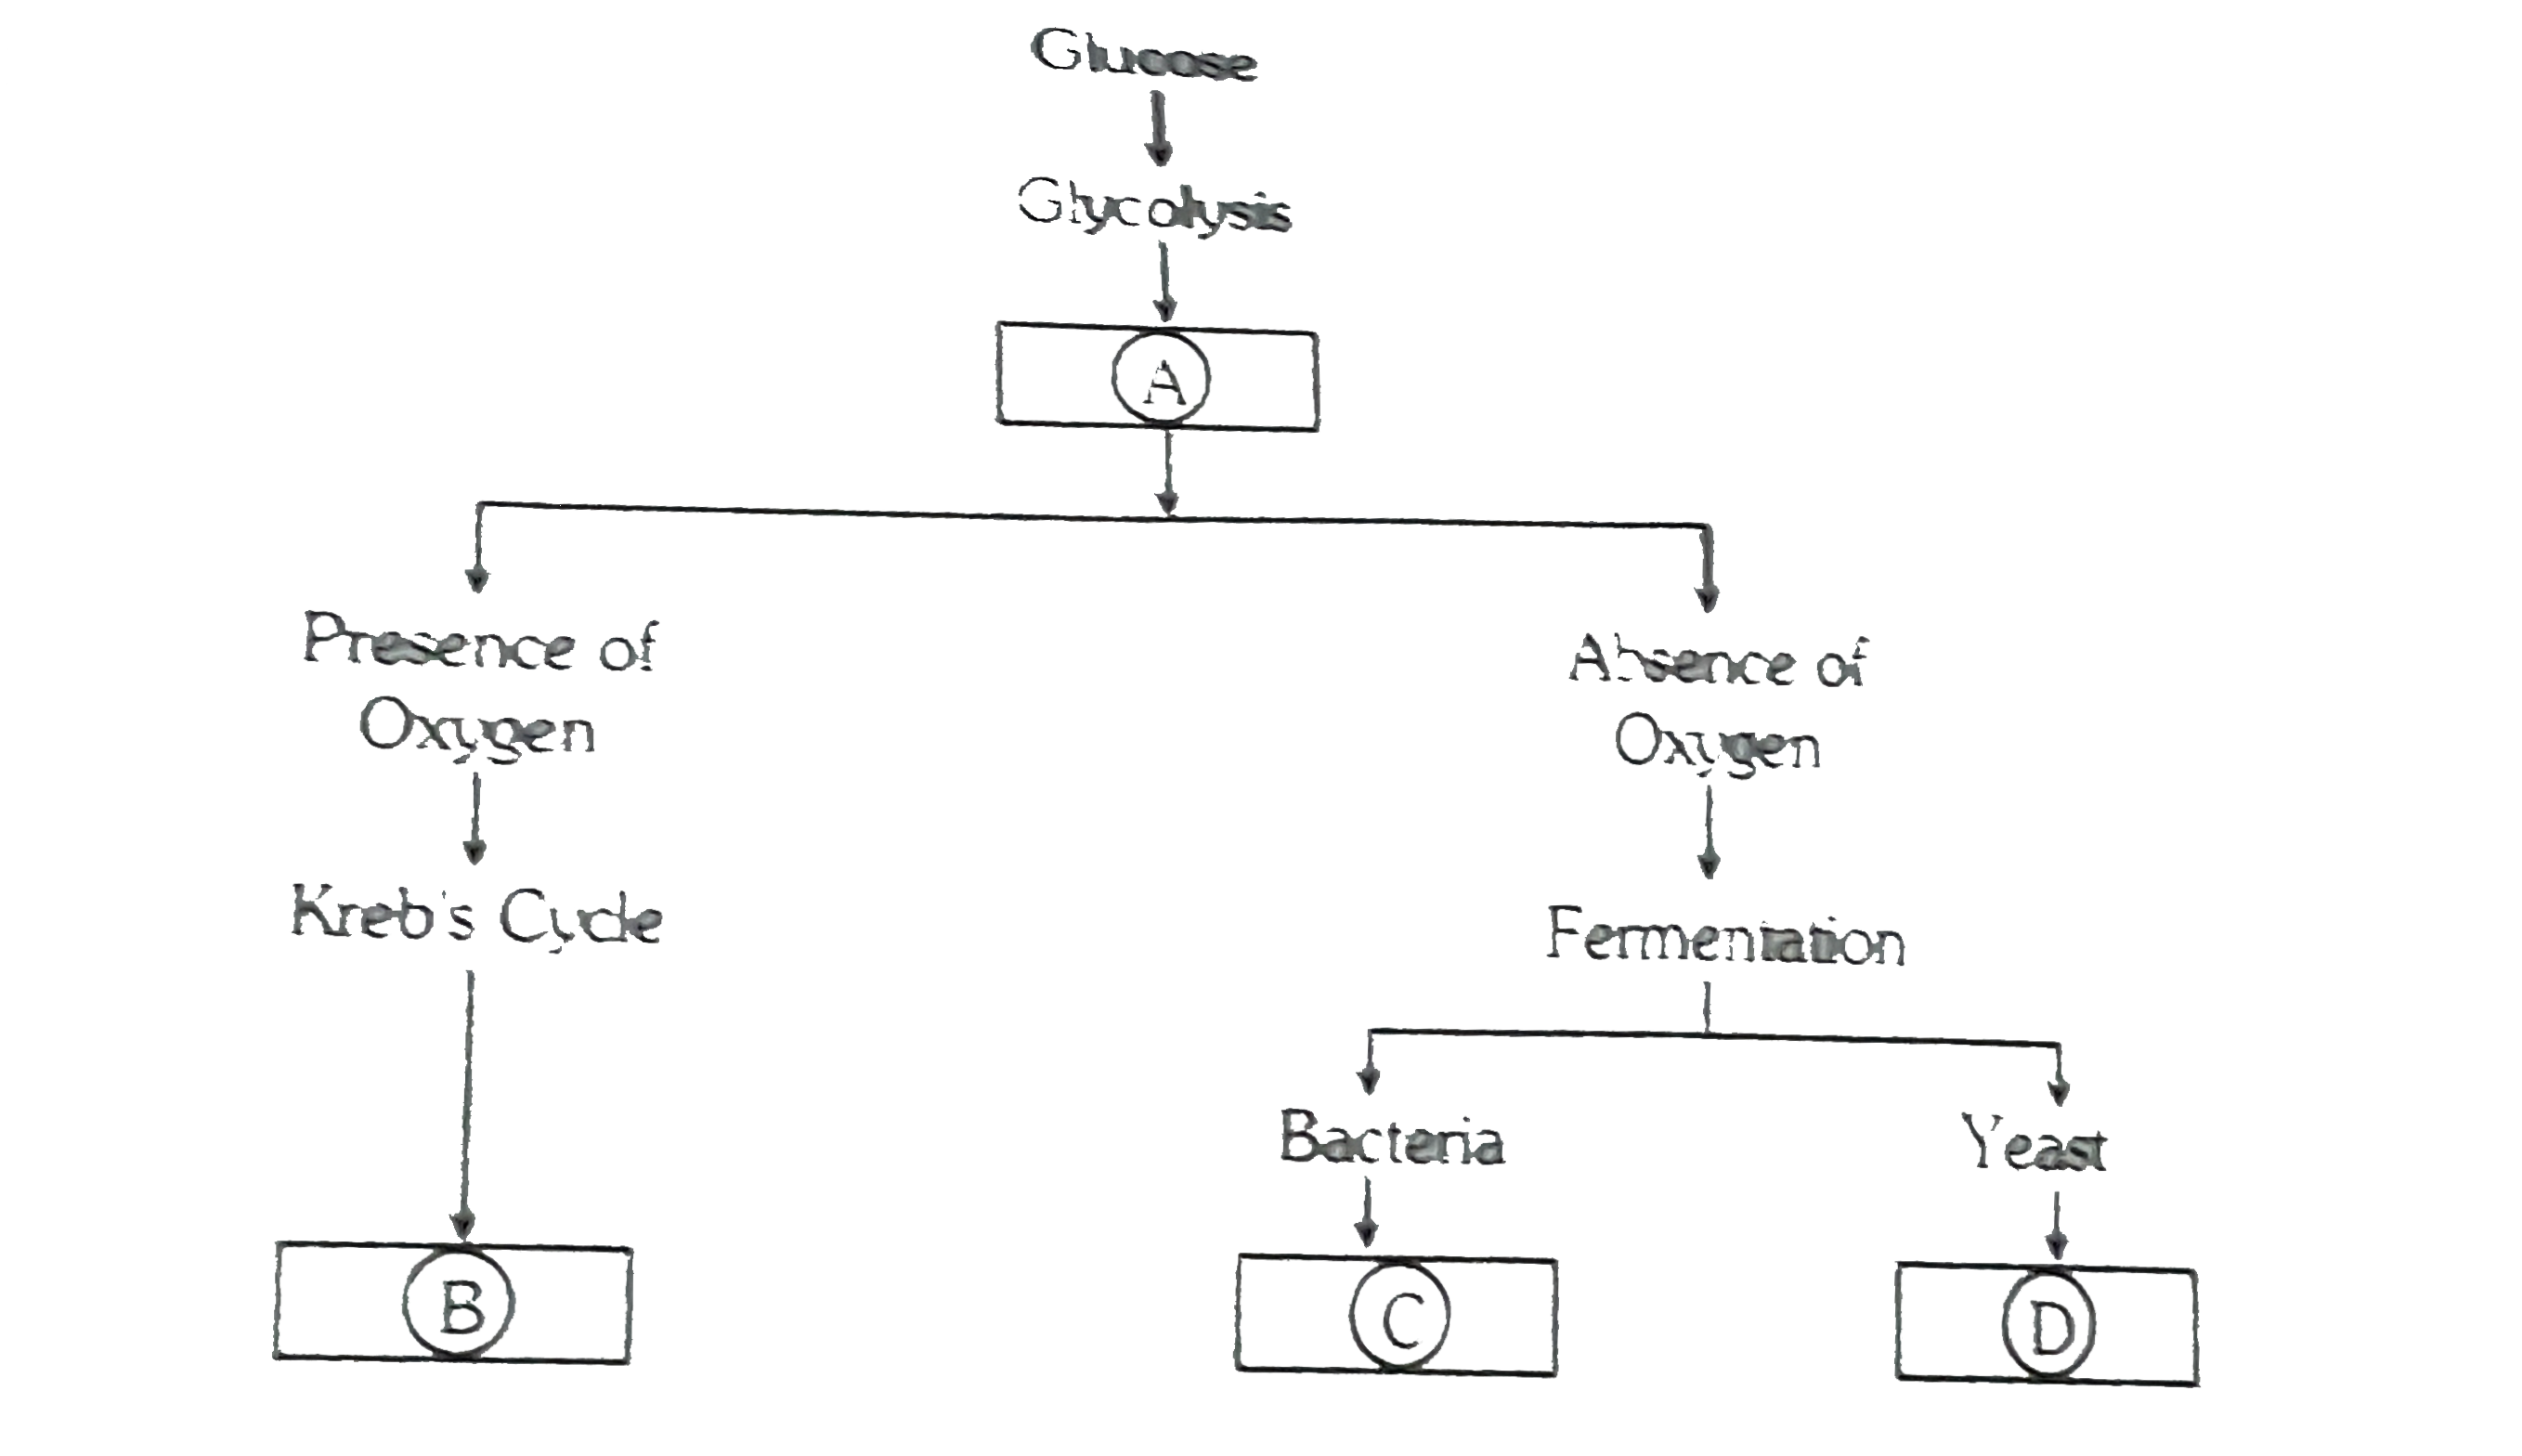 View Solution
Given below is a diagram showing different parts of an eye
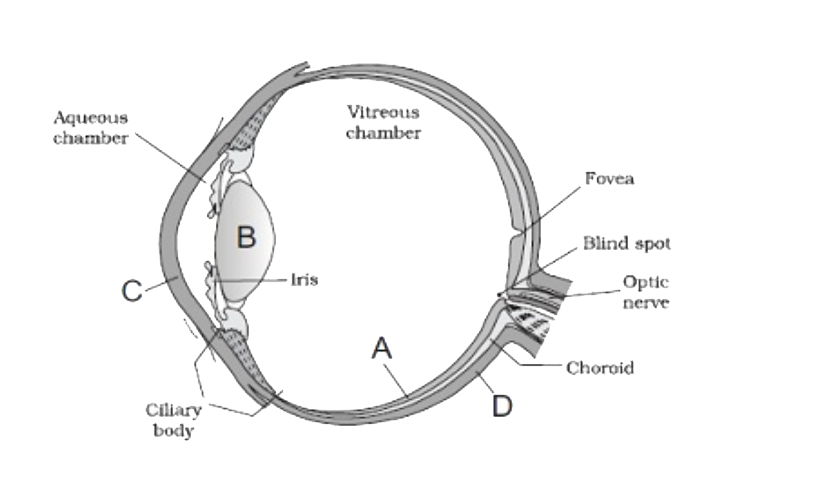
Some parts are labeled as A,B,C and D.
Read the following statements about these parts and choose the correct oneView SolutionThe diagram given below [Fig] shows how things get to and from the liver. They are labelled as A, B, C, D, E and F. Which one of the following labellings is correct
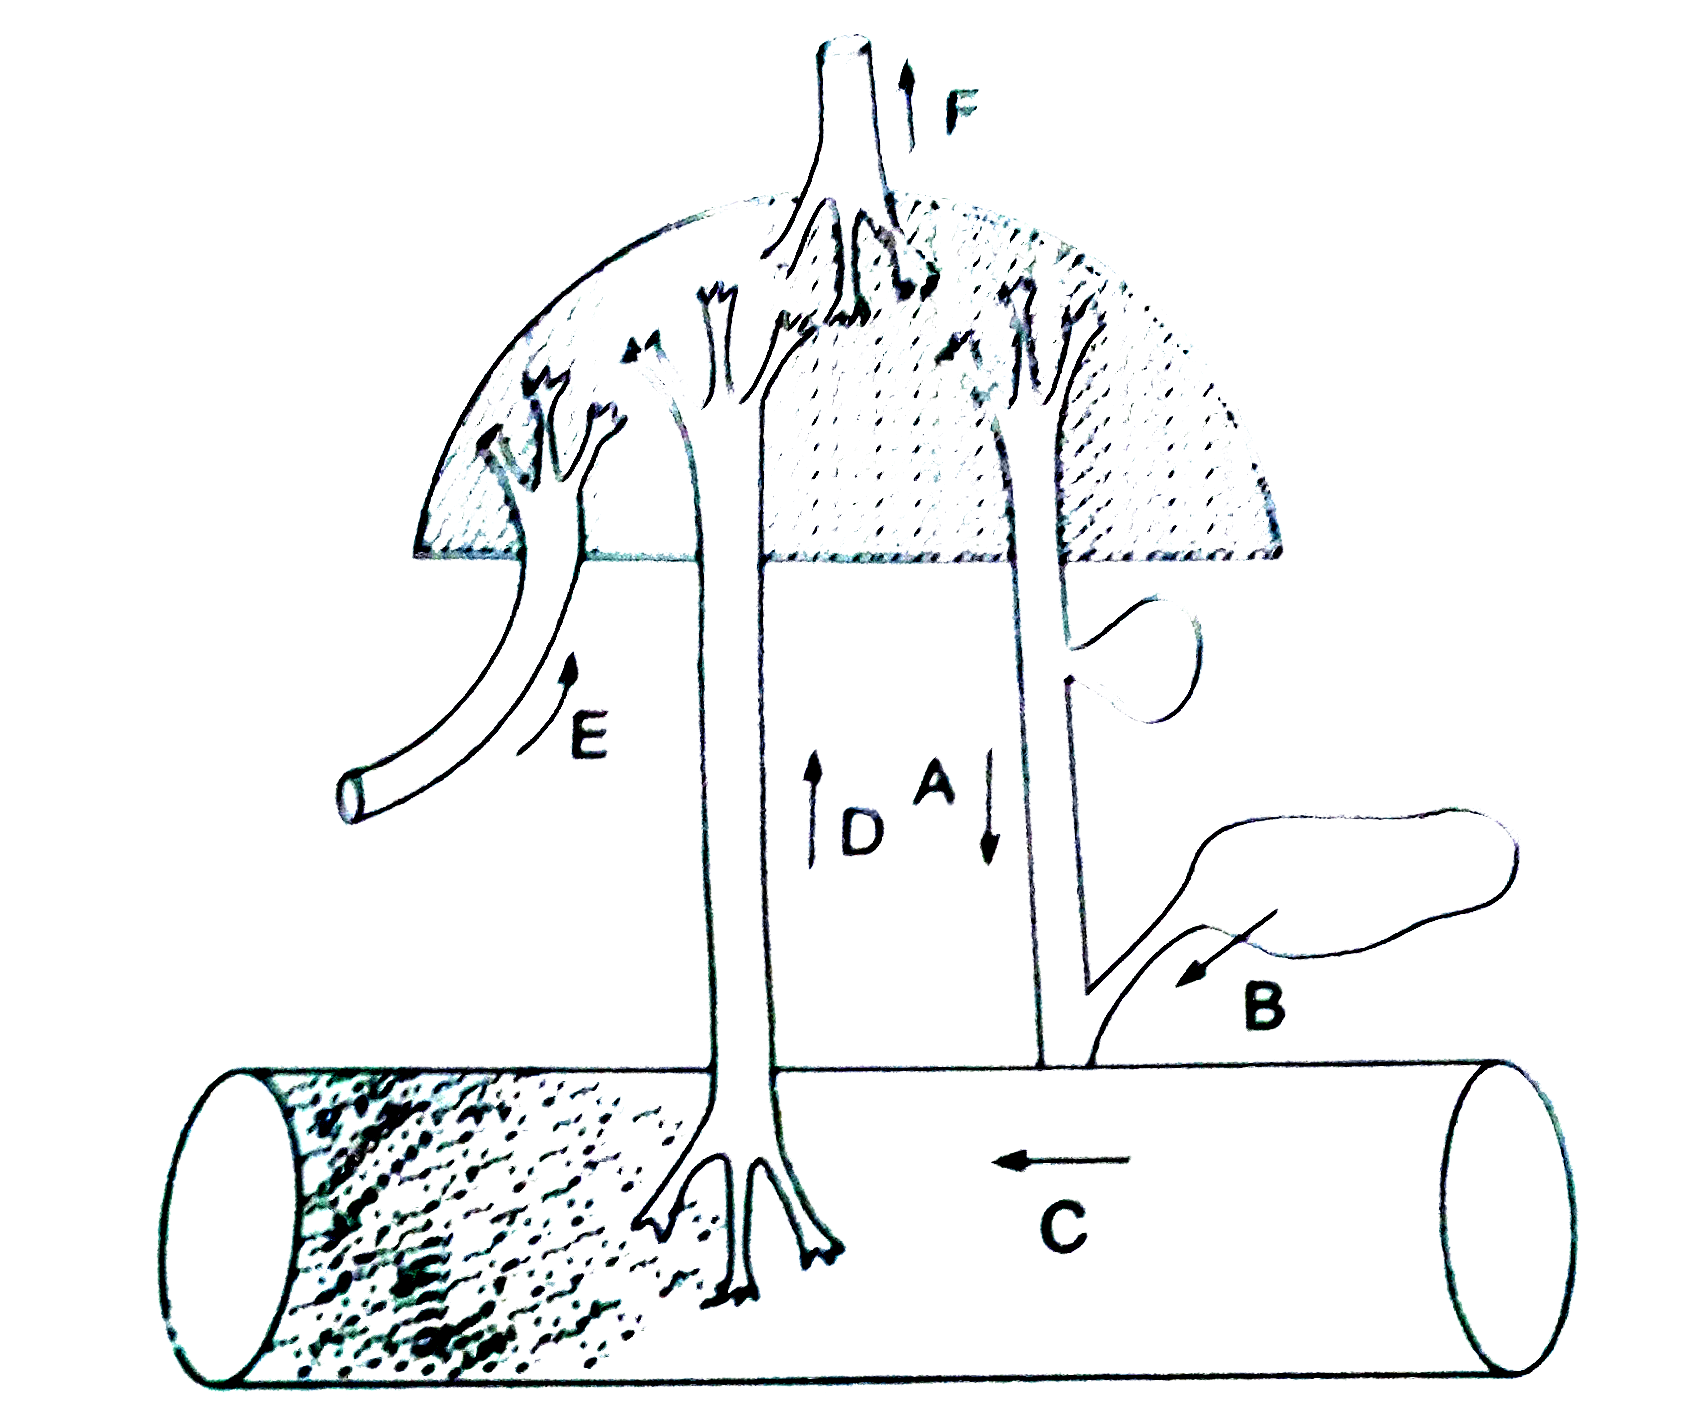
Choose the correct optionView SolutionThe diagram given below shows how things get to and from the liver. They are labelled as A, B, C, D, E and F. Which one of the following labellings is correct

Choose the correct optionView SolutionFollowing table represents the lengths of six different ribbons.

f the given data has to be represented as a bar graph, then select the most appropriate scale from the given options that can be used to draw the bar graph.
1 unit = 1 cmView SolutionFollowing table represents the lengths of six different ribbons.

f the given data has to be represented as a bar graph, then select the most appropriate scale from the given options that can be used to draw the bar graph.
1 unit = 3 cmView Solution

