Study the charactristics of a population represented in the graphs below.
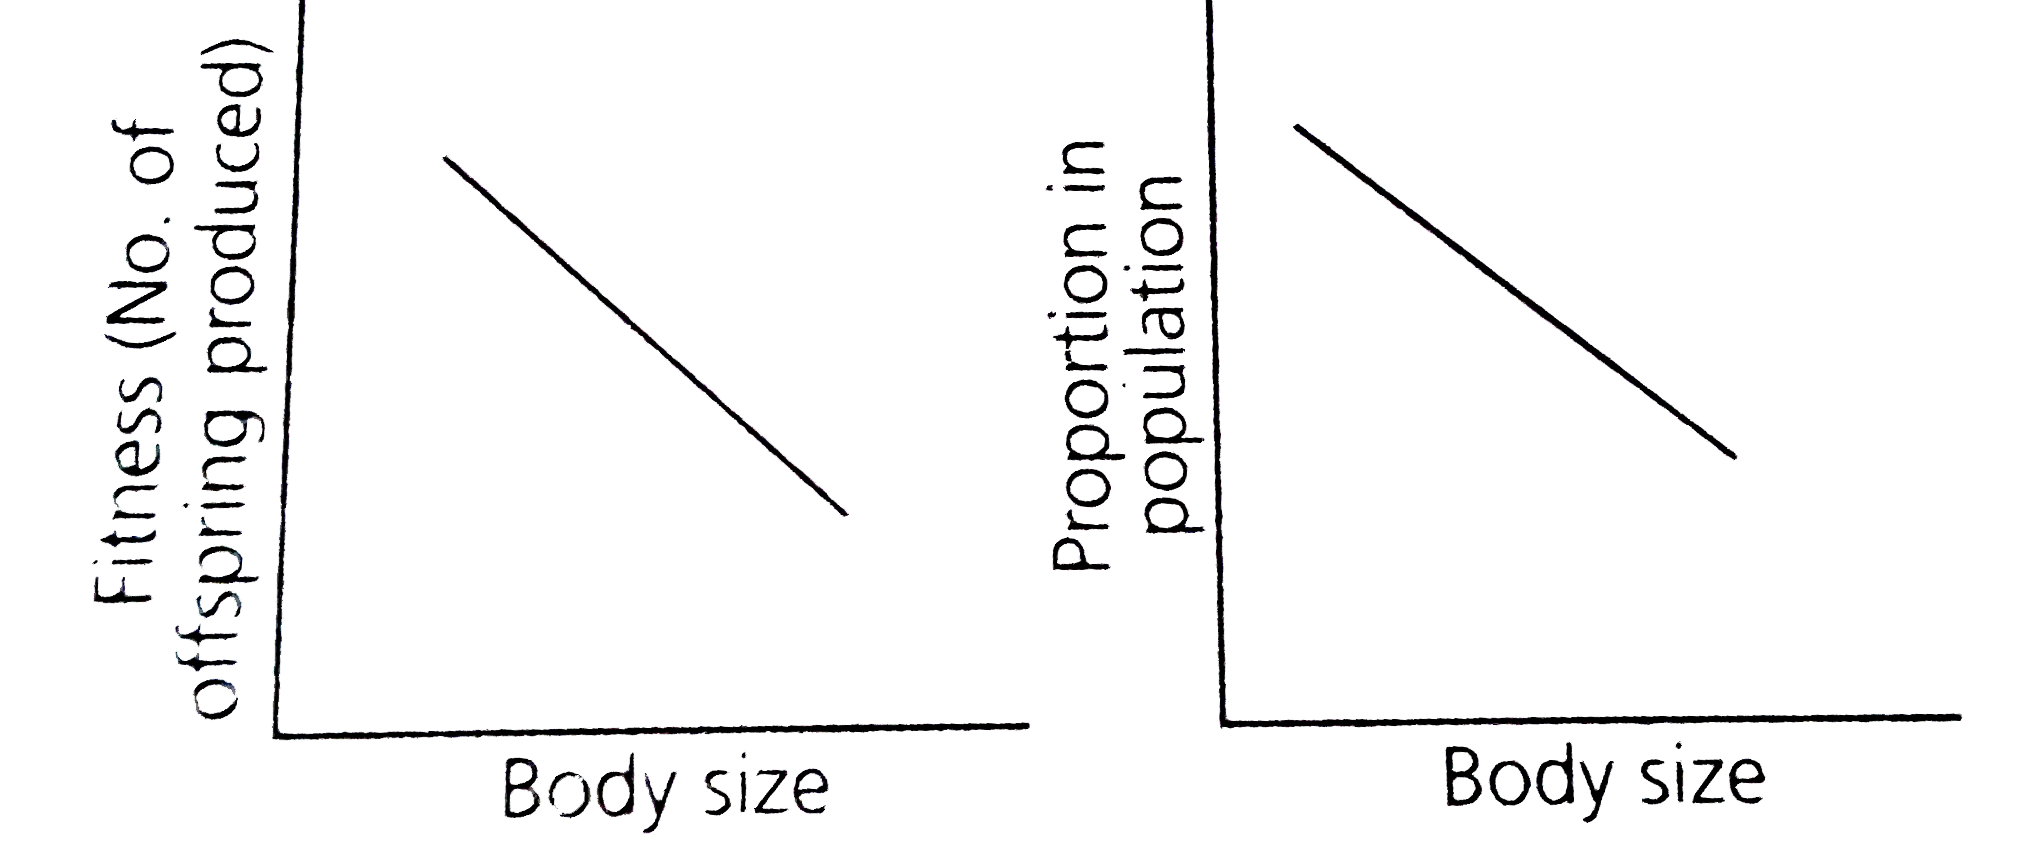
Mark the correct graph that represents the type of selection that this population is likely to undergo
A
Directional selection
B
Stablising selection
C
Disruptive selection
D
Balancing selection
Video Solution
Text Solution
The correct Answer is:A
This population is likely to undergo directional selection, in which the population changes towards one particualr direction. Here, directional selection is favouring small sized individuals and more individuals of that type will be present in enxt generation. Hence the means size of population changes.
|
Updated on:21/07/2023
Topper's Solved these Questions
Similar Questions
Knowledge Check
- Question 1 - Select One
The age structures of a population represents
Arelative number of individuals at each ageBnumber of new borns each yearCnumber of individuals reaching puberty each yearDrelative number of deaths at each age - Question 2 - Select One
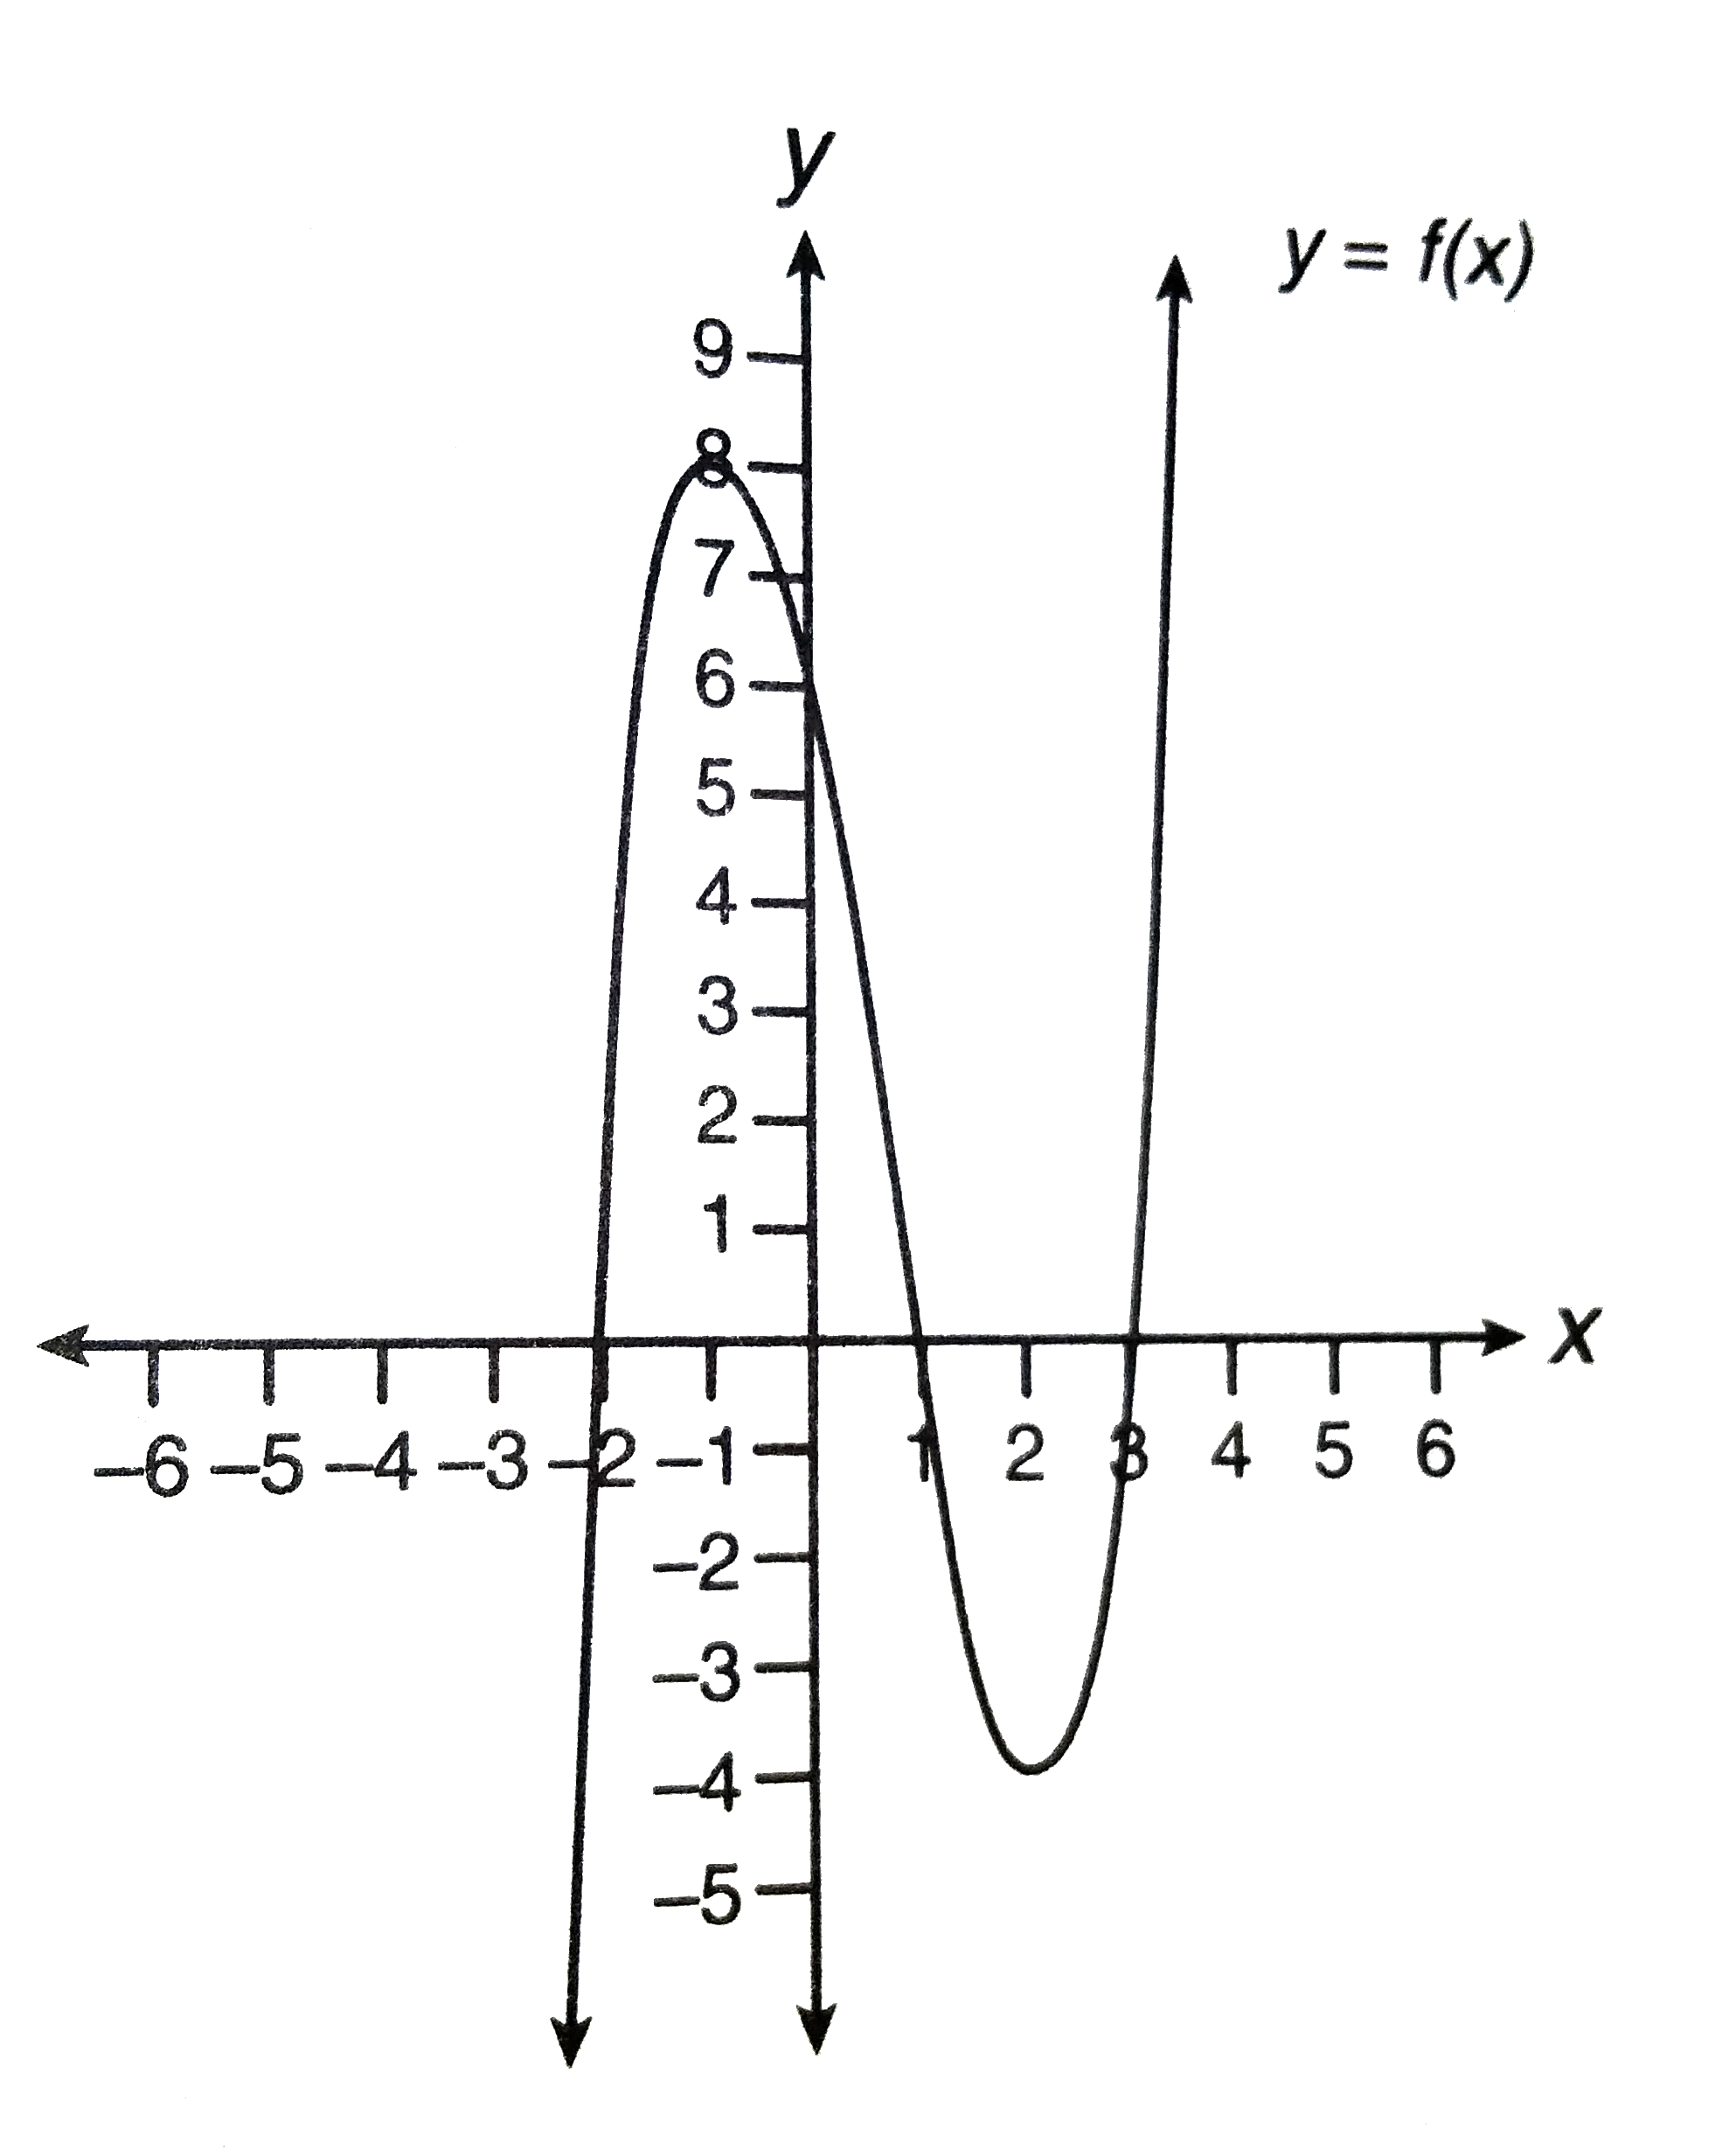
Which function could represents the graph above?Af(x)=(x−6)(x2−4x+3)Bf(x)=(x−3)(x2+x−2)Cf(x)=(x−1)(x2−5x−6)Df(x)=(x+2)(x2−4x−12)
An exothermic reaction is represented by the graph :
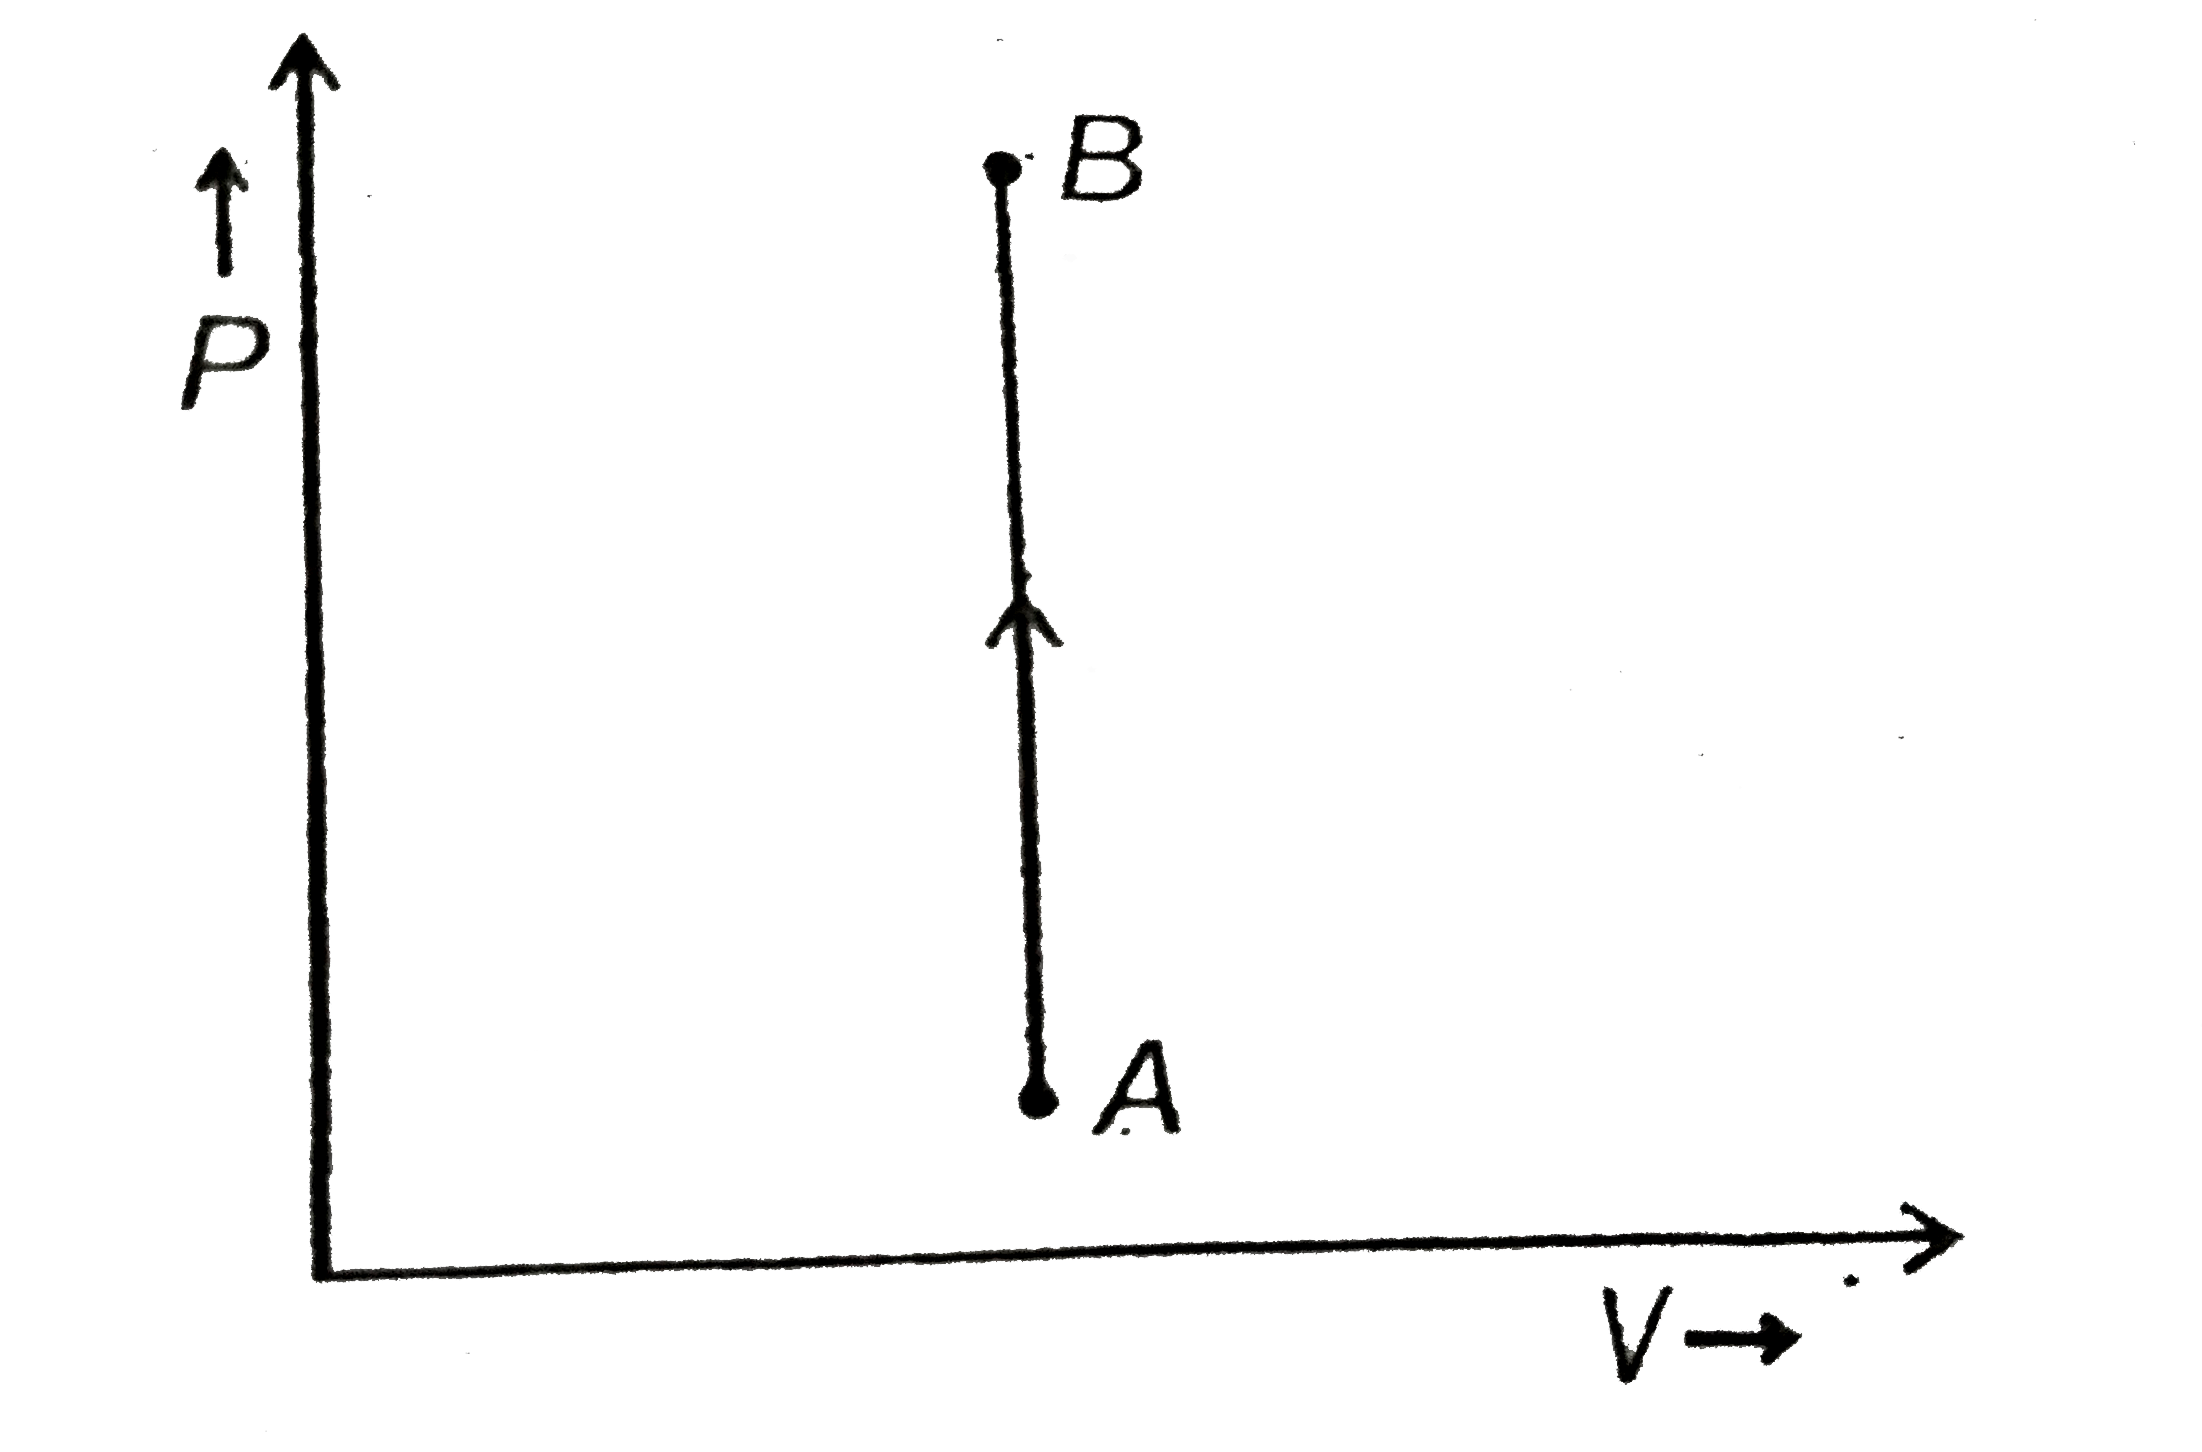
View SolutionThe following graph represents
 View Solution
Which graph represents positive acceleration ?
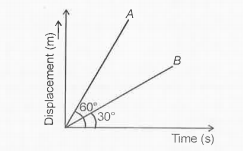
View SolutionThe ratio of velocities represented by lines A and B in the graph below is
 View Solution
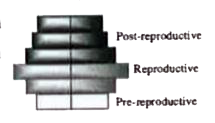
What type of human population is represented by the following age pyramid
 View Solution
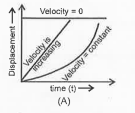
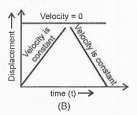
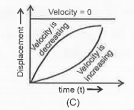
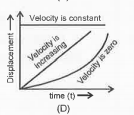
Some characteristics of velocity on displacement-time graph are show on graphs below. Which graph correctly represents the characteristics :
 View Solution


