Graphic representation indicating evolutionary relationships of group is
Dendrogram
Cladogram
α-Taxonomy
Hierarchy.
To solve the question, "Graphic representation indicating evolutionary relationships of group is," we can follow these steps:
Step 1: Understand the Question
The question is asking for a specific type of graphic representation that illustrates the evolutionary relationships among different groups of organisms.
Step 2: Analyze the Options
The options provided are:
1. Dendrogram
2. Cladogram
3. Alpha taxonomy
4. Hierarchy
Step 3: Define Each Option
- Dendrogram: A tree-like diagram that represents the arrangement of clusters based on their similarities or differences. It is commonly used in numerical taxonomy.
- Cladogram: A diagram that shows the evolutionary relationships between organisms based on shared characteristics, specifically focusing on their ancestry.
- Alpha taxonomy: This refers to the classification of organisms based on morphological characteristics, rather than a graphical representation.
- Hierarchy: This is a system of ranking organisms based on their status or position within a classification system, not a graphic representation.
Step 4: Identify the Correct Answer
From the definitions:
- A dendrogram is a graphic representation that shows relationships among groups based on their similarities, which aligns with the question's requirement for indicating evolutionary relationships.
- A cladogram also represents relationships but focuses more on ancestry rather than a general evolutionary relationship.
Given that the question specifically asks for a graphic representation indicating evolutionary relationships, the best answer is Dendrogram.
Final Answer
The graphic representation indicating evolutionary relationships of a group is a Dendrogram.
---
The question is asking for a specific type of graphic representation that illustrates the evolutionary relationships among different groups of organisms.
The options provided are:
1. Dendrogram
2. Cladogram
3. Alpha taxonomy
4. Hierarchy
- Dendrogram: A tree-like diagram that represents the arrangement of clusters based on their similarities or differences. It is commonly used in numerical taxonomy.
- Cladogram: A diagram that shows the evolutionary relationships between organisms based on shared characteristics, specifically focusing on their ancestry.
- Alpha taxonomy: This refers to the classification of organisms based on morphological characteristics, rather than a graphical representation.
- Hierarchy: This is a system of ranking organisms based on their status or position within a classification system, not a graphic representation.
From the definitions:
- A dendrogram is a graphic representation that shows relationships among groups based on their similarities, which aligns with the question's requirement for indicating evolutionary relationships.
- A cladogram also represents relationships but focuses more on ancestry rather than a general evolutionary relationship.
The graphic representation indicating evolutionary relationships of a group is a Dendrogram.
Topper's Solved these Questions
- BIOLOGICAL CLASSIFICATION BOOK - DINESH PUBLICATION ENGLISHCHAPTER - BIOLOGICAL CLASSIFICATION EXERCISE - CYC
13 Videos
- BIOENERGYBOOK - DINESH PUBLICATION ENGLISHCHAPTER - BIOENERGYEXERCISE - Check Your Grasp
10 Videos
- CELL CYCLE (CELL DIVISION)BOOK - DINESH PUBLICATION ENGLISHCHAPTER - CELL CYCLE (CELL DIVISION)EXERCISE - BRAIN TEASERS-III
85 Videos
Similar Questions
Knowledge Check
The true graphical representation of volume versus temperature relationship at constant pressure is :
A B
B C
C D
D
A phylogenetic tree or evolutionary tree is a branching diagram shown the inferred evolutionary relationships among various biological species. Which of the following phylogenies is correctly represented?
A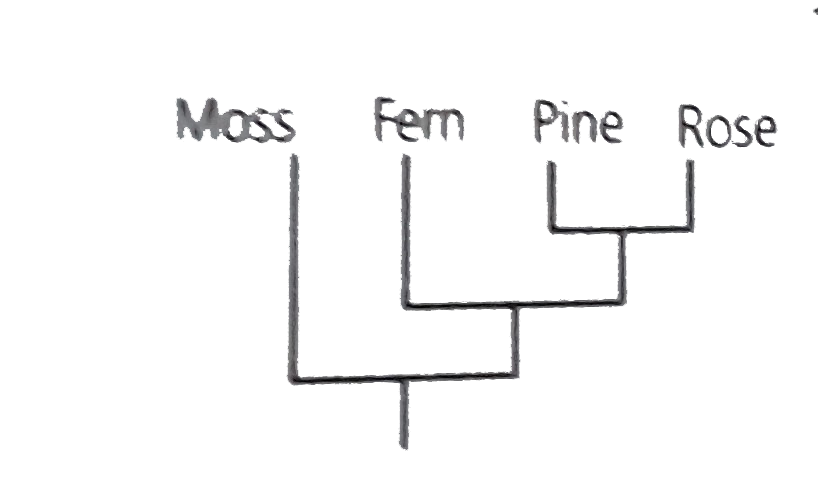 B
B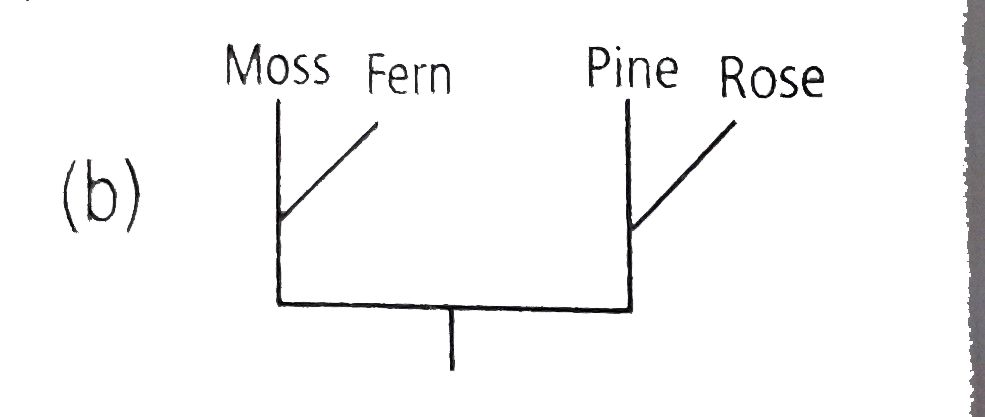 C
C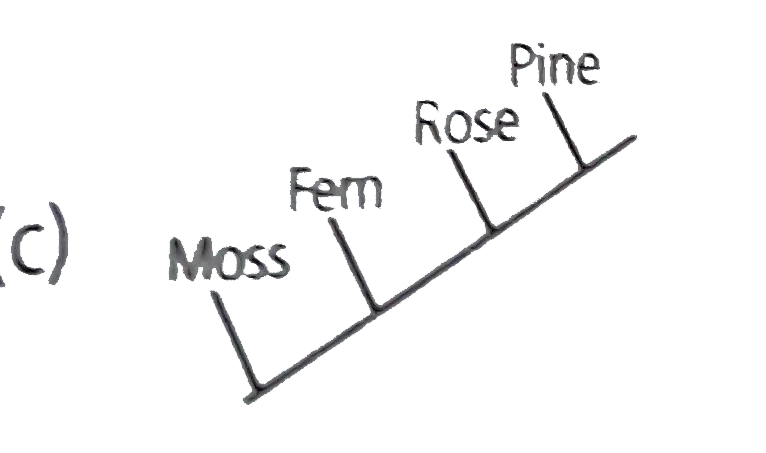 D
D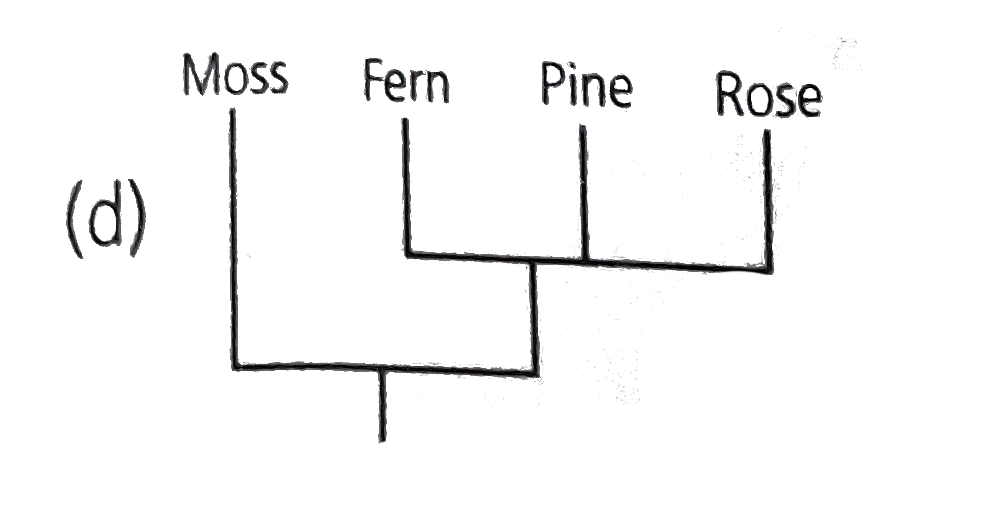
Following is given the diagrammatic representation of evolutionary history of vertebrates through geological periods. Identify the geological periods (A,B,C and D) and select the correct option.
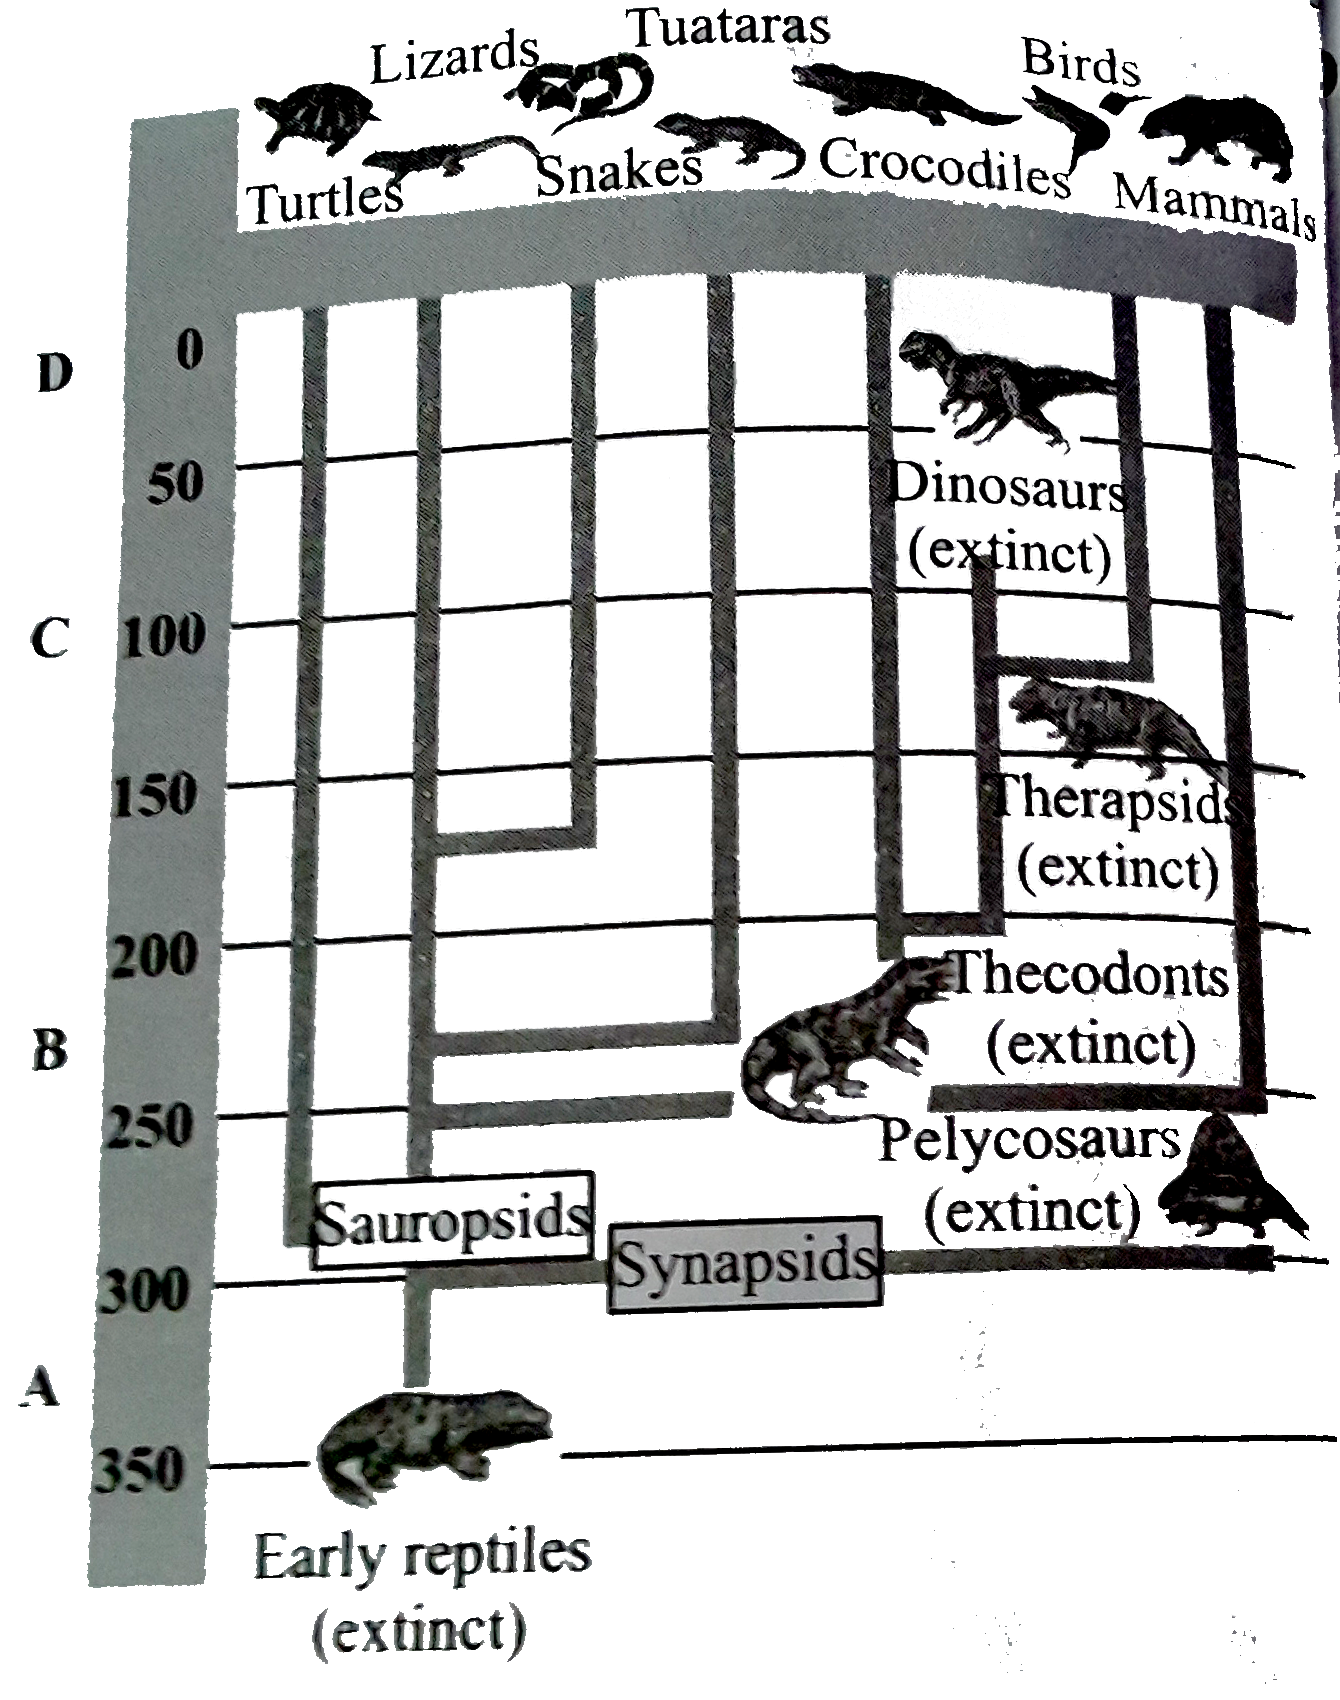 AABCDCarboniferusTriassicCretaceousQuaternaryBABCDJurassicPermianTertiaryCretaceousCABCDPermianJurassicQuatermaryTertiaryDABCDCretaceousQuaternaryCarboniferousJurassic
Family tree based on evolutionary relationship is called
View SolutionThe evolutionary sequence is
View SolutionThe graphic representation of interrelationship between plants and animals is
View SolutionSelect which is correct representation for diagonal relationships in periodic table.
View SolutionName two homologous structures in vertebrates. How do such organs help in understanding evolutionary relationship ?
View Solution
