In an asexually reproducing species, if a trait X exists in 5% of a population and trait Y exists in 70% of the same population, which of the two trait is likely to have arisen earlier? Give reason.
To determine which trait, X or Y, is likely to have arisen earlier in an asexually reproducing species, we can analyze the prevalence of these traits in the population.
1. Understanding Asexual Reproduction: In asexual reproduction, an organism produces offspring that are genetically identical to itself. This means there is little to no genetic variation among the offspring.
2. Analyzing Trait Prevalence: We have two traits in the population:
- Trait X exists in 5% of the population.
- Trait Y exists in 70% of the population.
3. Implications of Trait Prevalence:
- A trait that is present in a higher percentage of the population (in this case, Trait Y at 70%) is likely to have been established earlier in the population. This is because a higher prevalence indicates that the trait has been successfully passed on to a larger number of offspring over time.
- Conversely, a trait that is present in a lower percentage (Trait X at 5%) is likely to have arisen more recently, as it has not yet spread widely through the population.
4. Conclusion: Based on the analysis, Trait Y, which exists in 70% of the population, is likely to have arisen earlier than Trait X, which exists in only 5% of the population.
Final Answer:
Trait Y is likely to have arisen earlier than Trait X.
---
- Trait X exists in 5% of the population.
- Trait Y exists in 70% of the population.
- A trait that is present in a higher percentage of the population (in this case, Trait Y at 70%) is likely to have been established earlier in the population. This is because a higher prevalence indicates that the trait has been successfully passed on to a larger number of offspring over time.
- Conversely, a trait that is present in a lower percentage (Trait X at 5%) is likely to have arisen more recently, as it has not yet spread widely through the population.
Trait Y is likely to have arisen earlier than Trait X.
Topper's Solved these Questions
- SAMPLE PAPER 2022 TERM IIBOOK - CBSE MODEL PAPERCHAPTER - SAMPLE PAPER 2022 TERM IIEXERCISE - SECTION B
1 Videos
- SAMPLE PAPER 2022 TERM IIBOOK - CBSE MODEL PAPERCHAPTER - SAMPLE PAPER 2022 TERM IIEXERCISE - SECTION C
2 Videos
- SAMPLE PAPER 2022BOOK - CBSE MODEL PAPERCHAPTER - SAMPLE PAPER 2022EXERCISE - ALTERNATIVE QUESTIONS(SECTION A)
5 Videos
- SAMPLE PAPER 2023 TERM IBOOK - CBSE MODEL PAPERCHAPTER - SAMPLE PAPER 2023 TERM IEXERCISE - SECTION-E
2 Videos
Similar Questions
If a trait A exists in 10% of a population of an asexually reproducing species and a trait B exists in 60% of the same population, which trait is likely to have arisen earlier?
View SolutionIf a trait A exists in 10% of a population of an asexually reproducing species and a trait B exists in 60% of the same population, which trait is likely to have arisen earlier?
View Solution
Knowledge Check
The presence of recessive trait in a large population is be 16% the frequency of dominant trait in that population is :-
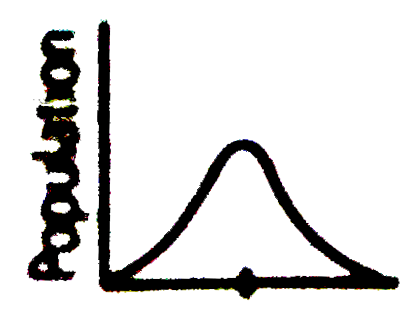
A0.84B0.42C0.56D0.96The given graph shows the range of variation among population members for a trait determined by multiple genes. If this population is subjected to disruptive selection for several generations, which of the following distributions is most likely to result?
 A
A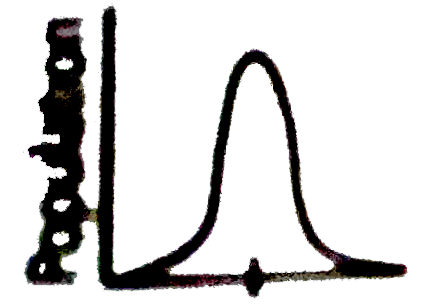 B
B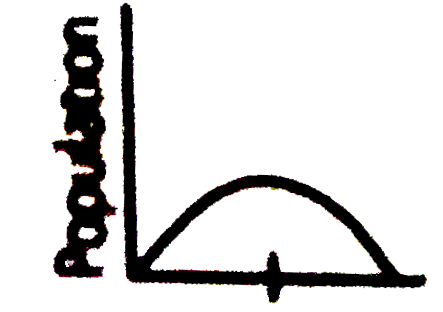 C
C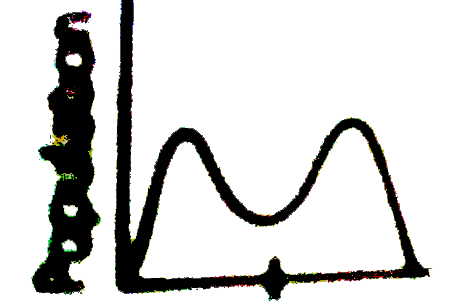 D
D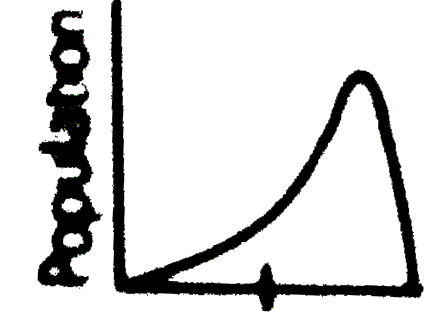
The given graph shows the range of variation among population members for a trait determined by multiple genes. If this population is subjected to disruptive selection for several generations, which of the following distributions is most likely to result?
 A
A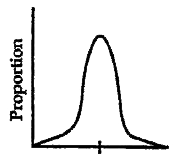 B
B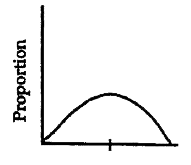 C
C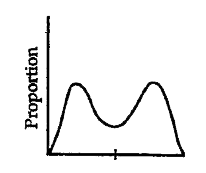 D
D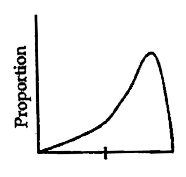
If a trait A exists in 10% of a population of an asexually reproducing species and a trait B exists in 60% of the same population, which trait is likely to have arisen earlier.
View SolutionIf a trait A exists in 10% of a population of an asexually reproducing species and a trait B exists in 60% of the same population, which trait is likely to have arisen earlier?
View SolutionYou are given two nuclei .3X7 and .3Y4. Explain giving reasons, as to which one of the two nuclei is likely to be more stable?
View SolutionThe following graph shows the range of variation among population members for a trait determined by multiple genes.
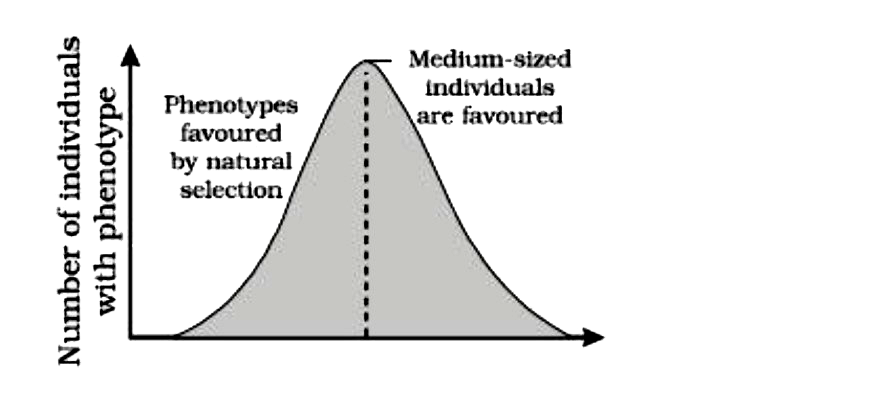
If this population is subject to stabilizing selection for several generations, which of the distribution is most likely to result ?
View SolutionWrite one main difference between asexual and sexual mode of reproduction. Which species is likely to have comparatively better chances of survival - the one reproducing asexually or the one reproducing sexually ? Give reason to justify your answer.
View Solution
